the Creative Commons Attribution 4.0 License.
the Creative Commons Attribution 4.0 License.
 | 30 Sep 2022
Comparison of bulk and sequential sampling methodologies on mammoth tooth enamel and their implications in paleoenvironmental reconstructions
Zuorui Liu
Amy Prendergast
Russell Drysdale
Jan-Hendrik May
Liu, Z., Prendergast, A., Drysdale, R., and May, J.-H.: Comparison of bulk and sequential sampling methodologies on mammoth tooth enamel and their implications in paleoenvironmental reconstructions, E&G Quaternary Sci. J., 71, 227–241, https://doi.org/10.5194/egqsj-71-227-2022, 2022.
Mammoth teeth have been widely investigated using stable-isotopic analysis for paleoenvironmental and paleoecological reconstructions due to their large size and frequent discoveries. Many past investigations sampled the tooth enamel with the “bulk” method, which involves drilling one sample from the occlusal surface to the root for each tooth. Some of the more recent studies applied the “sequential” method, with a sequence of samples drilled following the dominant enamel growth direction to produce a time series of isotopic oscillations that reflects high-resolution environmental changes, as well as changes in mammoth dietary behavior. Although both the bulk and mean sequential δ18O values are expected to represent the averaged signal over the time of tooth formation, it is uncertain whether their paleoenvironmental records were formed during similar periods of time. In this study, we applied both sampling methods (sequential drilling first followed by a thin layer of bulk drilling) on the same enamel ridges of multiple mammoth teeth and compared their respective δ18O values. The results indicated that, in most enamel ridges, the bulk samples have more negative δ18O values compared to the average sequential values, and some of the bulk values even fall outside the range of sequential values. The most likely explanation for the differences is the structure and formation stages of enamel that caused uneven distributions of different seasons recorded in the samples. This finding provides insights into current limitations of the two sampling methods and the applicability of cross-method data comparison from past studies.
Aufgrund ihrer relativen Fundhäufigkeit und Grösse werden Mammuthmolare vielfach für paläoökologische Zwecke und Umweltrekonstruktionen mit Hilfe von stabilen Isotopen herangezogen. Bei vielen der bislang publizierten Arbeiten wurde dabei Zahnschmelz mit der “Bulk”-Methode beprobt, bei der für jeden Zahn eine einzelne Probe von der Kaufläche bis zur Wurzel gebohrt wird. Neuere Studien wenden nun die “sequenzielle” Methode an, bei der eine Reihe von Proben entlang der Hauptwachstumsrichtung des Zahnschmelzes gebohrt wird, um die Variation der Isotopenwerte über die Zeit zu bestimmen, welche sowohl hochauflösende Umweltveränderungen als auch Veränderungen im Ernährungsverhalten der Mammuts widerspiegeln kann. Obwohl sowohl “Bulk”- als auch die gemittelten sequenziellen δ18O-Werte ein zeitlich gemitteltes Signal der Zahnbildung repräsentieren sollten, ist bislang nicht klar, inwieweit diese Werte tatsächlich den selben, direkt vergleichbaren Zeitraum wiederspiegeln. In dieser Studie haben wir beide Methoden der Probenahme (zuerst sequenzielle Proben, dann eine dünne Schicht von “Bulk”-Proben) an denselben Schmelzkämmen mehrerer Mammutzähne angewandt und ihre jeweiligen δ18O-Werte verglichen. Die Ergebnisse zeigen, dass in den meisten Schmelzkämmen die “Bulk”-Proben im Vergleich zu den mittleren sequenziellen Werten negativere δ18O-Werte aufweisen, und einige der “Bulk”-Werte sogar außerhalb der Variationsbreite der sequenziellen Werte liegen. Die wahrscheinlichste Erklärung für diese Unterschiede liegt in der Struktur sowie den Bildungsraten und -stadien des Zahnschmelzes, welche eine ungleichmäßige Verteilung der verschiedenen in den Proben erfassten Jahreszeiten verursachen. Die Ergebnisse geben Einblick in die derzeitigen Grenzen der beiden Probenahmeverfahren und ermöglichen damit einen kritischeren und verbesserten methoden-übergreifenden Datenvergleich.
- Article
(2943 KB) - Full-text XML
- BibTeX
- EndNote


Stable-isotopic analysis on mineralized tissues of animals has added great knowledge to our understanding of past environments and climates. Among all the animal tissues, Pleistocene mammoth teeth and tusks are of special interest for paleoenvironmental and paleoclimatic reconstructions over the past decades due to their large size and frequent discoveries. Oxygen-isotope ratios in mammoths can represent their surrounding environmental properties because they are directly related to the isotopic ratios of their ingested environmental water, which in turn primarily reflects regional temperature and water balance (Dansgaard, 1964; Longinelli, 1984; Luz et al., 1984). Previous studies of oxygen isotopes in mammoth remains have provided paleoenvironmental records in Europe and North America from Marine Isotope Stage (MIS) 5 to MIS 2 (130–22 ka cal BP). In most previous studies, the sampling method has been drilling one “bulk” sample from each tooth from the occlusal surface to the root (Genoni et al., 1998; Tütken et al., 2007; Ukkonen et al., 2007; Iacumin et al., 2010; Kovács et al., 2012; Pryor et al., 2013). The purpose of bulk sampling is to try to cover the longest possible period of time of tooth formation (Pryor et al., 2013), as the sample should represent an averaged isotopic signal across the tooth formation time (Fricke and O'Neil, 1996; Sharp and Cerling, 1998; Hoppe, 2004). Although this method can effectively reconstruct the averaged paleoclimatic conditions over several years, the temporal resolution of reconstruction is limited to decadal scale, and consequently, a very small amount of data exist on sub-annual environmental conditions and climatic variations during the Quaternary from these regions. Such data, however, are crucial in understanding how the highly variable climate of the Late Pleistocene translated into regional- to local-scale environmental conditions, ultimately affecting a range of animal–environmental and human–environmental interactions (Denton et al., 2005; Bradtmöller et al., 2012; Prendergast and Schöne, 2017; Prendergast et al., 2018).
To address this issue, a “sequential” approach has also been applied to mammoth and isotope research in some studies (Koch et al., 1989; Fisher and Fox, 2007; Metcalfe and Longstaffe, 2012; Widga et al., 2021; Wooller et al., 2021). Like most mammal species, mammoth tooth enamel has a dominant growth direction from the occlusal surface to the roots at a relatively constant rate (Metcalfe and Longstaffe, 2012). Therefore, it has the potential to yield highly resolved time series of paleoenvironmental information over the course of tooth formation. In several recent studies, multiple sequential samples were drilled from the same mammoth tooth following its growth direction with a resolution up to 1mm per sample, forming a time series of isotopic oscillations that likely reflects paleoenvironmental changes at sub-annual scales (Metcalfe and Longstaffe, 2012; Wooller et al., 2021; Miller et al., 2022). The mean value of the sequential samples should therefore reflect the averaged isotopic signal during the period of time of tooth growth, which is also what the bulk sample is expected to represent. However, this remains untested, and it is unknown whether the mean sequential value and the bulk value obtained from the same mammoth tooth yield similar isotopic compositions, as well as whether they have recorded the environmental properties during approximately the same period of time. Due to this limitation, it is still uncertain whether isotopic results obtained from bulk and sequential sampling methods can be directly compared, interpreted, and used for paleoenvironmental reconstruction.
In this study, we explored the potential differences between the sequential and the traditional bulk sampling methods. We obtained four mammoth teeth of MIS 3 age from southwestern Germany and applied both sampling methods on each tooth. The bulk and average sequential δ18O values from the same tooth were then compared.
2.1 Mammoth tooth growth
Similar to modern elephants, the woolly mammoths (Mammuthus primigenius) had six sets of teeth and a total number of 24 molar teeth throughout their lifespan. At any one time only one tooth was fully in operation in each of the four jaws (Maschenko, 2002; Lister and Bahn, 2007). Each molar tooth of M. primigenius is a combination of 22–24 molar plates (Lister and Bahn, 2007), which are flat thin sections of dentine folded in enamel. Each molar plate is adhered by cementum (Ferretti, 2003). The apex of these molar plates forms the occlusal surface for grinding food, and their lateral outer surface is exposed, forming separate enamel ridges (Fig. 1).

Figure 1A photograph and its corresponding schematic diagram of a mammoth molar tooth used in this study (UW-1).
Within each molar plate, mammoth tooth enamel has primary and secondary stages of formation (Smith, 1998; Smith and Tafforeau, 2008). During the secretory (primary) stage, daily incremental features grow from the enamel-dentine junction (EDJ) to the outermost surface, and these incremental lines are parallel to the EDJ under microscopic view (Metcalfe and Longstaffe, 2012). Tooth increments formed during the primary stage take up only about 20 %–30 % of the entire enamel weight (Passey and Cerling, 2002; Passey et al., 2005). The maturation (secondary) stage starts after the secretory stage ends, and it takes up most enamel weight and formation time (approximately two-thirds of total formation time) (Smith, 1998). During this stage, enamel formation starts at the apex (occlusal surface) near the EDJ side, growing dominantly along the tooth height to the root while extending to the outermost surface simultaneously. Secondary daily incremental features captured by microscopic analysis indicated that enamel growth direction is inclined at an angle of 55–60∘ to the EDJ (Metcalfe and Longstaffe, 2012).
2.2 Oxygen isotopes and mammoth water source
Oxygen isotopic composition in animal bioapatite can be used as an indicator of past climates and environmental conditions. For large-sized homeothermic animals (animals which can keep a constant body temperature) such as the mammoths, the δ18O values in their enamel carbonate are solely determined by the δ18O values in their body water (Longinelli, 1984; Luz et al., 1984). Mammoths were obligate drinkers, with more than two-thirds of their body water being obtained from direct consumption of environmental water (Koch et al., 1989; Ayliffe et al., 1992). Therefore, their body water δ18O values directly reflect those in their ingested environmental water, which are in turn primarily controlled by local- to regional-scale environmental factors such as discharge, precipitation, and air temperature (Dansgaard, 1964). A cyclicity of oxygen isotopic variations is expected from the sequentially drilled mammoth enamel samples, since they should reflect regional surface water δ18O values, and nearly all natural water bodies, including streams, estuaries, and lakes, experience seasonal oscillations of δ18O values due to seasonally differing water balances (Rozanski et al., 2001; Theakstone, 2003). The surface water isotopic content of any given water body is determined by the isotopic composition and amount of its water sources (input), as well as those of the water output (Rozanski et al., 2001; Benson and Paillet, 2002). In the context of the late Pleistocene Rhine River catchment (Fig. 2), the main input water sources for the catchment would have included groundwater, precipitation sourced from the Atlantic ocean, and snow and glacier melt, and output is primarily runoff and evaporation. These input water sources have different effects on the δ18O values in surface water. Glacier and snow meltwater usually have the most depleted ratio (Theakstone, 2003), and the ratio in precipitation and groundwater is usually more enriched than surface water (Theakstone, 2003; Yeh and Lee, 2018; Bedaso and Wu, 2021). We also analyzed modern hydrological data of the Rhine River (for the period 2005–2010 at Lobith, Netherlands) to better constrain the mechanism of isotopic oscillations. In the modern Rhine River, δ18O values show seasonal variations, with δ18O values being approximately 1 ‰ more negative during summer than in winter months (Rozanski et al., 2001). Under interglacial (Holocene) climatic conditions, the summer depletion is caused by increased contributions of meltwater from alpine glaciers (Rozanski et al., 2001). Therefore, in the sequential δ18O records from the mammoth teeth, local troughs (minima) in a curve are expected to correspond to the summer months when glacier melt is highest, and local peaks (maxima) are the coldest winter month. A cycle of isotopic variation should thus closely approximate the range of climatic variability throughout a year, with the distance between two neighboring maxima (or minima) corresponding to one “hydrological year” of tooth growth (Metcalfe and Longstaffe, 2012; Prendergast and Schöne, 2017).

Figure 2(a) A schematic diagram of mammoth water source model during the Late Pleistocene; (b) average modern monthly water δ18O values of the Rhine River (Lobith, Netherlands, 2005–2010). Error bars represent standard deviation. Data collected from local IAEA stations and retrieved from https://nucleus.iaea.org/wiser/index.aspx (last access: 24 March 2022).
3.1 Study location and materials
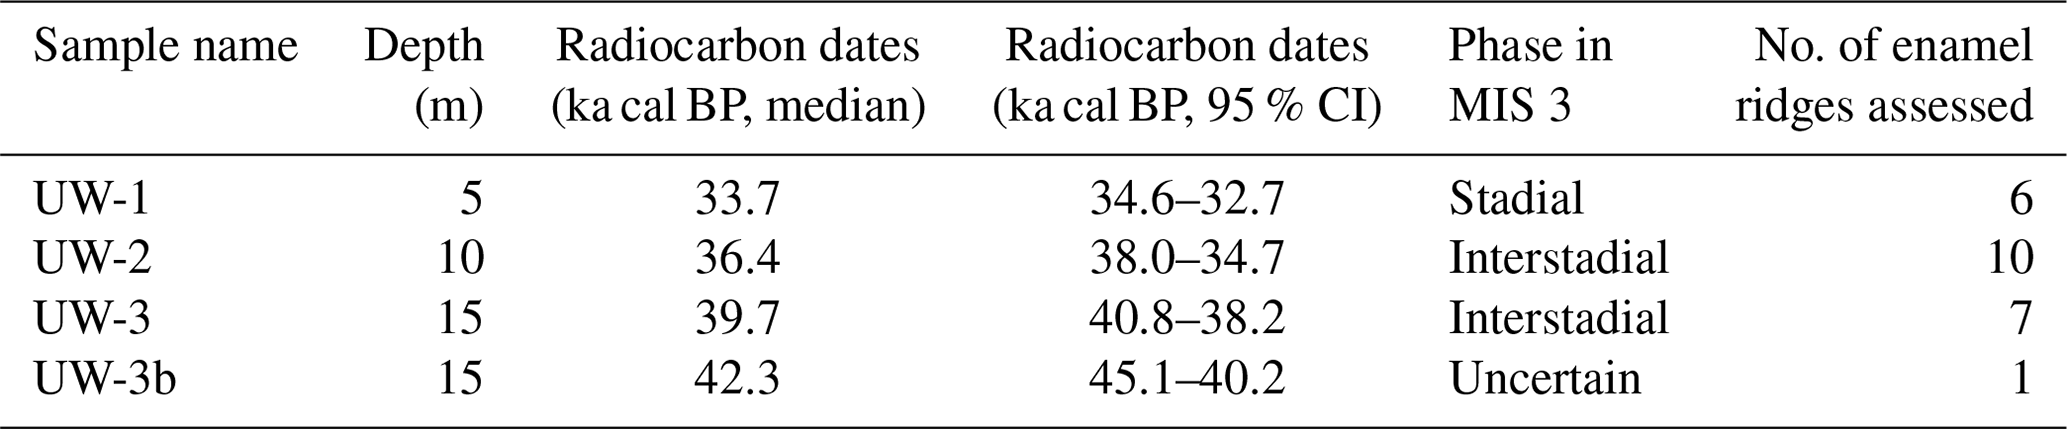
Three complete molar teeth (one M1 and two M3 molars) and one fragmentary molar of woolly mammoths (Mammuthus primigenius) were recovered from a gravel quarry called Hardtsee, which is located in Ubstadt-Weiher, Upper Rhine Graben, southwestern Germany (49.17694∘ N, 8.622163∘ E; Fig. 3). The quarry lake where the teeth were discovered is approximately 2 km east of the Rhine River, and gravel mining occurs underwater via dredging at controlled depths. The teeth were recovered from various depths between 5 and 15 m, and they stem from fluvial sediments that were predominantly transported to the Upper Rhine Graben by meltwater discharge from an upstream alpine glacier advance (Preusser et al., 2021). The enamel on the outermost surface was preserved with no indication of erosion, which suggests they were not likely transported over long distances. Therefore, we essentially interpret the Hardtsee location as the death location of the mammoths and the Rhine catchment as their primary water source. The teeth were radiocarbon dated, and the resulting ages fit into four different time windows during Marine Isotope Stage 3, approximately 43–34 ka cal BP (Table 1).
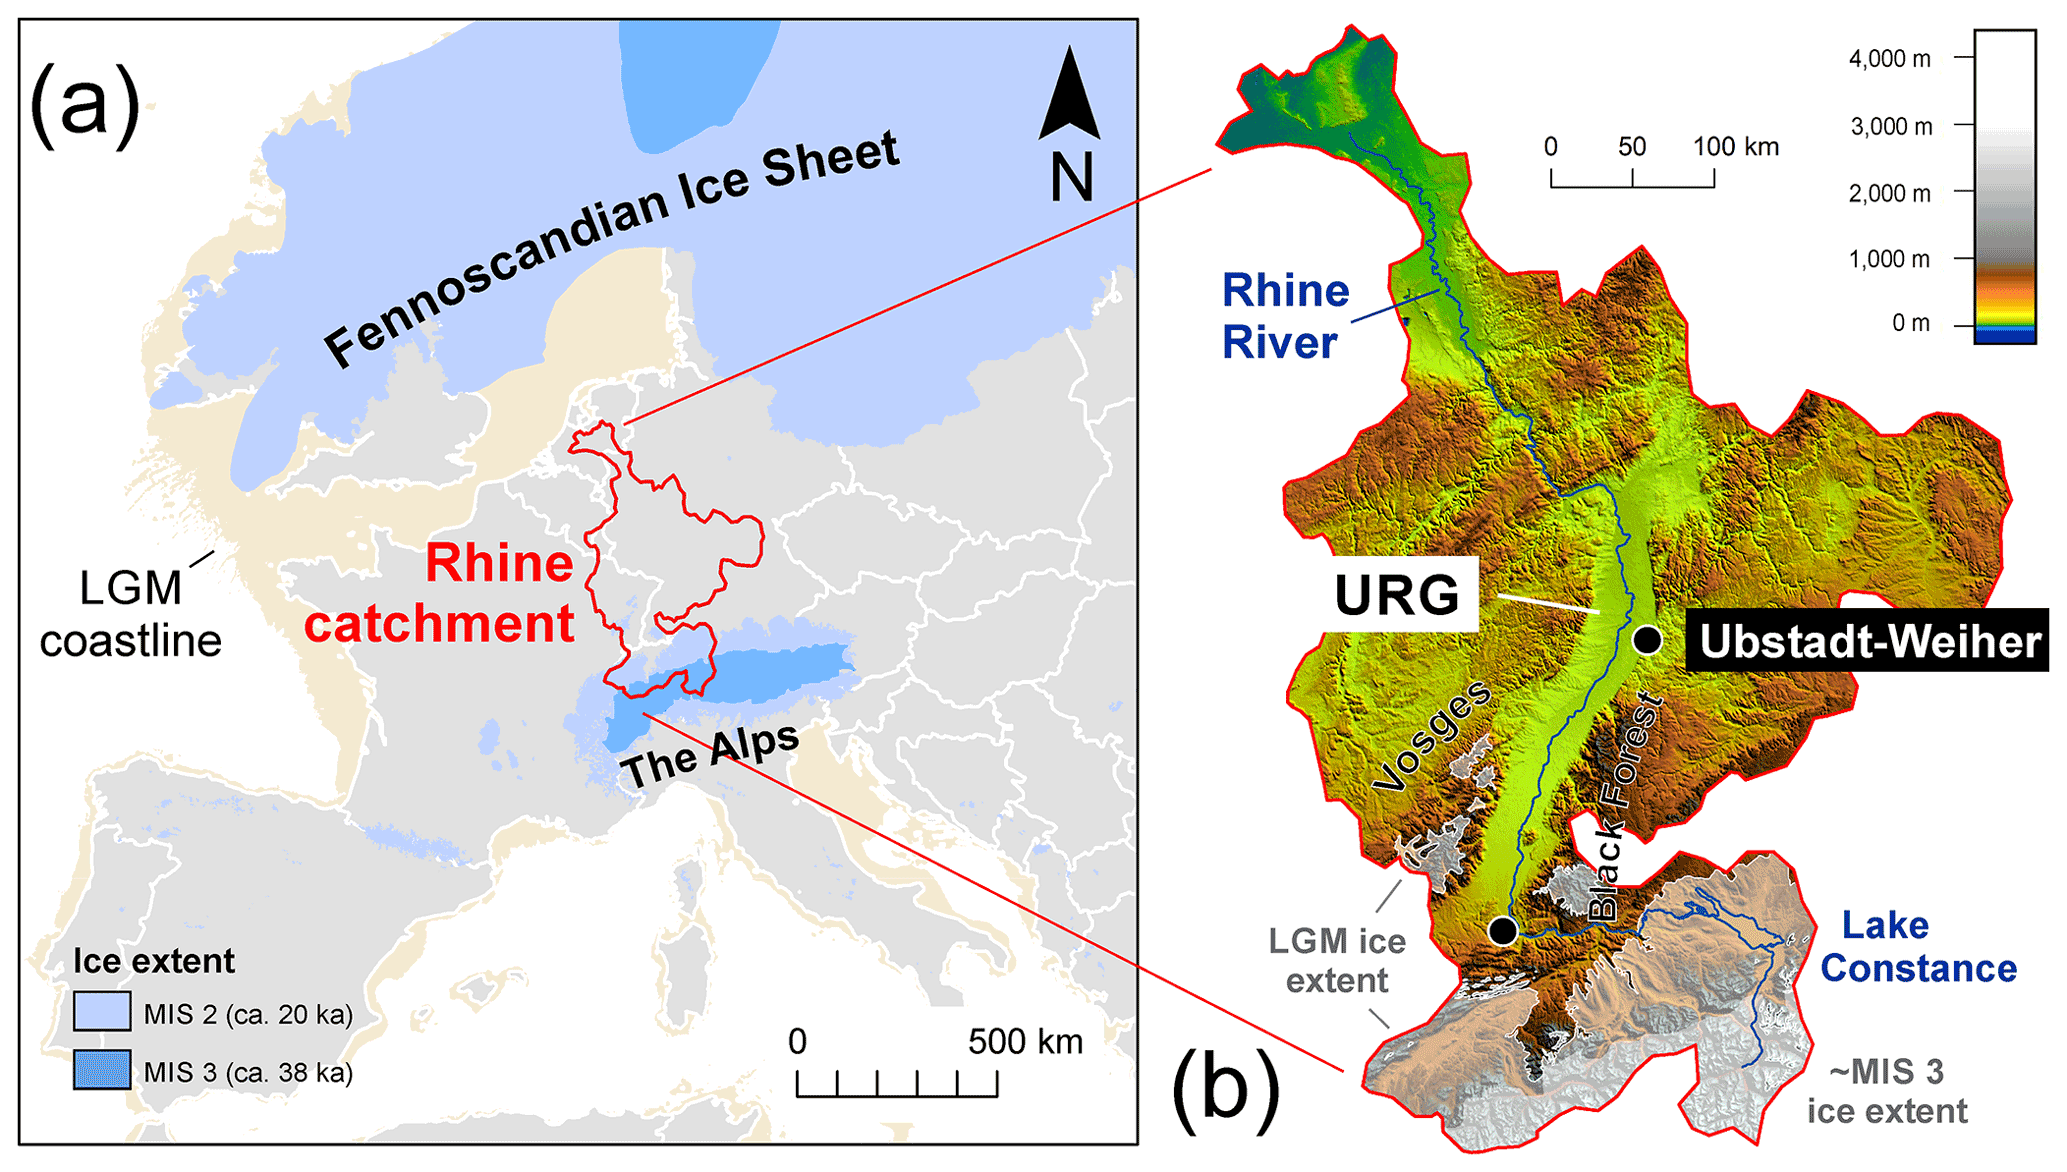
Figure 3(a) Geographic context of the Rhine catchment during MIS 3 and MIS 2 (Ehlers et al., 2011; Hughes et al., 2015; Seguinot et al., 2018). (b) Topographic map of the Rhine catchment highlighting of study location site at Ubstadt-Weiher at a resolution of 15 arcsec (Tozer et al., 2019).
Table 1Information on the mammoth teeth used in this study. Radiocarbon dating was undertaken at the Research School of Earth Science, Australian National University, and calibrated with Calib (http://calib.org/calib/calib.html, last access: 27 August 2020). Samples were dated to stadial/interstadial phases by comparing their ages with Greenland ice-core records (GISP2) (Grootes and Stuiver, 1999).
3.2 Analytical methods
A 1 mm cylindrical diamond-coated drill bit attached to a low speed hand drill and a state drill model were used to drill the enamel and collect its powder. Two sampling methods were applied. The first method was bulk drilling, which involves taking one sample from one enamel ridge by scraping down the entire enamel length, and only a thin layer (<1 mm) of powder was collected. The second method is sequential sampling. For this, we drilled each enamel ridge by taking successive samples along a horizontal line perpendicular to the tooth height at a resolution between 1.5 and 2 mm, starting from the occlusal surface and moving downward (Fig. 4). Both methods were applied to all available enamel ridges of the four samples. We first used the drill bit to remove the outermost surface of all enamel ridges, followed by sequentially sampling the enamel, and finally we took one bulk sample from each enamel ridge in the same trench as the sequential sampling. The mass of each sample was approximately 15 mg.
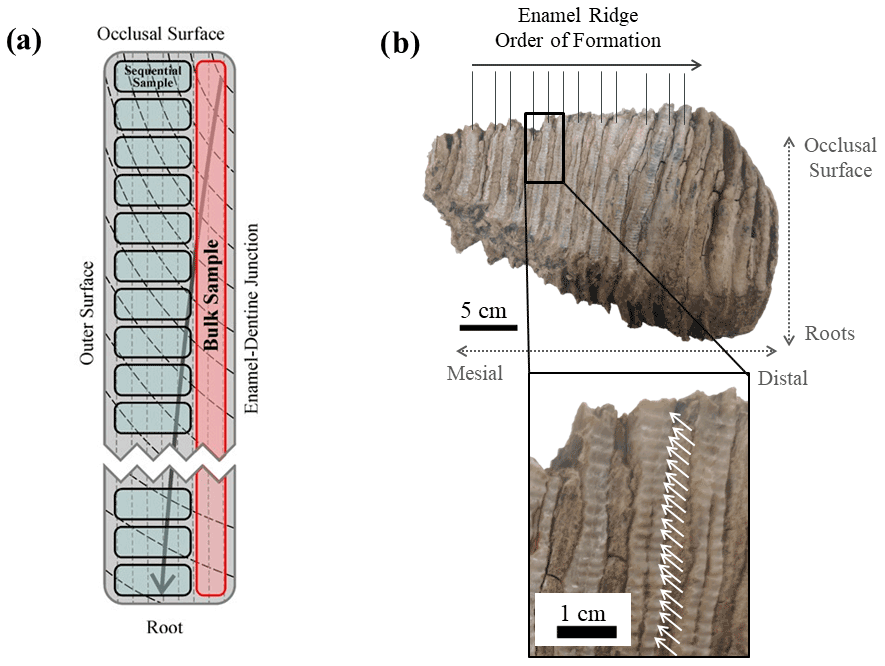
Figure 4(a) A schematic diagram of an enamel section showing the difference between bulk and sequential sampling methods. Vertical dashed lines represent primary incremental lines of enamel, and black curves represent secondary incremental lines of enamel, with the arrow indicating the growth direction. (b) Photograph of sampled tooth UW-2 as an illustration of the sequential sampling technique. White arrows highlight the drilling spots.
We then conducted chemical pretreatment, following the protocol developed by Snoeck and Pellegrini (2015), which involves soaking the samples in acetic acid (1 M, buffered with sodium acetate, pH =4.5) for 30 min and rinsing in distilled water before drying overnight at 40∘C. Pretreated samples were analyzed using an Analytical Precision AP2003 continuous-flow stable-isotope ratio mass spectrometer at the SGEAS, University of Melbourne. Containers were first placed on a hot plate set to 70 ∘C. Then they were purged with ultrapure helium gas, followed by injection of 0.5–1 mL of 104 % orthophosphoric acid with syringes. Samples were left to react with the acid for 30 min, and the headspace CO2 gas produced was introduced to the mass spectrometer for analysis. Results are presented in delta (δ) notation and in units of per mil (‰) in relation to the Vienna Pee Dee Belemnite (VPDB) standard. The AP2003 mass spectrometer analyzed both δ18O and δ13C values for each sample; however, our main focus is only the oxygen isotopic values in this study. Three inorganic standards, NEW1, NEW12, and NBS 18, were used to set the calibration scale. The analytical precision was approximately 0.12 ‰ for δ18O and 0.08 ‰ for δ13C, which was the standard deviation calculated based on the replicate analysis of in-house standards.
3.3 Statistical analysis
The similarity of bulk and mean sequential values was first assessed by their offset. If the offset is less than the analytical precision of the mass spectrometer (0.12 ‰), the two values are considered the same, and t tests were also performed to examine the statistical differences between the bulk and mean sequential values in each tooth.
In addition to offsets, we also used a “modified seasonal method” to analyze where the bulk value sits in relation to the range of values from the sequential samples. This method is based on the season of mollusk collection method from Prendergast et al. (2016), in which four seasons can be differentiated from the sequential records by generating quartiles in the range of δ18O values. However, in this study we applied this method not for reconstructing seasons; instead it is being adapted as a way of comparing the data distributions of bulk and sequential values. We differentiated the sequential δ18O values from each enamel ridge into four quartiles with equal data distributions. Based on the Late Pleistocene hydrological model we built in Fig. 2a and by reference to seasonal variations in δ18O values in the current Rhine River, we defined the lower quartile (<25th percentile) in the sequential results to reflect the warmest summer months when an increased amount of glacier meltwater was mixed in the river discharge; consequently, the upper quartile (>75th percentile) reflects the coldest winter months, and the middle quartiles (25–75th percentile) reflect intermediate environmental conditions during autumn or spring. Although this method can effectively analyze various paleoenvironmental aspects (e.g., seasonality and season of death) in the sequential records (Koch et al., 1989; Fisher and Fox, 2007; Prendergast and Schöne, 2017), it may be inappropriate for the comparison between bulk and sequential values due to two arguments. First, the bulk value is not from the same dataset as the sequential results, and consequently it has the possibility of falling outside the sequential data distribution. Also, the four seasons interpreted from the quartiles are based on the sequential δ18O values within 1 year of records. One enamel ridge of a mammoth tooth may hold several either complete or incomplete years of records. The median and quartile values may skew when an incomplete year was recorded. For instance, if the enamel ridge contains 2.5 years of records, there are unequal numbers of warming and cooling seasons, which may skew the data distribution to one direction.
To address the two issues, this seasonal method was further modified, and we decided to calculate a “relative percentile” of bulk values compared to sequential data distributions with the following equation:
In this equation, we defined the minimum and maximum sequential values along one enamel ridge to be between 0 % and 100 %, respectively, and this range was equally divided into 100 units. Within this range, we still divided the data into four quartiles. The bulk value is expected to fall within the middle quartiles, as the averaged signal over several years is unlikely to reflect environmental conditions during extreme summer or winter months.
4.1 Data distribution
In total, 24 bulk and 1114 sequential samples were drilled out of 24 enamel ridges. The results for each enamel ridge are summarized in Table 2 and plotted in Fig. 5. In the sequential results, we removed the outliers with boxplots. The data distributions of each tooth were box-plotted separately, and values that are smaller than the 25th percentile minus 1.5 interquartile ranges and greater than the 75th percentile plus 1.5 interquartile ranges were considered as outliers and removed (n=16). After removing outliers, the bulk δ18O values range from −10.4 ‰ to −7.6 ‰, and sequential values are between −11.3 ‰ and −5.7 ‰. Both the bulk and sequential values for all teeth are significantly different to each other based on t tests (p<0.05). The fragmentary molar UW-3b is excluded from bulk comparison since there is only one value.
Table 2The list of results of the study, including the length, number of identifiable years, and the bulk and sequential δ18O values of all sampled enamel ridges (outliers removed).
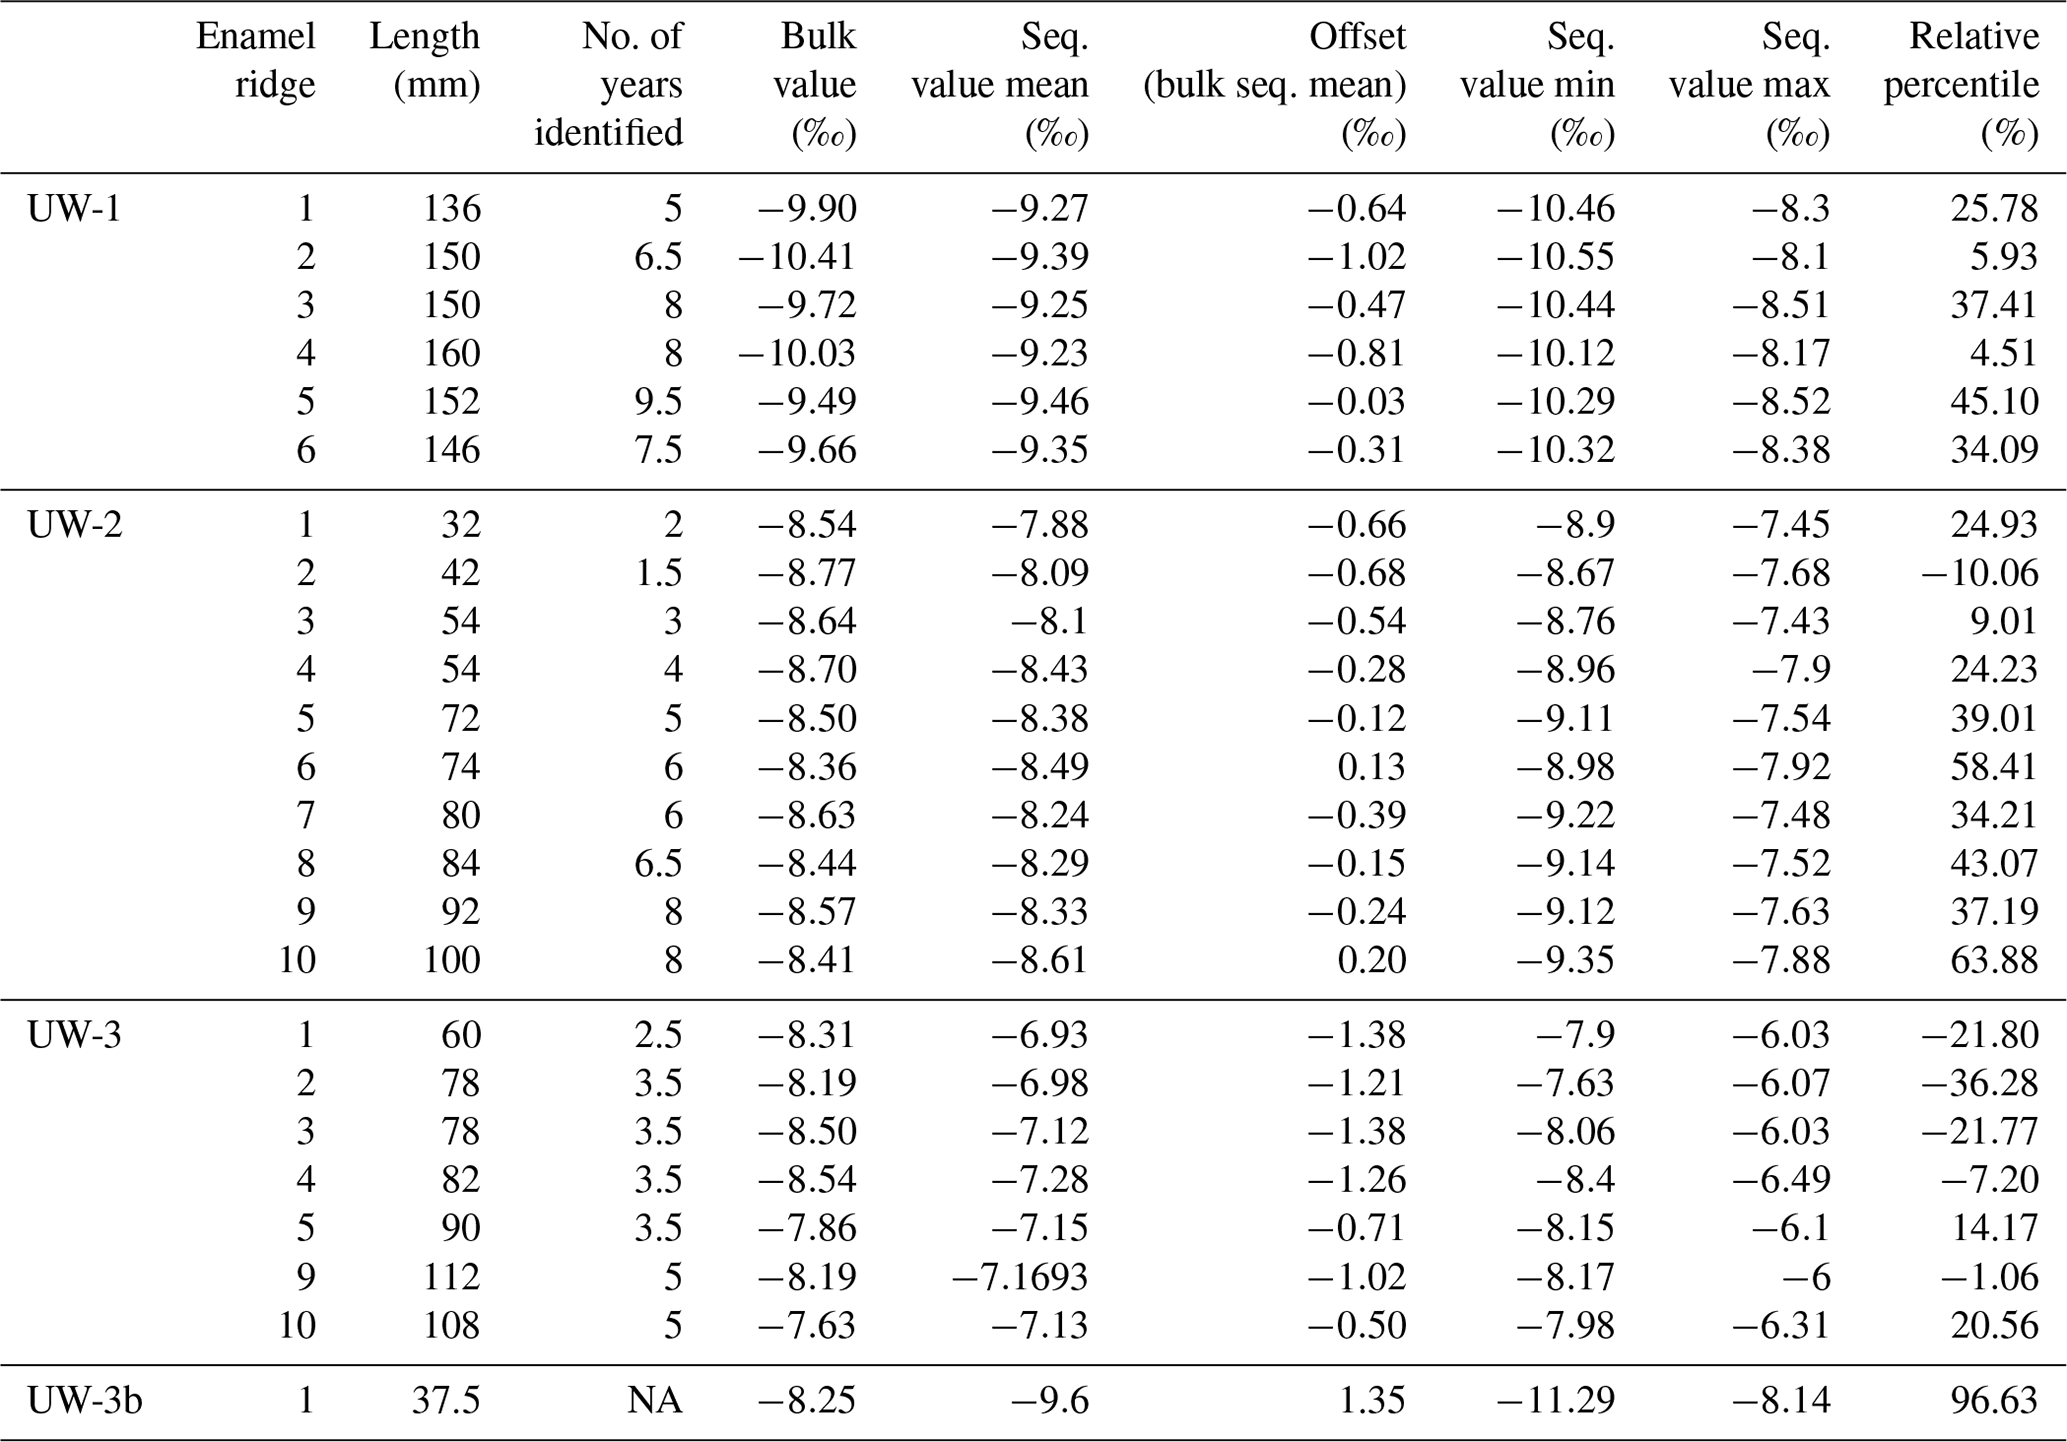
NA: not available.
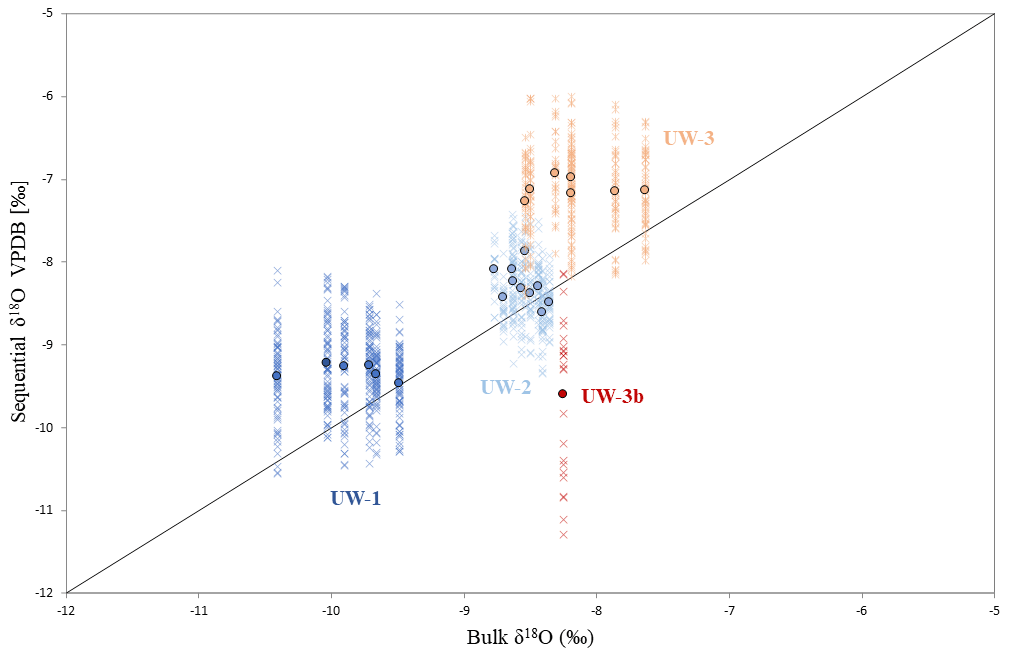
Figure 5Data distribution of the four teeth and comparison between bulk and sequential results. Each cross represents the δ18O value of one sequential spot, and dots are bulk (x axis) and averaged sequential (y axis) δ18O values of different enamel ridges. The diagonal line represents data points for which bulk and sequential means are equal; if a dot is located above this line, the mean sequential δ18O value of this enamel ridge is more positive than the bulk value, and vice versa.
For both bulk and average sequential values, more positive δ18O values were found in teeth UW-2 and UW-3, which are dated to interstadials, compared to tooth UW-1, which is dated to a stadial period (Fig. 4a). Tooth UW-1 is also the youngest sample; therefore, the three complete molar teeth show progressively more negative mean δ18O values from the oldest to the youngest between 39 and 33 ka cal BP. The bulk δ18O value of UW-3b is more positive than the younger UW-1 and UW-2, and it is intermediate to those of UW-3. The mean sequential δ18O value of UW-3b, however, is the most negative value among all four teeth.
4.2 Intra-enamel isotopic variations
The cyclicity of all enamel ridges was assessed to identify features of seasonal environmental changes. For UW-1, UW-2, and UW-3, the intra-tooth sequential δ18O exhibits multiple local maxima and minima along the entire ca. 100–150 mm of enamel length, and examples are plotted in Fig. 6. The data resemble cyclic oscillations, with the δ18O values of maxima being approximately 0.8 ‰ to 1.1 ‰ higher than those of the minima. Among these three teeth, the sequential values of UW-3 show the clearest oscillations, with five complete cycles of similar incremental lengths identified. In teeth UW-1 and UW-2, however, the cyclicity is more difficult to identify, as both selected enamel ridges have a reduced amplitude of isotopic variation in the middle of the enamel ridge. The enamel ridge of the fragmentary molar UW-3b has the most difficult isotopic variation to interpret. Although we can identify one maximum and minimum (and potentially a second maximum), it is uncertain whether these data cover a full year of records considering the incremental length is only 37.5 mm. The number of cycles in each enamel ridge ranges from one to eight, and they are correlated to the incremental length of enamel ridges (r2=0.60, n=23), with longer enamel ridges generally containing more interpreted hydrological years.

Figure 6Examples of δ18O variations along one enamel from each tooth with expected years. Local maxima (winter) and minima (summer) are highlighted with blue and orange dots, respectively.
4.3 Comparison of bulk and sequential values
Significant differences (p<0.05) were detected between bulk and mean sequential δ18O values in all complete teeth based on t tests (i.e., UW-1, UW-2, UW-3), with the difference varying from 0.03 ‰ to 1.35 ‰. One enamel ridge from UW-1 has a difference of less than 0.12 ‰. The differences of three enamel ridges from UW-2 are between 0.1 ‰ and 0.15 ‰. All other samples have differences greater than 0.2 ‰ (Table 2). Overall, the mean differences in the younger teeth UW-1 (0.54 ‰) and UW-2 (0.34 ‰) are smaller compared to the older UW-3 (1.06 ‰) and UW-3b (1.35 ‰). For all enamel ridges of teeth UW-1 and UW-3, the bulk values are more negative than the mean sequential values. The bulk values of most enamel ridges (8 out of 10) of UW-2 are more negative, and the other two are slightly more positive. The bulk value of UW-3b is 1.35 ‰ more positive than the sequential value, which is the greatest among all enamel ridges.
The relative percentile values were also analyzed and shown in Table 2 and Fig. 7. The bulk values of most enamel ridges of teeth UW-1 (4 out of 6) and UW-2 (6 out of 10) are located between the 25th and 75th percentiles within the middle quartile with the remaining values falling below the 25th percentile including one value for UW-2 being more negative than the minimal sequential value. The bulk values of all enamel ridges of tooth UW-3 are below the 25th percentile, with the majority (5 out if 7) being more negative than the minimal sequential value. The relative percentile of UW-3b is 96.3 %, the only data point above the 75th percentile.
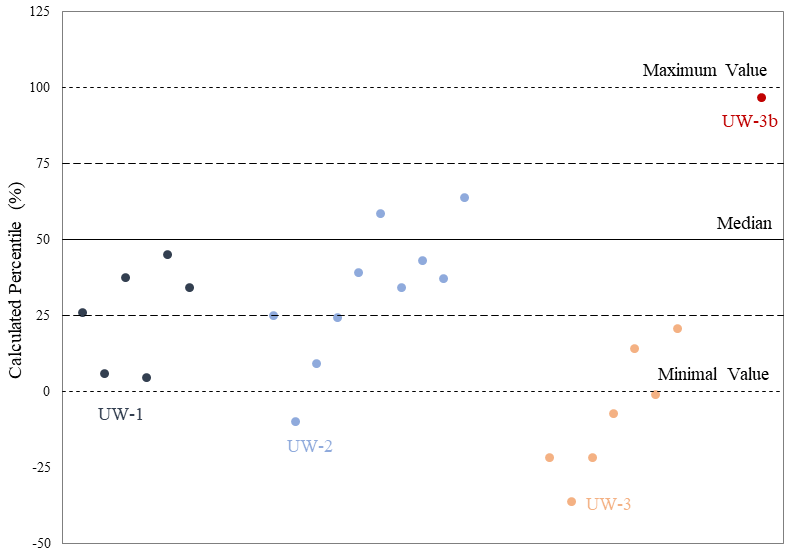
Figure 7The plot of relative percentiles of bulk values from all the enamel ridges of the four teeth.
5.1 Sample preservation
It is essential to evaluate whether physical and chemical transformations of sample materials may lead to isotopic exchange and loss of primary isotopic signal (Keenan, 2016; Goedert et al., 2016). The preservation condition of our mammoth teeth was assessed, and based on three pieces of evidence, at least part of their original materials seems to have been preserved. The first piece of evidence is the sequential δ18O values which show variations that mimic seasonal patterns. The δ18O values of all sequential samples would likely be homogenized if all material had been completely recrystallized (Metcalfe and Longstaffe, 2012; Goedert et al., 2016); therefore, this supports the point that at least some of the primary enamel material is preserved and still holds records of paleoenvironmental changes, but it is not a full proof. The carbon isotopic compositions, although not analyzed in detail in this study, provide additional evidence of primary material preservation. Carbon isotopes of herbivorous animals are incorporated from the vegetation they consumed (Arppe and Karhu, 2006; Kovács et al., 2012; Prendergast and Schöne, 2017), with the δ13C values of animals which forage upon C3 and C4 plants to be −20 ‰ to −8 ‰ and from 0 ‰ to +5 ‰, respectively (Kohn and Cerling, 2002). The δ13C values of the four teeth range between −13.13 ‰ and −11.21 ‰ (Liu, 2020), which falls within the C3 foraging range, and this agrees with mammoth dietary behavior observed from their fecal remains (Kirillova et al., 2016). Therefore, both oxygen and carbon isotopic results suggest that at least some primary isotopic signal is preserved. In addition, we drilled additional enamel powder from each tooth, and the powder was sub-divided into pretreated and non-pretreated groups. The isotopic values of both groups were tested, and no statistically significant differences were detected between the δ18O values of these two groups.
Although there is still a possibility of diagenetic alteration, all samples were pretreated with acetic acid to remove any secondary carbonates. Additionally, due to its low porosity and low organic contents, tooth enamel is one of the most resistant materials to diagenetic alteration and is capable of preserving primary isotopic signals for millions of years. Based on all the above considerations, we assume our mammoth teeth have at least partially preserved their original isotopic signals, and the acquired δ18O values reflect their living environmental properties.
5.2 Comparison between bulk and mean sequential values
Differences between bulk and sequential results are present in all four mammoth teeth, with the bulk values being generally more negative than the mean sequential values. There is only one exception, which is the enamel ridge of UW-3b, with the bulk value being 1.35 ‰ more positive. This may be caused by the absence of a complete annual cycle, as only 37.5 mm of material was sampled. The incomplete hydrological year in the records of UW-3b could also cause the data distribution of sequential samples to taper. Older tooth samples also have generally greater offsets. Only one enamel ridge from UW-1 has a difference less than 0.12 ‰, which is within the precision of the mass spectrometer. Therefore, the bulk and sequential values for this sample can be considered as equal. Three enamel ridges from UW-2 show slightly greater offsets between 0.12 ‰ and 0.15 ‰, which may still be considered as similar. Most other enamel ridges in teeth UW-1 and UW-2 (n=11) have offsets between 0.2 ‰ and 0.81 ‰, with only one enamel ridge from UW-1 having a difference value over 1 ‰. All enamel ridges from teeth UW-3 and UW-3b have difference values of at least 0.5 ‰, and most of them (6 out of 8) are greater than 1 ‰. The relative percentiles for all UW-3b enamel ridges are located in the lower quartile, while most enamel ridges from teeth UW-1 and UW-2 are within the middle quartile. However, even if some samples are located within the middle quartile, most of them in UW-2 and all samples in UW-1 are more negative than the median. The uneven distributions suggest that bulk and sequential samples reflect different environmental conditions in these two teeth.
One explanation for the difference is the geometry of incremental lines. Our two sampling methods each predominantly cover one growth direction: a bulk sample covering the entire enamel height with only a thin layer of enamel collected, whereas each sequential sample includes a deeper sampling pit covering the majority of the enamel thickness but with only a small proportion of the enamel height. Neither of the two methods followed the exact enamel growth direction: the incremental lines of mammoth secondary enamel material are inclined at an angle of 55–60∘ to the enamel-dentine junction (EDJ). The inconsistency between drilling orientation and enamel growth direction can cause “damping” of the isotopic signal due to time averaging (Passey et al., 2005; Metcalfe and Longstaffe, 2012). A simplified model is presented in Fig. 8 to illustrate how the angle of incremental lines can cause potential isotopic damping. In this model, although we assumed the four seasons in a year have the same incremental distance in a section of the enamel ridge, the seasonal distribution in the bulk sample is uneven with an incomplete representation of increments formed during the last summer and autumn. The sequential samples have the same issue, with the first autumn incompletely represented in our model. Therefore, this may result in bulk results more similar to the isotopic signals near the occlusal surface and mean sequential values more similar to those near the root. However, the seasonal distribution of the combination of all sequential samples is slightly more even as they occupy more enamel thickness (and much more enamel material overall). If only one method is applied and it covers the entire enamel thickness, then the obtained samples would theoretically have even distributions of the four seasons.

Figure 8A simplified model showing secondary incremental lines formed during different seasons and the sampling spots. (a) A schematic diagram of an enamel section with the assumption of the four seasons having equal incremental lengths, (b) sampling spots for both bulk and sequential sampling methods, and (c) the duration and distribution of different seasons included in each sample.
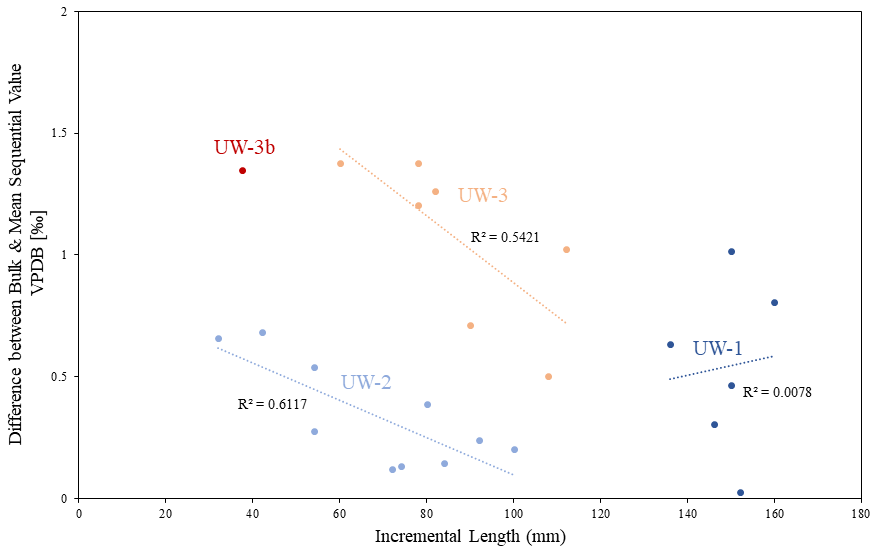
This problem may be more significant in enamel ridges of shorter lengths. In Fig. 9, we plotted the difference values against the incremental lengths of each enamel ridge. Teeth UW-2 and UW-3 have enamel ridges of different lengths, varying from 32 to 112 mm, and both of them show strong negative relationships between enamel length and difference value. No correlation was detected from the enamel ridges of UW-1. This could be due to their similar lengths (136–160 mm). Inter-tooth comparison also indicates that enamel ridges with longer lengths generally have smaller differences between bulk and mean sequential values: greater difference values (>1 ‰) predominantly occurred in enamel ridges less than 100 mm in length. When the bulk sample recorded uneven distributions of seasons, it mainly occurred at the apex and root of the enamel (Fig. 8); therefore, a longer enamel ridge with more annual records in the middle would theoretically reduce this impact. However, despite the correlation between the offsets and incremental lengths, the primary deciding factor of the offsets is still inter-tooth difference given that (1) the inter-tooth difference of values is greater than intra-tooth variations especially between UW-2 and UW-3 and (2) the offset values of UW-1 have a variation of nearly 1 ‰, although all of its enamel ridges are more than 100 mm.
The geometry of incremental lines may have another consequence, which is reduced seasonal amplitude in sequential isotopic records (Passey et al., 2005). In Fig. 8, one sequential sample may contain increments formed during more than one season, especially those formed during seasonal transitions. In fact, oxygen and carbon isotopic cyclicity has been detected from the EDJ to the outer surface, indicating that there was tooth growth through the enamel thickness, although the growth rate was much slower compared to the growth along tooth height. Therefore, each sequential sample obtained in this study may hold an averaged isotopic signal of one or multiple seasons, and the isotopic variation in environmental water would have potentially greater amplitude.
Another possible explanation for the difference between bulk and sequential results is that the two methods collect enamel formed during different times. Reade et al. (2015) sampled the tooth enamel of Barbary sheep (Ammotragus lervia) with both bulk and sequential sampling strategies. They also found different bulk and mean sequential δ18O values. The main difference between the two studies is that the locations of the two sampling methods are the opposite: their bulk samples were taken before the sequential samples and therefore are closer to the outer surface. They proposed an explanation, which is that the bulk samples in their study contain a greater proportion of enamel mineralized later because the enamel mineralization process at their sampling locations (outer surface) is slower than the sequential samples obtained near the EDJ (Suga, 1979, 1982). In our case, the bulk samples are then expected to contain more enamel mineralized earlier, and this argument agrees with the impact caused by the angle of incremental lines (Fig. 8). Therefore, there could be an offset in the formation time of the material collected by the two methods, and in turn this caused differences in isotopic compositions due to different time averaging in the samples.
A third explanation is the mixture of primary and secondary enamel increments in the samples. We primarily sampled the secondary incremental lines in the teeth. However, there was also a primary mineralization phase in mammoth tooth formation, although it only took up 20 %–30 % of the total enamel mass (Passey and Cerling, 2002; Passey et al., 2005). Primary mineralization forms vertical incremental lines under microscopic view, indicating the material grows from the EDJ to the outer surface (Metcalfe and Longstaffe, 2012). Therefore, the thin layer of enamel powder collected by the bulk sampling method may also contain primary mineralized material formed during a short period of time. This period of time could be during any season; consequently, if the collected primary increments were formed during extreme summer or winter months, the mixture of primary and secondary enamel material might skew the isotopic signal to one direction. This could be the cause of the bulk values of several enamel ridges falling outside the data distribution of sequential values, since primary increments were formed during a different time to the secondary increments. If the collected primary increments were formed during spring or autumn months with the isotopic signal in environmental water closer to the annual average, there is less impact from primary material, and the bulk and mean sequential values would be more similar. The sequential samples again are less influenced by the primary mineralization, as more enamel thickness is sampled, covering primary increments formed during a longer period of time and maybe including multiple seasons.
5.3 Comparison of sampling methods
The bulk and mean sequential results obtained in this study show both similar and different values. Here we discuss how these differences may help us decide the optimal sampling methods for future research. The bulk samples, at least those obtained through the method applied in this study, do not always reflect an averaged isotopic signal at decadal scales. Instead, it is more likely a reflection of either extreme summer/winter environmental conditions or spring/autumn isotopic compositions which are close to the annual mean value. In comparison, the sequential method is less influenced by the primary increments and the geometry of secondary incremental lines. We do not suggest the sequential sampling method itself can more accurately reflect paleoenvironmental conditions. The main reason it does in this study is that with our drilling method, the combination of all sequential samples covers the entire enamel length and the majority of enamel thickness, which included increments formed during a longer period of time than the thin layer of the bulk sample. Reade et al. (2015) suggested sampling the entire tooth height, as well as the enamel thickness, to reduce isotopic damping caused by the enamel growth pattern. We also recommend that future studies which involve surface sampling on mammoth teeth drill all available enamel material in both directions, regardless of which sampling method will be applied.
However, this means we can only apply one method to each enamel ridge. We suggest the sequential sampling method is more optimal because it provides not only an averaged multi-annual-scale isotopic composition (mean sequential value) but more importantly a time series of high-resolution paleoenvironmental records. Such records are crucial for understanding the highly variable climatic conditions of the Late Pleistocene and deciphering human–environmental interactions (Denton et al., 2005; Bradtmöller et al., 2012; Prendergast et al., 2018). In addition, the sequential δ18O variations that reflect seasonal environmental changes can also indicate whether there is a complete annual cycle, and if so, how many of them are recorded in each enamel ridge. A fragmentary enamel ridge without one annual cycle may not provide an accurate annual mean δ18O value, so the temporal duration of the record is unsuitable for the bulk sampling method. This also indicates that the completeness and size of mammoth teeth should be important criteria considered during sample selection. Mammoth teeth with complete and long enamel ridges should have the highest priority because long enamel ridges generally contain more annual cycles of δ18O oscillations. Although offsets between bulk and mean sequential values may still be detected in long ridges, the difference value is likely smaller than those of short enamel ridges, as the long sequence of isotopic records reduces the impact of uneven seasonal distributions in both bulk and sequential samples.
Although we recommend using complete and large-sized mammoth molar teeth as the preferred study material, we are aware that such samples are not always available at certain sites. Mammoth teeth may have been weathered and transported by surrounding environments, and consequently they may break into fragments and lose enamel thickness through erosion. Due to this limitation, it is unclear which part of the enamel and how much enamel thickness and tooth height were sampled in many past stable-isotope studies on mammoth teeth, especially those which employed bulk sampling methods. Given that the bulk values in some of our samples fall outside the range of sequential values, we recommend only comparing results obtained from sequential sampling methods with other sequential sampling studies. If results obtained from two different methods are compared directly, the potential isotopic offset between bulk and sequential samples may be falsely concluded to reflect different environmental conditions.
5.4 Limitations and future research
The main limitation of this study is the different locations of the two sampling methods. Although the sampling spots are from the same trenches, bulk and sequential samples are powder from different parts of the enamel ridge. A possible improvement in further studies is to use only part of the powder in each sequential sample and combine all the remaining powder along one enamel ridge to form the bulk sample. In this case, enamel powder taken from the two methods would have covered roughly the same incremental length of enamel thickness and tooth height. Another possible improvement is applying the two methods on the enamel ridges at two sides of the same molar plate. However, this method assumes that enamel ridges on both sides grow simultaneously. Nonetheless, this study has provided insights into the degree to which we can compare past studies, as it is likely that different parts of enamel ridges were sampled in different studies, and some studies might have only sampled a thin layer of enamel material as the bulk samples.
Another limitation is that we considered primary enamel mineralization as a factor that caused differences in bulk and sequential results, but we are uncertain about the proportion of primary mineralization collected in each sample and its degree of impact. These questions require further investigations into mammoth dental morphology and separate isotopic analysis of primary and secondary incremental materials.
In addition, although the sequential samples provide high-resolution records of likely seasonal environmental changes, they are not perfect reflections of paleoenvironments. The geometry of secondary incremental lines potentially caused several different seasons recorded in one sequential sample, averaging the isotopic signal and in turn reducing the amplitude of isotopic oscillations. In future sequential sampling of mammoth teeth, we may section the teeth to expose the enamel thickness, identify incremental features under microscopic views so that we can perform spot-drilling on each incremental line to avoid seasonal averaging.
We applied both bulk and sequential sampling methods to mammoth enamel and compared the results. Both similar and different δ18O values between bulk and mean sequential results were discovered, and in most samples, they are different, with the bulk samples having more negative δ18O values. Multiple potential factors might have jointly caused the offsets, including the geometry of secondary incremental lines, the mixture of primary increments, and different periods of time formation near the EDJ and outer surface. In this study, the mean sequential values may be more accurate reflections of decadal-scale paleoenvironmental conditions because their samples include most material in both tooth height and enamel thickness direction. A thin layer of enamel material collected by the bulk sampling method may have uneven distributions of different seasons, and consequently the δ18O values may reflect either an annual average or conditions in only a certain season. Choosing long enamel ridges that contain more annual cycles as study materials may reduce the impact of uneven seasonal distribution caused by incremental line geometry. Therefore, we recommend that future isotopic analysis on mammoth teeth selects complete and large-sized samples and drills the entire tooth height and enamel thickness if possible. Considering that the sampling locations are unknown in many past studies, a cross-method data comparison is not recommended.
We also effectively obtained high-resolution paleoenvironmental records of sub-seasonal resolution. These records hold the potential of reconstructing paleo-climate and paleo-hydrology for various aspects, such as seasonality and inter-annual differences, in future studies. However, we must be aware that the amplitude of isotopic signal obtained from this sequential sampling method might be reduced, since the drilling direction has an angle against the incremental lines so that enamel materials formed during more than one season could be mixed in each sample. This issue may be improved by combining the sequential sampling method with microscopic analysis on mammoth dental morphology to achieve spot-drilling on each incremental line in future research.
The data that support the findings of this study will be uploaded to the PANGAEA database and be open to other researchers in the near future.
The research idea was conceived by JHM and AP; sample acquisition was carried out by JHM; experiment planning was carried out by ZL, AP, and JHM; laboratory work was carried out by ZL; isotopic data processing was carried out by RD; data analysis and interpretation were carried out by ZL, AP, and JHM; ZL drafted the manuscript. All co-authors reviewed and made inputs to the manuscript.
At least one of the (co-)authors is a member of the editorial board of E&G Quaternary Science Journal. The peer-review process was guided by an independent editor, and the authors also have no other competing interests to declare.
Publisher's note: Copernicus Publications remains neutral with regard to jurisdictional claims in published maps and institutional affiliations.
This article is part of the special issue “Quaternary research from and inspired by the first virtual DEUQUA conference”. It is a result of the vDEUQUA2021 online conference in September/October 2021.
We would like to thank Frank Kiesewetter from the Ubstadt-Weiher gravel quarry for collecting and providing the mammoth teeth for this research, and we thank Rachel Wood from Australian National University for undertaking the radiocarbon dating of the samples. We are also grateful for Niels de Winter and another anonymous reviewer for providing valuable feedback.
This paper was edited by Christian Zeeden and reviewed by Niels de Winter and one anonymous referee.
Arppe, L. M. and Karhu, J. A.: Implications for the Late Pleistocene climate in Finland and adjacent areas from the isotopic composition of mammoth skeletal remains, Palaeogeogr. Palaeocl., 231, 322–330, https://doi.org/10.1016/j.palaeo.2005.08.007, 2006.
Ayliffe, L. K., Lister, A. M., and Chivas, A. R.: The preservation of glacial-interglacial climatic signatures in the oxygen isotopes of elephant skeletal phosphate, Palaeogeogr. Palaeocl., 99, 179–191, https://doi.org/10.1016/0031-0182(92)90014-V, 1992.
Bedaso, Z. and Wu, S.-Y.: Linking precipitation and groundwater isotopes in Ethiopia – Implications from local meteoric water lines and isoscapes, J. Hydrol., 596, 126074, https://doi.org/10.1016/j.jhydrol.2021.126074, 2021.
Benson, L. V. and Paillet, F.: HIBAL: A hydrologic-isotopic-balance model for application to paleolake systems, Quaternary Sci. Rev., 21, 1521–1539, https://doi.org/10.1016/S0277-3791(01)00094-4, 2002.
Bradtmöller, M., Pastoors, A., Weninger, B., and Weniger, G.-C.: The repeated replacement model – Rapid climate change and population dynamics in Late Pleistocene Europe, Quatern. Int., 247, 38–49, https://doi.org/10.1016/j.quaint.2010.10.015, 2012.
Dansgaard, W.: Stable isotopes in precipitation, Tellus, 16, 436–468, https://doi.org/10.3402/tellusa.v16i4.8993, 1964.
Denton, G., Alley, R., Comer, G., and Broecker, W.: The role of seasonality in abrupt climate change, Quaternary Sci. Rev., 24, 1159–1182, https://doi.org/10.1016/j.quascirev.2004.12.002, 2005.
Ehlers, J., Gibbard, P. L., and Hughes, P. D. (Eds): Quaternary Glaciations – Extent and Chronology: A Closer Look, Elsevier, ISBN: 9780444534477, 2011.
Ferretti, M. P.: Structure and evolution of mammoth molar enamel, Acta Palaeontol. Pol., 48, 383–396, 2003.
Fisher, D. C. and Fox, D. L.: Season of death of the Dent mammoths distinguishing single from multiple mortality events, in: Frontiers in Colorado Paleoindian Archaeology: From the Dent Site to the Rocky Mountains, University Press of Colorado, 123–153, ISBN: 9781607323549, 2007.
Fricke, H. C. and O'Neil, J. R.: Inter- and intra-tooth variation in the oxygen isotope composition of mammalian tooth enamel phosphate: implications for palaeoclimatological and palaeobiological research, Palaeogeogr. Palaeocl., 126, 91–99, https://doi.org/10.1016/S0031-0182(96)00072-7, 1996.
Genoni, L., Iacumin, P., Nikolaev, V., Gribchenko, Yu., and Longinelli, A.: Oxygen isotope measurements of mammoth and reindeer skeletal remains: an archive of Late Pleistocene environmental conditions in Eurasian Arctic, Earth Planet. Sc. Lett., 160, 587–592, https://doi.org/10.1016/S0012-821X(98)00113-7, 1998.
Goedert, J., Amiot, R., Boudad, L., Buffetaut, E., Fourel, F., Godefroit, P., Kusuhashi, N., Suteethorn, V., Tong, H., Watabe, M., and Lécuyer, C.: Preliminary investigation of seasonal patterns recorded in the oxygen isotope compositions of theropod dinosaur tooth enamel, PALAIOS, 31, 10–19, https://doi.org/10.2110/palo.2015.018, 2016.
Grootes, P. M. and Stuiver, M.: GISP2 Oxygen Isotope Data, PANGAEA [dataset], https://doi.org/10.1594/PANGAEA.56094, 1999.
Hoppe, K. A.: Late Pleistocene mammoth herd structure, migration patterns, and Clovis hunting strategies inferred from isotopic analyses of multiple death assemblages, Paleobiology, 30, 129–145, https://doi.org/10.1666/0094-8373(2004)030<0129:LPMHSM>2.0.CO;2, 2004.
Hughes, A. L., Gyllencreutz, R., Lohne, Ø. S., Mangerud, J., and Svendsen, J. I.: DATED-1: compilation of dates and time-slice reconstruction of the build-up and retreat of the last Eurasian (British-Irish, Scandinavian, Svalbard-Barents-Kara Seas) Ice Sheets 40-10 ka, PANGAEA [dataset], https://doi.org/10.1594/PANGAEA.848117, 2015.
Iacumin, P., Di Matteo, A., Nikolaev, V., and Kuznetsova, T. V.: Climate information from C, N and O stable isotope analyses of mammoth bones from northern Siberia, Quatern. Int., 212, 206–212, https://doi.org/10.1016/j.quaint.2009.10.009, 2010.
Keenan, S. W.: From bone to fossil: A review of the diagenesis of bioapatite, Am. Mineral., 101, 1943–1951, https://doi.org/10.2138/am-2016-5737, 2016.
Kirillova, I. V., Argant, J., Lapteva, E. G., Korona, O. M., van der Plicht, J., Zinovyev, E. V., Kotov, A. A., Chernova, O. F., Fadeeva, E. O., Baturina, O. A., Kabilov, M. R., Shidlovskiy, F. K., and Zanina, O. G.: The diet and environment of mammoths in North-East Russia reconstructed from the contents of their feces, Quatern. Int., 406, 147–161, https://doi.org/10.1016/j.quaint.2015.11.002, 2016.
Koch, P. L., Fisher, D. C., and Dettman, D.: Oxygen isotope variation in the tusks of extinct proboscideans: A measure of season of death and seasonality, Geology, 17, 515–519, https://doi.org/10.1130/0091-7613(1989)017<0515:OIVITT>2.3.CO;2, 1989.
Kohn, M. J. and Cerling, T. E.: Stable Isotope Compositions of Biological Apatite, Rev. Mineral. Geochem., 48, 455–488, https://doi.org/10.2138/rmg.2002.48.12, 2002.
Kovács, J., Moravcová, M., Újvári, G., and Pintér, A. G.: Reconstructing the paleoenvironment of East Central Europe in the Late Pleistocene using the oxygen and carbon isotopic signal of tooth in large mammal remains, Quatern. Int., 276–277, 145–154, https://doi.org/10.1016/j.quaint.2012.04.009, 2012.
Lister, A. and Bahn, P.: Mammoths: Giants of the Ice Age Hardcover – 15 November 2007, University of California Press, ISBN: 0520253191, 2007.
Liu, Z.: Reconstruction of Paleo-Environments in Southern Germany during the Last Glacial Maximum with Mammoth Teeth, Honors thesis, School of Geography, Earth and Atmospheric Sciences, University of Melbourne, Australia, https://doi.org/10.13140/RG.2.2.32020.63361, 147 pp., 2020.
Longinelli, A.: Oxygen isotopes in mammal bone phosphate: A new tool for paleohydrological and paleoclimatological research?, Geochim. Cosmochim. Ac., 48, 385–390, https://doi.org/10.1016/0016-7037(84)90259-X, 1984.
Luz, B., Kolodny, Y., and Horowitz, M.: Fractionation of oxygen isotopes between mammalian bone-phosphate and environmental drinking water, Geochim. Cosmochim. Ac., 48, 1689–1693, https://doi.org/10.1016/0016-7037(84)90338-7, 1984.
Maschenko, E. N.: Individual development, biology and evolution of the woolly mammoth, Cranium, 19, 4–120, 2002.
Metcalfe, J. Z. and Longstaffe, F. J.: Mammoth tooth enamel growth rates inferred from stable isotope analysis and histology, Quaternary Res., 77, 424–432, https://doi.org/10.1016/j.yqres.2012.02.002, 2012.
Miller, J. H., Fisher, D. C., Crowley, B. E., Secord, R., and Konomi, B. A.: Male mastodon landscape use changed with maturation (late Pleistocene, North America), P. Natl. Acad. Sci. USA, 119, e2118329119, https://doi.org/10.1073/pnas.2118329119, 2022.
Passey, B. H. and Cerling, T. E.: Tooth enamel mineralization in ungulates: Implications for recovering a primary isotopic time-series, Geochim. Cosmochim. Ac., 66, 3225–3234, https://doi.org/10.1016/S0016-7037(02)00933-X, 2002.
Passey, B. H., Cerling, T. E., Schuster, G. T., Robinson, T. F., Roeder, B. L., and Krueger, S. K.: Inverse methods for estimating primary input signals from time-averaged isotope profiles, Geochim. Cosmochim. Ac., 69, 4101–4116, https://doi.org/10.1016/j.gca.2004.12.002, 2005.
Prendergast, A. L. and Schöne, B. R.: Oxygen isotopes from limpet shells: Implications for palaeothermometry and seasonal shellfish foraging studies in the Mediterranean, Palaeogeogr. Palaeocl., 484, 33–47, https://doi.org/10.1016/j.palaeo.2017.03.007, 2017.
Prendergast, A. L., Stevens, R. E., O’Connell, T. C., Fadlalak, A., Touati, M., al-Mzeine, A., Schöne, B. R., Hunt, C. O., and Barker, G.: Changing patterns of eastern Mediterranean shellfish exploitation in the Late Glacial and Early Holocene: Oxygen isotope evidence from gastropod in Epipaleolithic to Neolithic human occupation layers at the Haua Fteah cave, Libya, Quatern. Int., 407, 80–93, https://doi.org/10.1016/j.quaint.2015.09.035, 2016.
Prendergast, A. L., Pryor, A. J. E., Reade, H., and Stevens, R. E.: Seasonal records of palaeoenvironmental change and resource use from archaeological assemblages, J. Archaeol. Sci. Rep., 21, 1191–1197, https://doi.org/10.1016/j.jasrep.2018.08.006, 2018.
Preusser, F., Büschelberger, M., Kemna, H. A., Miocic, J., Mueller, D., and May, J.-H.: Exploring possible links between Quaternary aggradation in the Upper Rhine Graben and the glaciation history of northern Switzerland, Int. J. Earth Sci., 110, 1827–1846, https://doi.org/10.1007/s00531-021-02043-7, 2021.
Pryor, A. J. E., O'Connell, T. C., Wojtal, P., Krzemińska, A., and Stevens, R. E.: Investigating climate at the Upper Palaeolithic site of Kraków Spadzista Street (B), Poland, using oxygen isotopes, Quatern. Int., 294, 108–119, https://doi.org/10.1016/j.quaint.2011.09.027, 2013.
Reade, H., Stevens, R. E., Barker, G., and O'Connell, T. C.: Tooth enamel sampling strategies for stable isotope analysis: Potential problems in cross-method data comparisons, Chem. Geol., 404, 126–135, https://doi.org/10.1016/j.chemgeo.2015.03.026, 2015.
Rozanski, K., Froehlich, K., and Mook, W. G.: Environmental isotopes in the hydrological cycle: principles and applications, IHP-V, Technical Documents in Hydrology, No. 39, vol. III: Surface water, UNESCO, Paris, 2001.
Seguinot, J., Ivy-Ochs, S., Jouvet, G., Huss, M., Funk, M., and Preusser, F.: Modelling last glacial cycle ice dynamics in the Alps, The Cryosphere, 12, 3265–3285, https://doi.org/10.5194/tc-12-3265-2018, 2018.
Sharp, Z. D. and Cerling, T. E.: Fossil isotope records of seasonal climate and ecology: Straight from the horse's mouth, Geology, 26, 219–222, https://doi.org/10.1130/0091-7613(1998)026<0219:FIROSC>2.3.CO;2, 1998.
Smith, C. E.: Cellular and Chemical Events During Enamel Maturation, Crit. Rev. Oral Biol. M., 9, 128–161, https://doi.org/10.1177/10454411980090020101, 1998.
Smith, T. M. and Tafforeau, P.: New visions of dental tissue research: tooth development, chemistry, and structure, Evol. Anthropol., 17, 213–226, https://doi.org/10.1002/evan.20176, 2008.
Snoeck, C. and Pellegrini, M.: Comparing bioapatite carbonate pre-treatments for isotopic measurements: Part 1–Impact on structure and chemical composition, Chem. Geol., 417, 394–403, https://doi.org/10.1016/j.chemgeo.2015.10.004, 2015.
Suga, S.: Comparative Histology of Progressive Mineralization Pattern of Developing Incisor Enamel of Rodents, J. Dent. Res., 58, 1025–1026, https://doi.org/10.1177/002203457905800214011, 1979.
Suga, S.: Progressive mineralization pattern of developing enamel during the maturation stage, J. Dent. Res., 61, 1532–1542, 1982.
Theakstone, W. H.: Oxygen isotopes in glacier-river water, Austre Okstindbreen, Okstindan, Norway, J. Glaciol., 49, 282–298, https://doi.org/10.3189/172756503781830700, 2003.
Tozer, B., Sandwell, D. T., Smith, W. H. F., Olson, C., Beale, R., and Wessel, P.: Global Bathymetry and Topography at 15 Arc Sec: SRTM15+, OpenTopography [data set], https://doi.org/10.5069/G92R3PT9, 2019.
Tütken, T., Furrer, H., and Vennemann, T. W.: Stable isotope compositions of mammoth teeth from Niederweningen, Switzerland: Implications for the Late Pleistocene climate, environment, and diet, Quatern. Int., 164–165, 139–150, https://doi.org/10.1016/j.quaint.2006.09.004, 2007.
Ukkonen, P., Arppe, L., Houmark-Nielsen, M., Kjær, K. H., and Karhu, J. A.: MIS 3 mammoth remains from Sweden–implications for faunal history, palaeoclimate and glaciation chronology, Quaternary Sci. Rev., 26, 3081–3098, https://doi.org/10.1016/j.quascirev.2007.06.021, 2007.
Widga, C., Hodgins, G., Kolis, K., Lengyel, S., Saunders, J., Walker, J. D., and Wanamaker, A. D.: Life histories and niche dynamics in late Quaternary proboscideans from midwestern North America, Quaternary Res., 100, 224–239, https://doi.org/10.1017/qua.2020.85, 2021.
Wooller, M. J., Bataille, C., Druckenmiller, P., Erickson, G. M., Groves, P., Haubenstock, N., Howe, T., Irrgeher, J., Mann, D., Moon, K., Potter, B. A., Prohaska, T., Rasic, J., Reuther, J., Shapiro, B., Spaleta, K. J., and Willis, A. D.: Lifetime mobility of an Arctic woolly mammoth, Science, 373, 806–808, https://doi.org/10.1126/science.abg1134, 2021.
Yeh, H.-F. and Lee, J.-W.: Stable Hydrogen and Oxygen Isotopes for Groundwater Sources of Penghu Islands, Taiwan, Geosciences, 8, 84, https://doi.org/10.3390/geosciences8030084, 2018.