the Creative Commons Attribution 4.0 License.
the Creative Commons Attribution 4.0 License.
 | 08 Oct 2024
Millennial-scale erosion rates in the Harz Mountains (Germany) from cosmogenic 10Be: implications for landscape evolution of basement highs in Central Europe
Ralf Hetzel
Henrik Rother
Reinhard Wolff
Kyra Hölzer
Hetzel, R., Rother, H., Wolff, R., and Hölzer, K.: Millennial-scale erosion rates in the Harz Mountains (Germany) from cosmogenic 10Be: implications for landscape evolution of basement highs in Central Europe, E&G Quaternary Sci. J., 73, 161–178, https://doi.org/10.5194/egqsj-73-161-2024, 2024.
Understanding how landscapes evolve under changing tectonic and climatic boundary conditions requires the quantification of erosion rates on different temporal and spatial scales. Here we present results of local and catchment-wide erosion rates derived from in situ-produced cosmogenic 10Be for the Harz Mountains – a typical basement high in Central Europe that was uplifted by reverse faulting during the Late Cretaceous inversion of the Central European Basin. The summit region of the Harz (Brocken peak at 1141 m a.s.l.) is formed by Permian granite and surrounded by an Oligocene low-relief surface that was carved into Palaeozoic metasediments. This planation surface lies at an elevation of 500–700 m a.s.l. and stands ∼ 300 m above the lowlands surrounding the Harz Mountains. Our 10Be erosion rates, derived for granitic catchments with a size of 0.3–24 km2, are slope-dependent and range from 24 ± 2 to 55 ± 3 mm kyr−1. We find that catchments situated within the low-relief surface with mean slope angles < 10° erode at rates of 24–30 mm kyr−1, whereas catchments characterized by larger portions with steeper slopes (i.e. 20 to 35°) upstream and downstream of the low-relief surface erode at higher rates of 30–55 mm kyr−1. Local bedrock outcrops on the planation surface erode at lower rates of around ∼ 20 mm kyr−1. Taken together, our 10Be data document and quantify the slope-dependent erosion of the Harz topography at a rate of a few tens of metres per million years and the denudation and lowering of the Tertiary Harz planation surface and its progressive incision by rivers. The observed difference between (higher) rates of erosion affecting soil-covered surfaces compared to the (lower) rates of erosion on exposed bedrock surfaces suggests that the topographic relief within the Harz is still growing at a mean rate of approximately 5–10 mm kyr−1. Considering our data in the context of the existing but contradictory conceptual models on the evolution of the Harz topography, we suggest that the post-Oligocene elevation difference of ∼ 300 m between the planation surface and the lowlands around the Harz is the result of three different processes: first, mountain uplift due to a potential reactivation of the range-bounding reverse fault during the Neogene and Quaternary until ∼ 0.5 Ma; second, moderate erosion of weak sedimentary rocks in the regions surrounding the Harz Mountains; and third, localized lowering of areas in the vicinity of the Harz by dissolution and lateral migration of Permian salt at depth. Finally, we note that active reverse faulting along the northern boundary of the Harz Mountains is not compatible with the available geological, geophysical, and geodetic data.
Ein Verständnis, wie sich Landschaften unter verändernden tektonischen und klimatischen Randbedingungen entwickeln, erfordert die Quantifizierung von Erosionsraten auf unterschiedlichen zeitlichen und räumlichen Skalen. Hier präsentieren wir 10Be-basierte Erosionsraten für den Harz – ein typisches Mittelgebirge in Zentraleuropa, das während der spätkretazischen Inversion des Mitteleuropäischen Beckens durch Aufschiebungstektonik herausgehoben wurde. Der höchste Teil des Harzes (Brocken 1141 m NHN) besteht aus einem permischen Granit und ist von einer oligozänen Rumpffläche mit geringem Relief umgeben, die in paläozoische Metasedimente erodiert wurde. Diese Fläche liegt in einer Höhe von 500–700 m NHN und ca. 300 m über dem Tiefland rund um den Harz. Unsere 10Be-Erosionsraten für granitische Einzugsgebiete mit einer Größe von 0.3–24 km2 sind abhängig von der Hangneigung und variieren zwischen 24 ± 2 und 55 ± 3 mm ka−1. Einzugsgebiete, die von der Rumpffläche dominiert werden und durchschnittliche Hangneigungen von < 10° haben, erodieren mit Raten von 24–30 mm ka−1, während Einzugsgebiete mit größeren Anteilen steilerer Hänge (20–35°) ober- und unterhalb der Rumpffläche mit Raten von 30–55 mm ka−1 erodieren. Festgesteinsaufschlüsse auf der Rumpffläche erodieren mit einer niedrigeren Rate von ∼ 20 mm ka−1. Unsere 10Be-Daten dokumentieren und quantifizieren die neigungsabhängige Erosion des Harzes mit Raten von einigen Zehner Metern pro Million Jahre und die progressive Tieferlegung der Rumpffläche sowie deren Einschneidung durch Flüsse. Die beobachtete Differenz zwischen der schnelleren Erosion bodenbedeckter Areale und der langsameren Erosion von Festgesteinsoberflächen zeigt an, dass das Relief im Harz mit einer Rate von 5–10 mm ka−1 weiter zunimmt. Im Kontext der existierenden und widersprüchlichen Modelle zur Entwicklung der Harz-Topographie schlagen wir vor, dass der post-oligozäne Höhenunterschied von ∼ 300 m zwischen der Rumpffläche im Harz und der tieferliegenden Umgebung das Resultat von drei unterschiedlichen Prozessen ist. Erstens, eine Hebung des Harzes durch eine mögliche Reaktivierung der Aufschiebung am Nordrand während des Neogens und Quartärs bis vor ∼ 0.5 Ma. Zweitens, eine moderate Erosion weicher Sedimentgesteine in der Umgebung des Harzes. Drittens, eine Absenkung der umliegenden Gebiete durch Lösung und laterale Migration von permischem Salz im Untergrund. Schließlich betonen wir, dass eine aktive Aufschiebungstektonik entlang des Harznordrandes inkompatibel mit geologischen, geophysikalischen und geodätischen Befunden ist.
- Article
(8742 KB) - Full-text XML
- BibTeX
- EndNote


Rates and spatial patterns of erosion exert a major control on the topographic evolution of mountain ranges, in particular when rock uplift due to tectonic processes has ceased to be a dominant factor. Which intrinsic factors actually control the pace of erosion in mountainous landscapes has been a central theme within the field of geomorphology since Gilbert (1877) recognized – in a qualitative way – that “erosion is most rapid where the slope is steepest”. In a classical study, Ahnert (1970) showed that short-term (decadal) erosion rates derived from river-load measurements increase with local relief and mean slope angle in mid-latitude drainage basins. Since then, many studies have derived functional relationships between decadal sediment yield and catchment indices such as mean elevation, mean slope, or local relief (e.g. Pinet and Souriau, 1988; Summerfield and Hulton, 1994; Pan et al., 2010). Sediment-yield measurements are, however, associated with significant uncertainties and may underestimate erosion due to the stochastic nature of storm events and transient sediment storage (e.g. Benda and Dunne, 1997; Kirchner et al., 2001; Fuller et al., 2003; Meyer et al., 2010b).
To overcome the limitations of decadal sediment-yield estimates, a method is required that allows for the determination of erosion rates integrated over longer timescales of thousands of years. In situ-produced cosmogenic nuclides provide such a methodology, and their application has revolutionized geomorphological research in the past decades (Dunai, 2010). For the quantitative determination of erosion rates, the cosmogenic nuclide 10Be is commonly used. 10Be is produced by high-energy cosmic-ray particles in the widespread mineral quartz and provides the possibility of measuring erosion rates over a timescale of 103–105 years at outcrop and catchment scales (Lal, 1991; Brown et al., 1995; Dunai, 2010). Studies that derived catchment-wide erosion rates with 10Be have shown that hillslope angle and local relief are the most important topographic indices controlling rates of erosion in mountainous landscapes (Binnie et al., 2007; DiBiase et al., 2010; Palumbo et al., 2010; Portenga and Bierman, 2011; Schaller et al., 2016; Delunel et al., 2020). In addition, bedrock lithology exerts an important control on the pace of erosion, because it determines the strength and weathering behaviour of rocks (Palumbo et al., 2010; Portenga and Bierman, 2011; Scharf et al., 2013). Therefore, a uniform bedrock lithology is essential to decipher the effect of topographic parameters on erosion. By comparing catchment-wide 10Be erosion rates with local 10Be erosion rates for outcrops on ridge crests or low-relief surfaces, it is possible to determine whether the relief of a landscape is growing or in a state of decline (Hancock and Kirwan, 2007; Meyer et al., 2010a; Wolff et al., 2018; Heineke et al., 2019).
In this study, we determine 10Be-based erosion rates in the Harz Mountains, a fault-bounded mountain range that formed during tectonic inversion of the Central European Basin in the Late Cretaceous and experienced a minor phase of post-Oligocene uplift after the formation of a regional low-relief surface. All sampled catchments and bedrock outcrops are located in a single granite pluton (Brocken pluton) of largely homogenous mineralogical composition and rock strength, which is therefore well suited for the application of in situ-produced cosmogenic nuclides. Our results document the geologically recent pace of erosion and landscape evolution in the Harz Mountains.
During the Late Cretaceous between ∼ 90 and ∼ 70 Ma, Central Europe experienced a pulse of intraplate shortening, which caused basin inversion and led to thrust faulting and the uplift of fault-bounded mountain ranges (e.g. Kley and Voigt, 2008; Dielforder et al., 2019; von Eynatten et al., 2019). The material eroded from these WNW–ESE-striking mountain ranges was transported to adjacent sedimentary basins, which record the timing of faulting, mountain building, and erosion (e.g. DEKORP-BASIN Research Group, 1999; Stollhofen et al., 2008; von Eynatten et al., 2008; Voigt et al., 2021). In addition to the localized fault-controlled uplift and erosion of basement highs, a large number of apatite fission track (AFT) and (U–Th) He (AHe) ages indicate that a large region in central Germany experienced long-wavelength uplift and erosion of 3–4 km of mainly Mesozoic strata between ∼ 75 and ∼ 55 Ma (von Eynatten et al., 2021). This broad uplift signal reflects a combination of upwelling of the asthenosphere, thinning of the mantle lithosphere, and the development of dynamic topography (von Eynatten et al., 2021).
The Harz Mountains in north-central Germany represent a block of uplifted Variscan basement with a size of 90 × 30 km. The mountains are bound by a major reverse fault along its northern side (Fig. 1), which is referred to as the Harz Northern Boundary Fault (Harznordrandverwerfung). This fault has a throw of ∼ 6 km and dips 50–60° to the SSW, as revealed by field observations, seismic reflection data, and structural restoration (e.g. Krawczyk and Stiller, 1999; Franzke et al., 2004; Tanner and Krawczyk, 2017). The Harz Mountains consist mainly of Palaeozoic sedimentary rocks (Fig. 1) that belong to the Rhenohercynian belt of the Variscan orogen and are dominated by foliated and faulted Ordovician to Carboniferous low-grade metamorphic sequences as well as siliciclastic and carbonate formations (Franke, 1989). Three granite intrusions (Brocken, Ramberg, and Oker plutons; Fig. 1) were emplaced in the early Permian at 283 ± 3 Ma (Zech et al., 2010).

Figure 1Geological overview map of the Harz Mountains, the Harz Northern Boundary Fault (black line with triangles), and the adjacent Subhercynian Basin in central Germany (see inset map on the top right for a general location). The map has been simplified and redrawn from Hinze et al. (1998). The study area is located entirely within the area of the Brocken pluton.
After late-orogenic extension and erosion of the Variscan mountain belt (Ziegler et al., 2006), the Harz area fell under marine influence, which caused the accumulation of thick evaporite and carbonate sequences during the upper Permian (Zechstein) and the subsequent deposition of sandstones, limestones, evaporites, and claystones during the Mesozoic. During the Late Cretaceous, basin inversion and reverse faulting led to the formation of the WNW-striking Harz Northern Boundary Fault, which caused rock uplift and the removal of Permian and Mesozoic cover sediments as well as Palaeozoic rocks by erosion (Kley and Voigt, 2008; von Eynatten et al., 2021). AFT ages of ∼ 83 to ∼ 73 Ma, thermal modelling of AFT data, and provenance analysis indicate that about 6 km of rocks was removed from the Harz Mountains since the Late Cretaceous, with 2–3 km being removed between the early Santonian and early Campanian periods (i.e. from 86 to 82 Ma) (von Eynatten et al., 2008, 2019). The Harz Northern Boundary Fault separates the Harz Mountains from the Mesozoic sedimentary rocks of the adjacent Subhercynian Basin to the north (Voigt et al., 2006; Tanner and Krawczyk, 2017). Between the reverse fault and the basin fill lies a ∼ 2 km wide zone of steeply dipping upper Permian to Cretaceous strata.
The current morphology of the Harz Mountains is dominated by remnants of a low-relief bedrock surface, which occurs at different altitudes in the western, central, and eastern parts of the mountain range (Frebold, 1933; Lüttig, 1955; Mücke, 1966; Diercks et al., 2021) (Fig. 2a). In the western Harz, the low-relief surface has an elevation of 610 ± 10 m a.s.l., whereas in the central Harz it dips gently NNE and ranges in elevation from 620 to 520 m a.s.l. (Fig. 2b). In the eastern Harz, the surface gradually declines from an elevation of 550 to 430 m a.s.l. (Diercks et al., 2021). The summit region of the Harz Mountains is formed by the Brocken pluton, reaching an altitude of 1141 m a.s.l. The margins of the Brocken granite are exposed below the low-relief surface, which has been incised by rivers draining the summit region, including the river Ilse, which formed a steep valley in the northern part of the pluton (Fig. 3).
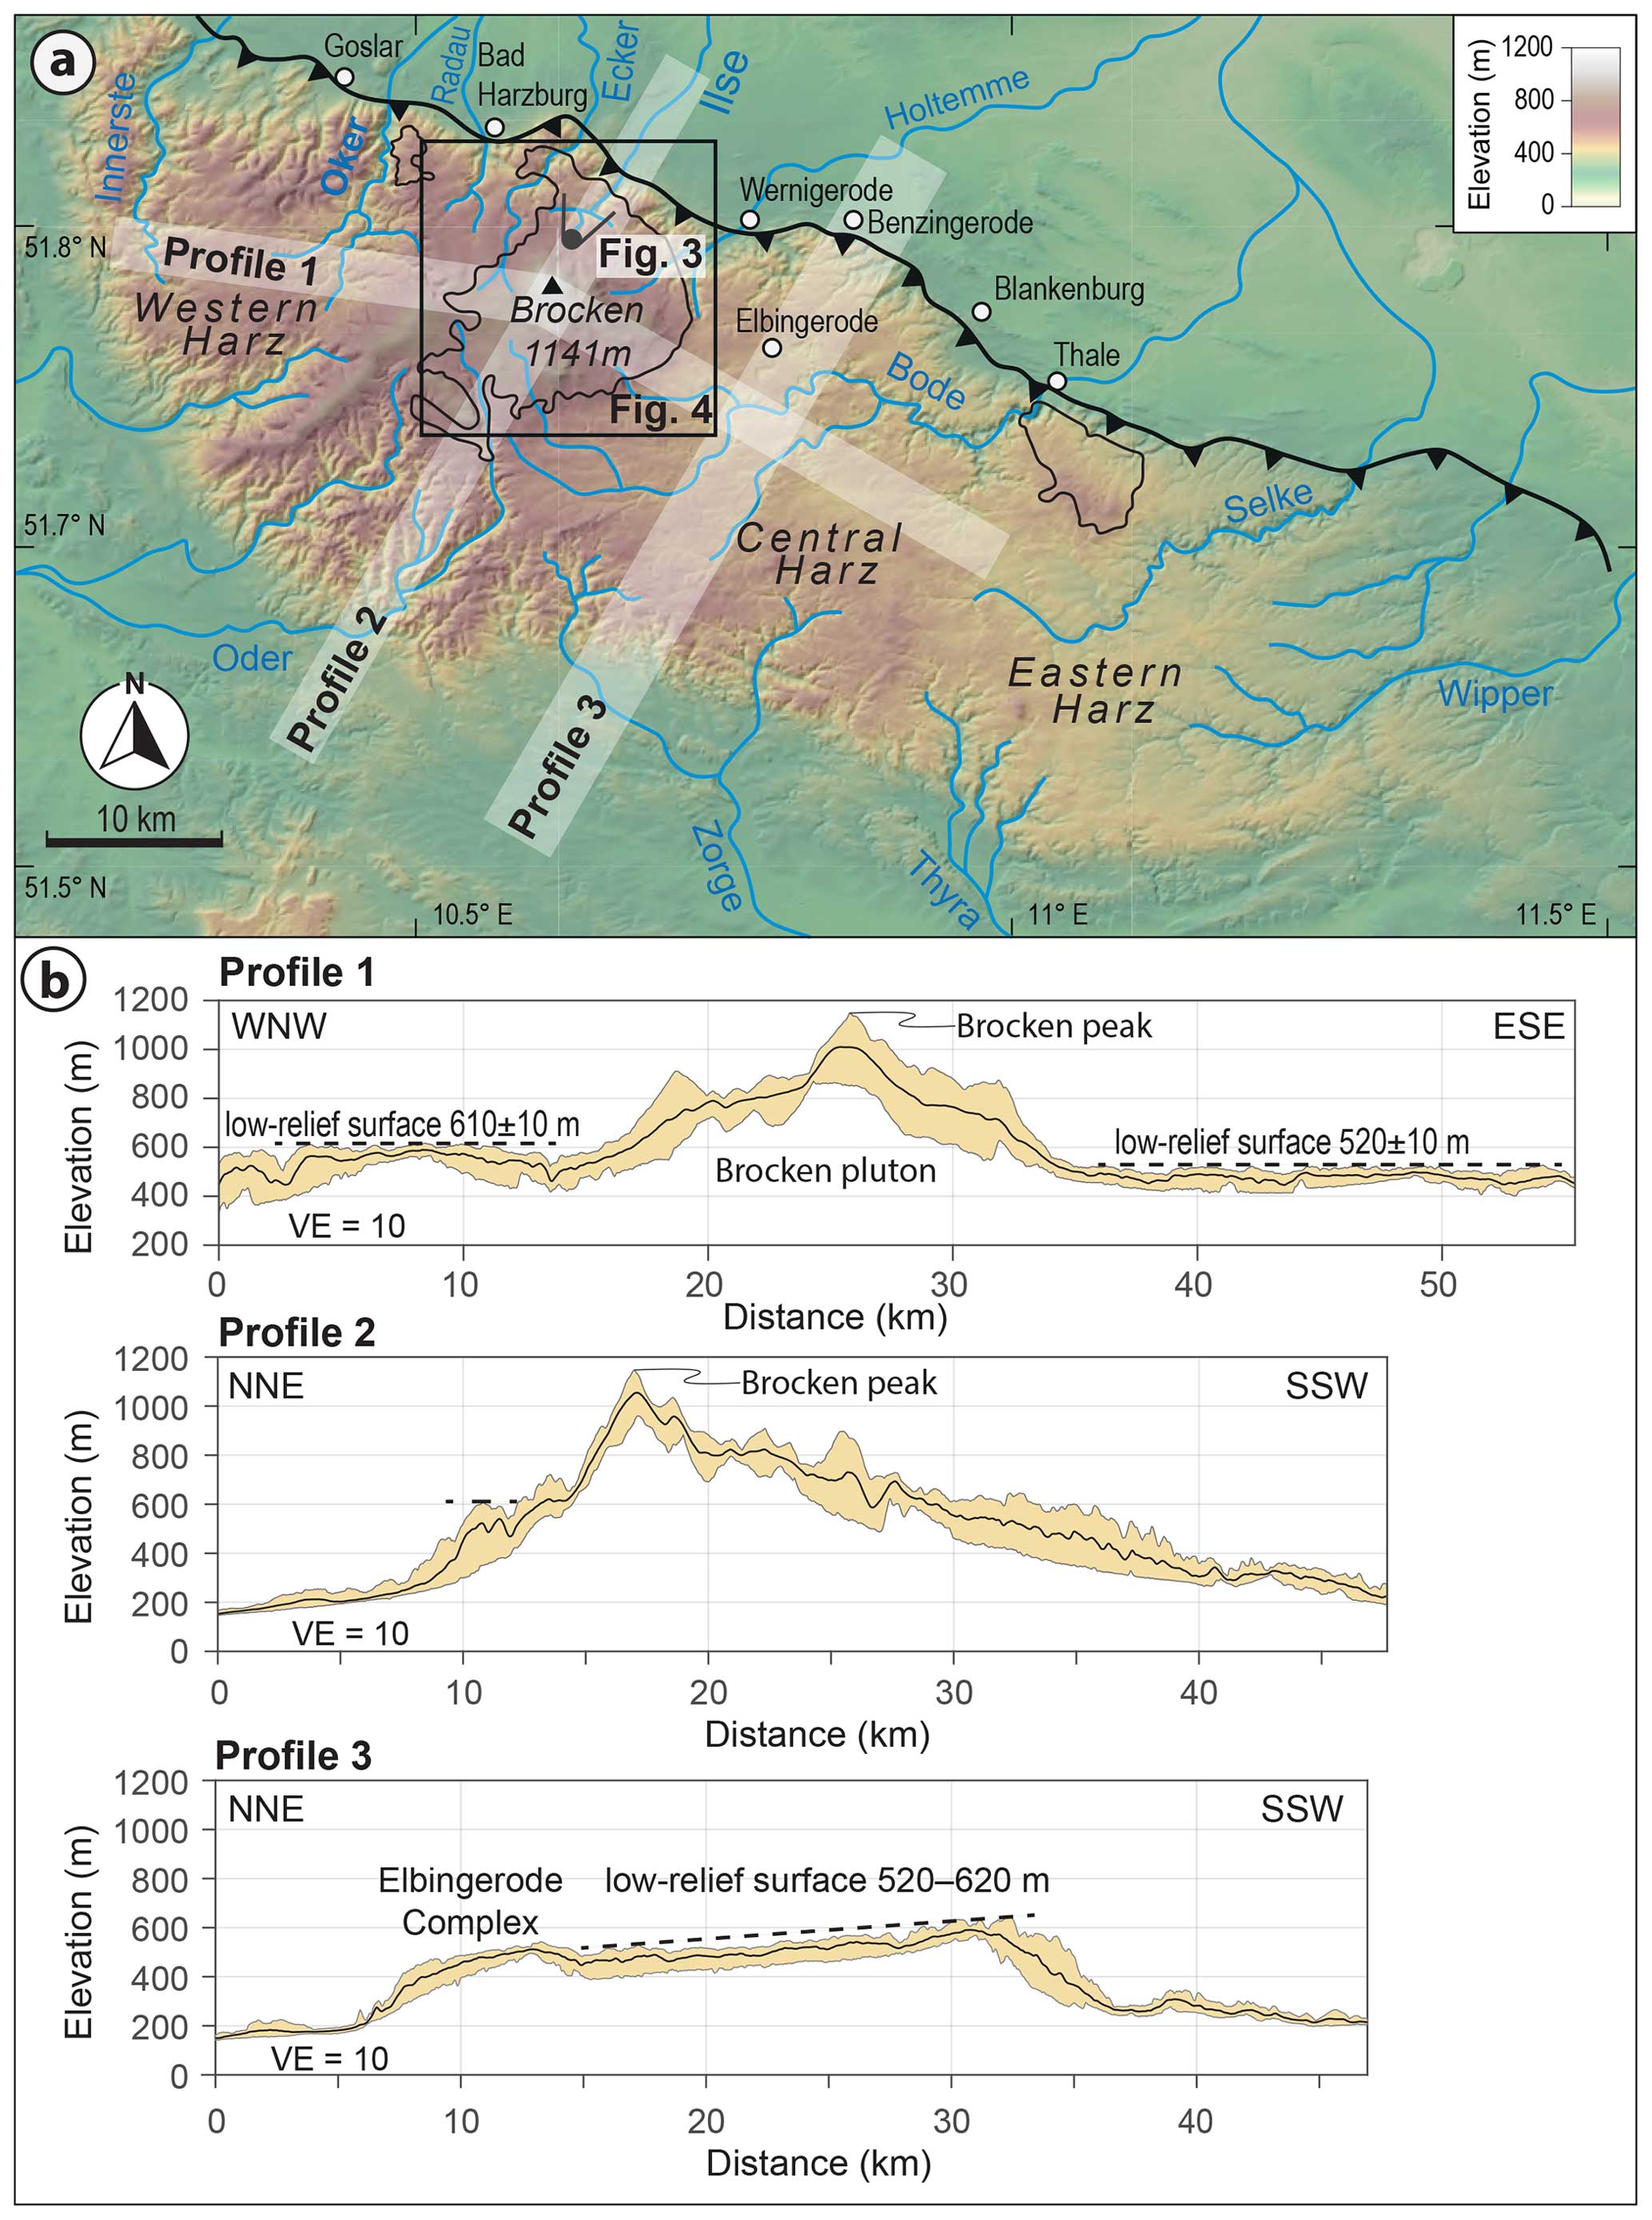
Figure 2The digital elevation model (a) and three swath profiles (b) illustrate the hypsometry of the Harz Mountains and the geometry of the low-relief surface in the western and central Harz (profile tracks are shown as transparent white traces). The Brocken, Oker, and Ramberg granites (see geological map in Fig. 1) are outlined by thin lines. The black circle north of the Brocken indicates the viewpoint of the photo shown in Fig. 3. The black square marks the location of the study and sampling area within the Brocken pluton (shown in Fig. 4).
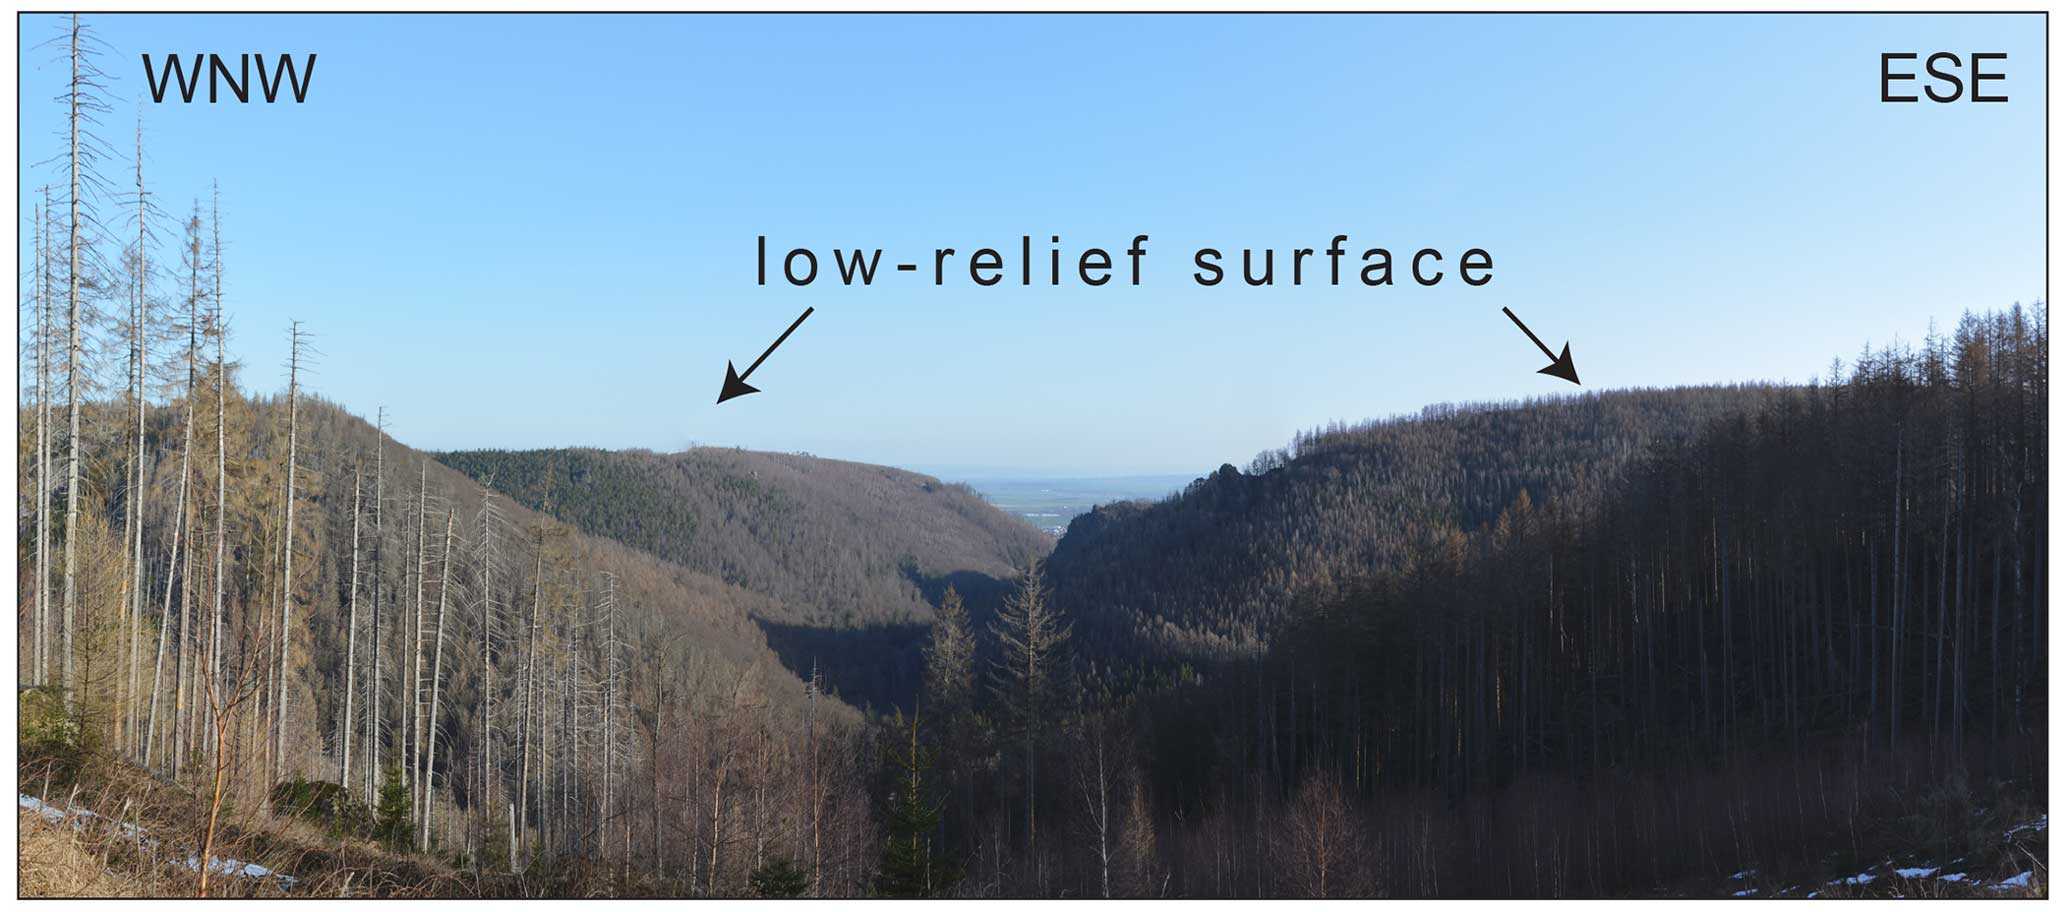
Figure 3Photographic view of the Ilse catchment looking to the NNE. The Ilse has incised a steep valley into the Brocken pluton. To the left and right above the valley, remnants of the low-relief bedrock surface are well preserved. The view direction and position of the photo are indicated in Figs. 2 and 4.
The origin of the Harz morphology and particularly its low-relief bedrock surface have been debated for more than a century (Philippi, 1910; Penck, 1924; von der Sahle, 1942; Hövermann, 1950; Mücke, 1966; Thiem, 1974; Jordan, 1995; König et al., 2011; Diercks et al., 2021). Key problems in this long-standing discussion centred around the questions (a) of whether the bedrock surface constitutes a single surface or is composed of several distinct levels, with higher levels being older (Hövermann, 1950; Thiem, 1974); (b) on the genetic interpretation of the surface – as a single peneplain (Rumpffläche, Philippi, 1910), as a piedmont benchland (Piedmonttreppe, Penck, 1924), or as a system of stepped peneplains (Rumpftreppe, Hövermann, 1950); and finally (c) on the duration and timing of its formation. Most workers agree that the main period of uplift in the Late Cretaceous (formation of the proto-Harz) was followed by a long phase of erosion and topographic flattening that generated a low-relief surface (Philippi, 1910; Mücke, 1966; Thiem, 1974; König et al., 2011; Voigt et al., 2021). As this surface was cut across lithologies from the Harz Mountains to the adjacent basin (Voigt et al., 2021), its original extent was at least of a regional scale (Philippi, 1910; Mücke, 1966; Thiem, 1974; König et al., 2011; Voigt et al., 2021). The long-lasting process of planation ended in the upper Oligocene, as shown by the deposition of marine sediments (König et al., 2011) locally preserved in the northern foreland of the central Harz and in uplifted karst caves within the Devonian limestones of the Elbingerode Complex (Figs. 1, 2) (König et al., 2011, and references therein).
The elevated position of the low-relief bedrock surface in the Harz was commonly interpreted as a result of post-Oligocene uplift of the mountain range relative to its surroundings (e.g. Philippi, 1910; Jankowski, 1964; Thiem, 1974; König and Blumenstengel, 2005; König et al., 2011; Diercks et al., 2021). However, a significant part of the ca. 200–300 m elevation difference between the bedrock surface and the surrounding areas may also be caused by the erosion of sedimentary rocks in the vicinity of the mountains (Diercks et al., 2021) and by the dissolution and lateral migration of upper Permian salt, which had an original thickness of several hundred metres (Paul, 2019). Different opinions also exist on the amount and the timing of the post-Oligocene uplift of the Harz Mountains (e.g. Mücke, 1966; Thiem, 1974; König et al., 2011; Diercks et al., 2021). It is still under debate whether the uplift is related to a reactivation of pre-existing faults (e.g. the Harz Northern Boundary Fault), to a long-wavelength doming and flexure of the crust (e.g. Mücke, 1966; Thiem, 1974; Kaiser et al., 2005; Müller et al., 2020), or to glacial isostatic adjustments in response to ice loading by Quaternary glaciations of the Subhercynian Basin during the Middle Pleistocene (Diercks et al., 2021).
In the Pleistocene, parts of northern Germany were covered several times by the Fennoscandian ice sheet. During the Weichselian glaciation (ca. 110–18 ka) and the late Saalian glaciation (ca. 230–130 ka), the southern ice sheet margin was located ∼ 150 and ∼ 70 km north of the Harz Mountains, respectively (Eissmann, 2002; Ehlers et al., 2011; Lauer and Weiss, 2018). During the early Saalian (ca. 330–250 ka) and the Elsterian glaciation (ca. 480–420 ka), the ice reached the northern margin of the Harz Mountains and also covered the low-lying easternmost part of the Harz during the latter glaciation (Eissmann, 2002; Lauer and Weiss, 2018). Periglacial conditions prevailed in the Harz Mountains and their northern foreland during glacial times, as shown by the presence of reworked loess, ice wedges, and cryoturbation (e.g. Feldmann, 2002; Weymann et al., 2005). Remnants of glacial deposits in the highest part of the Harz Mountains were attributed to the presence of small, isolated glaciers (Duphorn, 1968; Eissmann, 2002; Diercks et al., 2021), but because these deposits have not been dated, whether they formed during the Elsterian, Saalian, or Weichselian glaciations remains controversial.
In summary, despite a century of research, many questions regarding the Neogene and Quaternary morphological development of the Harz Mountains persist. Unresolved issues centre around the timing, mechanism, and rate of potential uplift – particularly during the Quaternary – and its possible effects on the regional exhumation and erosion dynamics. It is also unknown whether or not the Harz Mountains continue to adjust to recent perturbations caused by Pleistocene tectonics or climate variations. To address these questions, we measured concentrations of in situ-produced 10Be in bedrock outcrops and in stream sediments of rivers draining the Brocken granite and determined local and spatially averaged erosion rates for these watersheds. By doing so we aim to quantify rates of surface denudation over timescales of about 104 years and to unravel the Quaternary landscape evolution affecting the Brocken massif.
3.1 Determining erosion rates with cosmogenic nuclides
Cosmogenic nuclides enable us to measure erosion rates over millennial timescales at the outcrop or catchment scale (e.g. Brown et al., 1995; Niedermann, 2002; Dunai, 2010). The erosion rate E (mm kyr−1) of a steadily eroding bedrock surface is approximately inversely proportional to its cosmogenic-nuclide concentration and given by
where P is the local surface production rate in atoms per gram per year (at g−1 yr−1), C is the nuclide concentration at the surface (at g−1), λ is the decay constant of the nuclide (1 yr−1), and z* is the absorption depth scale (i.e. the effective attenuation length divided by rock density) (Lal, 1991). Owing to the decrease in the production rate with depth, erosion rates calculated from cosmogenic-nuclide concentrations are averaged over the time interval needed to erode one absorption depth z* (i.e. ∼ 60 cm; Granger et al., 1996). Depending on the erosion rate, this time interval typically corresponds to 102–105 years (von Blanckenburg, 2006). The relationship given in Eq. (1) can be applied to quantify local erosion and to derive spatially averaged erosion rates for entire river catchments by determining the 10Be concentration in quartz of sand samples from active streams (e.g. Brown et al., 1995; Granger et al., 1996). This approach assumes that (1) quartz is homogeneously distributed in the eroding rocks, (2) the sediment in the stream channels is well mixed, (3) erosion in the catchment is in steady state (i.e. nuclide production is equal to the outflux of the nuclide via erosion and radioactive decay), and (4) erosion is uniform through time (e.g. von Blanckenburg, 2006).
3.2 Sampling approach
To determine 10Be erosion rates in the area of the Brocken granite, we took 10 stream-sediment samples and two bedrock samples. Samples 21D1, 21D2, 21D4, and 21D5 were obtained from four small to mid-sized streams (Ecker, Ilse, Warme Bode, and Kalte Bode), which drain the summit region of the Harz Mountains in a radial fashion (Fig. 4). Within the respective catchments, we collected five samples from smaller subcatchments – three samples from the Ilse catchment (21D7, 21D9, 21D10) and two from subcatchments of the Warme Bode (21D11) and the Kalte Bode (21D12) (Fig. 4). Sediment sample 21D3 was taken from a small creek about 2 km to the west of the Warme Bode catchment. Each sediment sample was collected from several points along the respective stream over a distance of 30–80 m, which should increase the probability of obtaining a well-mixed sample with a 10Be concentration reflecting the mean erosion rate of the catchment (Heineke et al., 2019). In the field, the stream sediment was sieved to a grain size of 0.5–2.0 mm, and this grain-size fraction was used for further treatment in the lab (see Sect. 3.3 below). The two bedrock samples are from outcrops located at the boundary of the Kalte Bode catchment (21D6) and within the Ilse catchment (21D8) (Fig. 4). These samples had a thickness of 4 cm (21D6) and 6 cm (21D8).
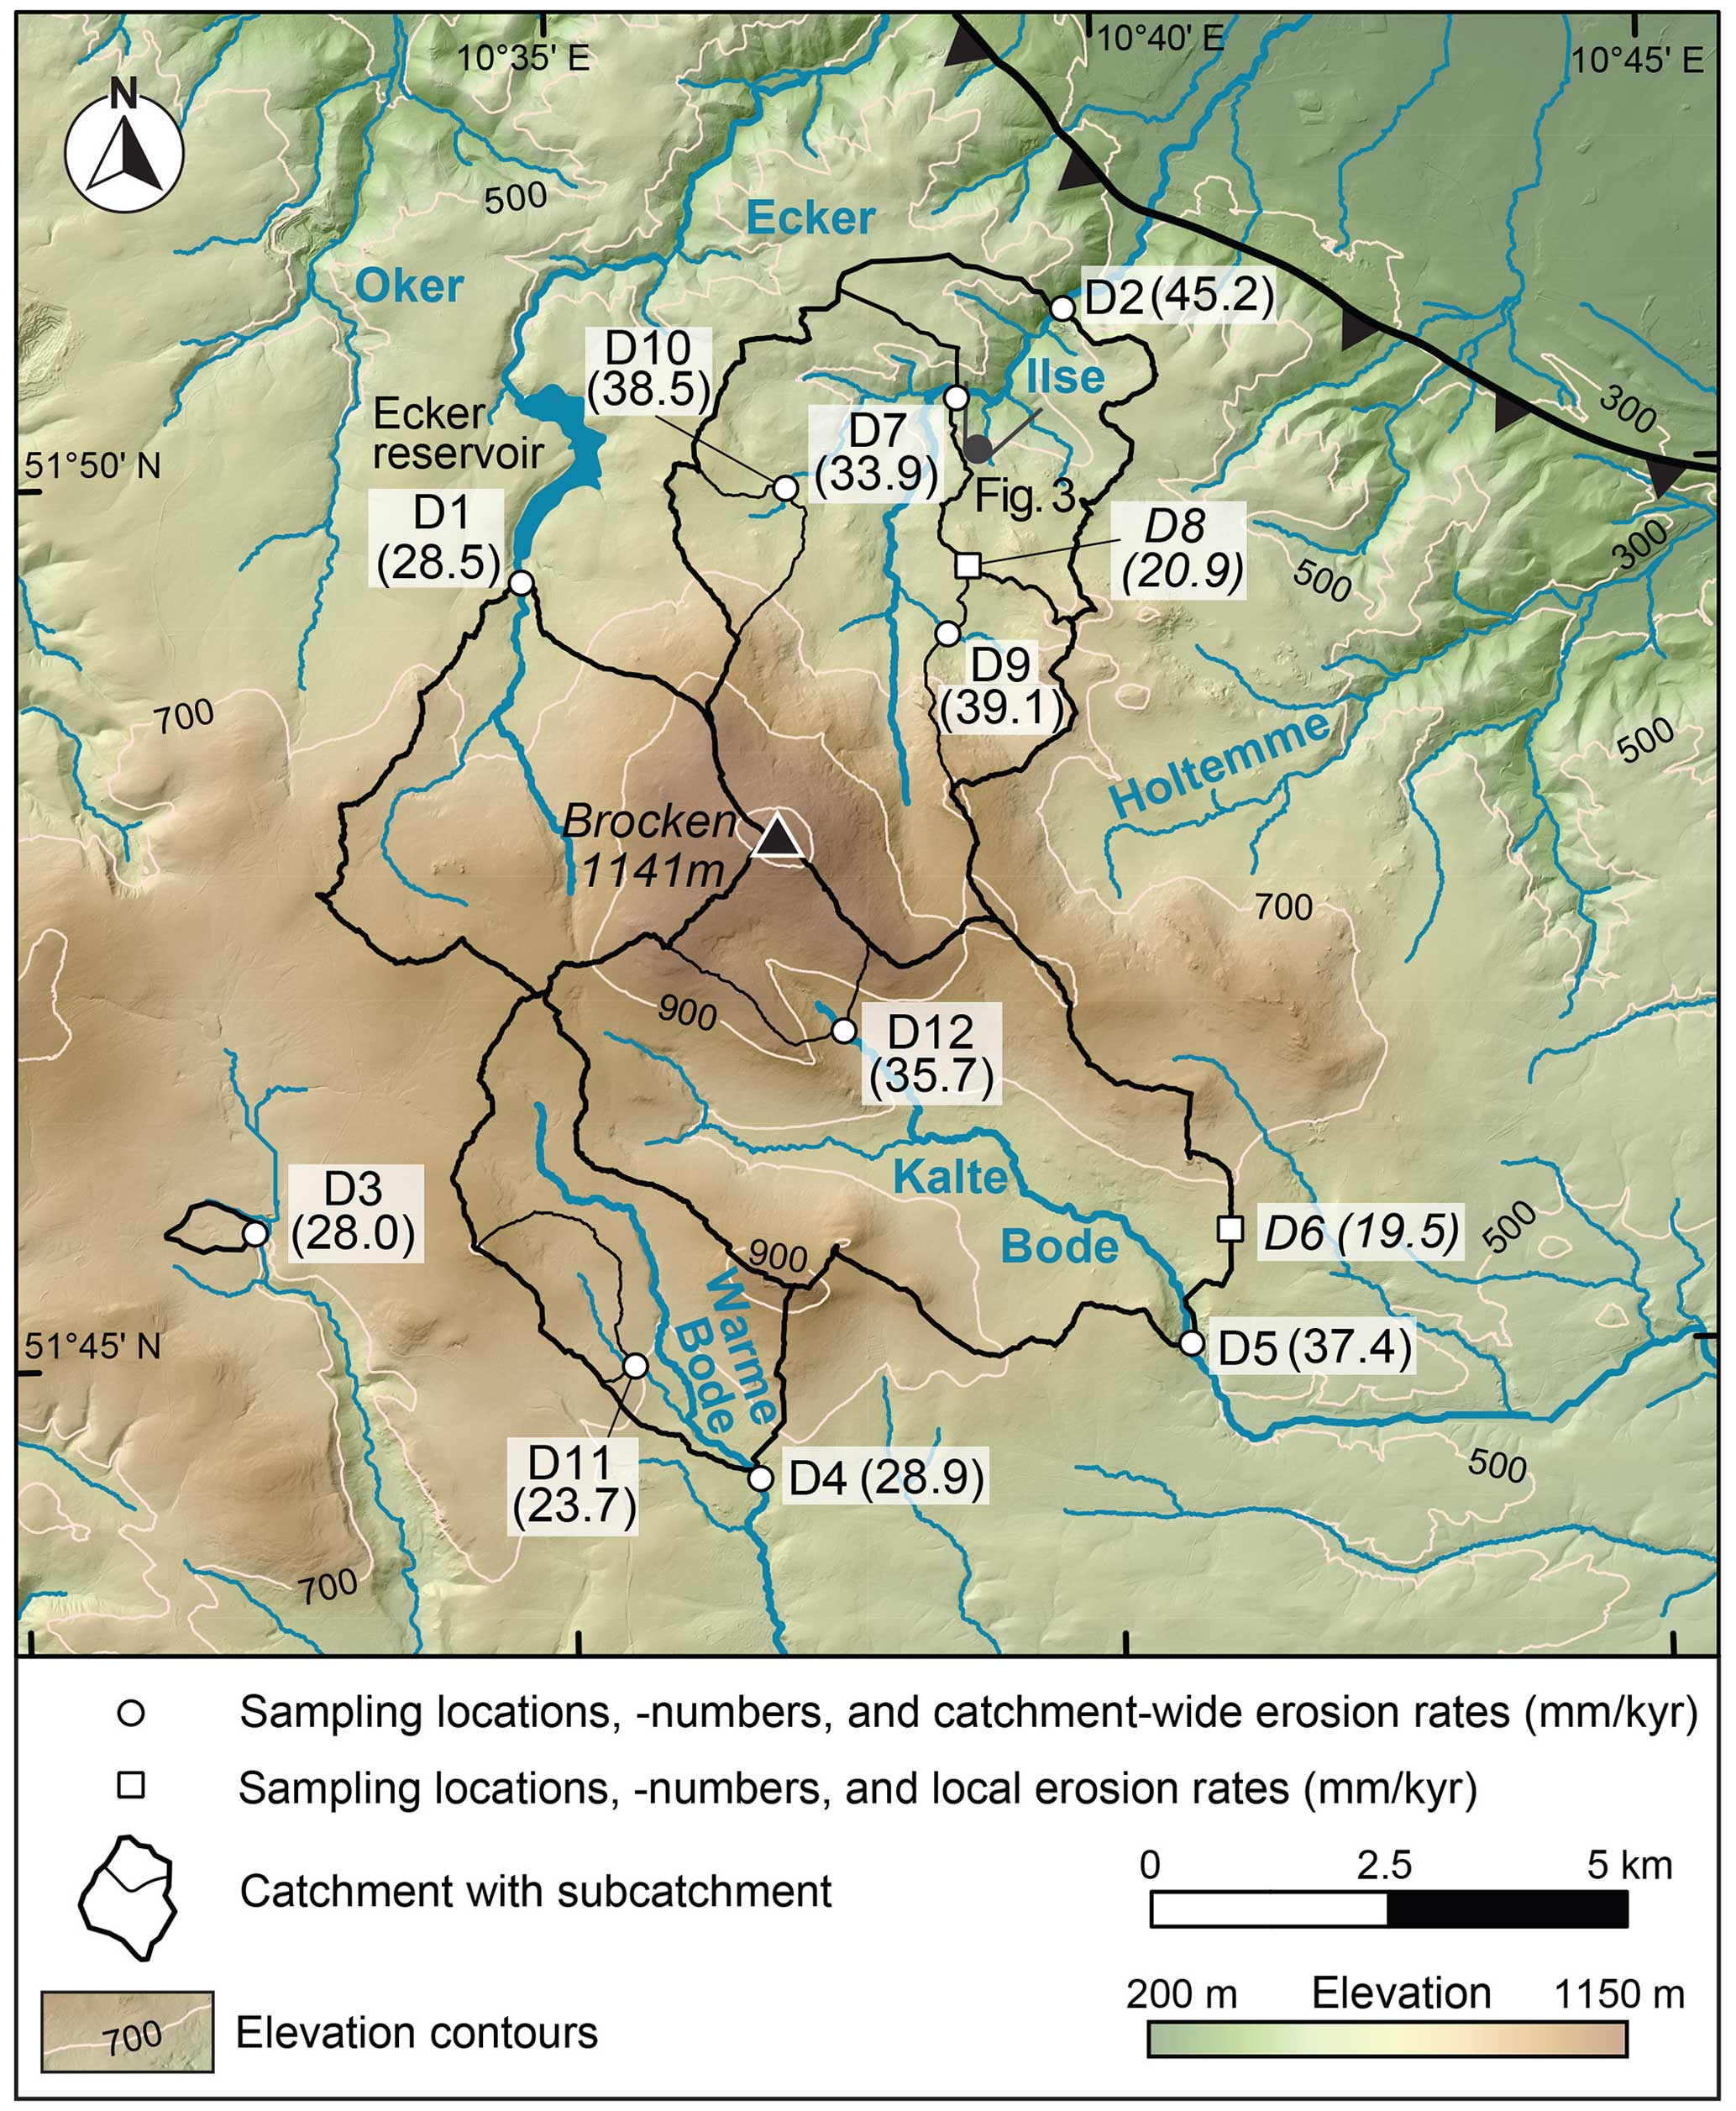
Figure 4Digital elevation model of the study area (lidar data, spatial resolution of 5 m) showing the position of the 10 stream-sediment samples (white circles) and two bedrock samples (white squares). The boundaries of the main catchments are marked by thick black lines; smaller subcatchments are indicated by thin lines. The calculated erosion rates (in mm kyr−1) obtained from all samples are given in parentheses next to the sample ID.
3.3 Analytical procedures and calculation of 10Be erosion rates
Sample preparation and chemical separation of 10Be from quartz was carried out at the Institute of Geology and Palaeontology, University of Münster, Germany. First, the sediment samples (with a grain size of 0.5–2.0 mm) and the bedrock samples were crushed and washed. Then, all samples were sieved to obtain a grain-size fraction of 250–500 µm. This fraction was split into a magnetic and a non-magnetic fraction. The cleaning of the non-magnetic fraction containing quartz consisted of a single etching step in 6 M HCl at 80 °C and four etching steps in dilute HF HNO3 in an ultrasonic bath at 80 °C (Kohl and Nishiizumi, 1992). In addition, all samples were further purified in aqua regia and 8 M HF solutions for 1 h at 100 °C (Goethals et al., 2009). This cleaning step was repeated twice. The sample purity was checked by dissolving ∼ 0.5 g of quartz in 40 % HF. After drying, the resulting residue was again dissolved in 0.3 M HNO3 and analysed using an ICP-OES system. Following the purity check, about 15 g of quartz from each sample was dissolved in 40 % HF after the addition of ∼ 0.3 mg of Be carrier (Table 1). Following complete dissolution, all samples were converted into chloride form using 6 M HCl. Beryllium was separated by successive anion and cation exchange columns and precipitated as Be(OH)2 at pH 8–9. Following the transformation to BeO at 1000 °C, targets were prepared by mixing of the BeO with Nb powder. The samples were analysed at the Centre of Accelerator Mass Spectrometry at the University of Cologne, Germany (CologneAMS; Dewald et al., 2013).
Table 1Sample numbers, AMS IDs, mean latitude and longitude of catchments, weight of quartz samples, mass of the Be carrier used for samples and blanks, and measured ratios.
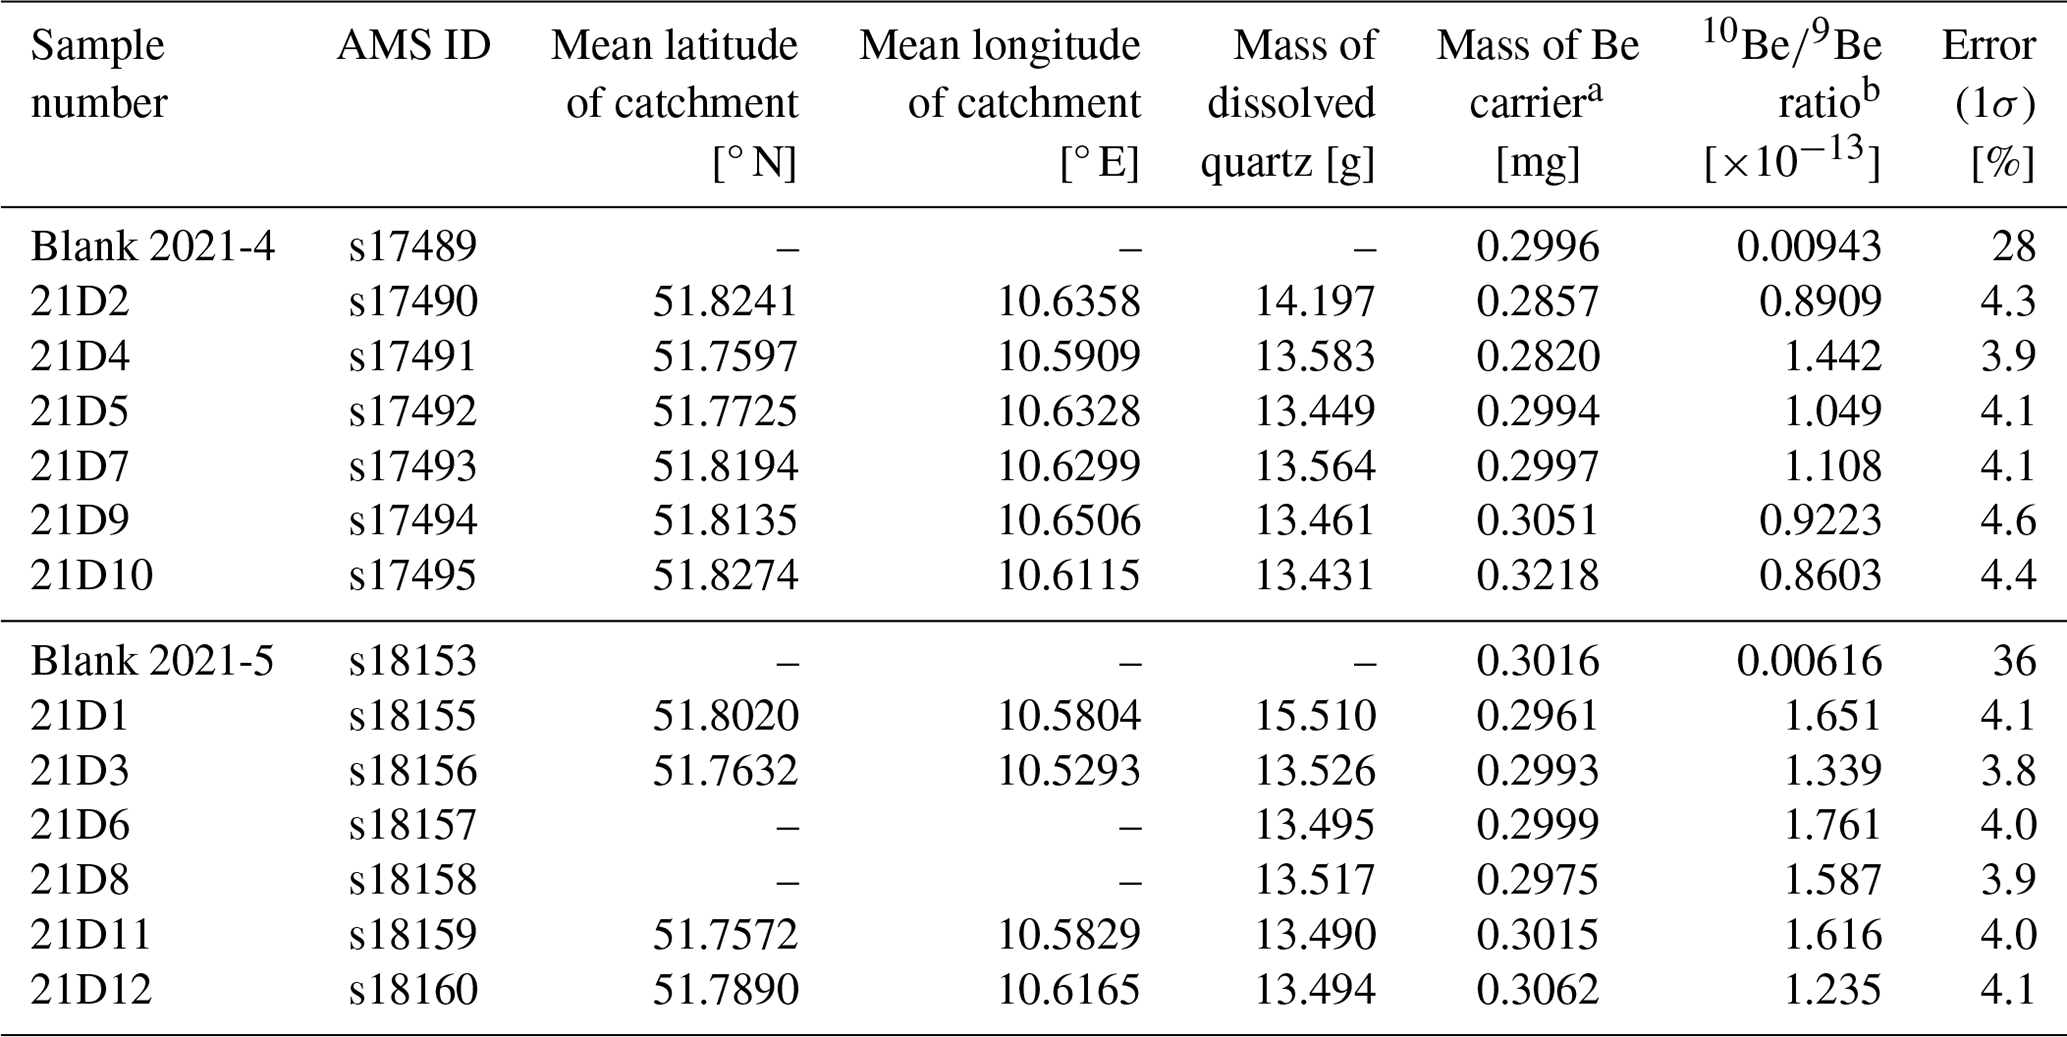
a The Be carrier solution has a 9Be concentration of 369.5 ± 2.0 ppm and was prepared by Friedhelm von Blanckenburg at the GFZ Potsdam from a phenakite crystal obtained from a deep mine in the Urals, Russia (Goethals et al., 2009).
b The reported ratios have been corrected for the presence of natural 9Be as described in Sect. 3.3 but have not yet been corrected for the blank.
The ICP-OES analysis of the chemically cleaned quartz revealed that the samples dissolved for 10Be analysis contain between 0.29 and 0.76 ppm natural 9Be. Such relatively high 9Be concentrations are rather unusual for the mineral quartz but were also observed in a few other cosmogenic-nuclide studies (e.g. Strobl et al., 2012). As about 15 g of purified quartz was dissolved from each sample, the sample solutions contained 0.004–0.011 mg of natural 9Be, which is 1.3 %–3.6 % of the amount of ∼ 0.3 mg of 9Be added with the 9Be carrier solution. Therefore, we took the presence of the natural 9Be into account and corrected for it when calculating the in situ-produced 10Be concentrations.
Local and catchment-wide erosion rates were calculated from the 10Be concentrations reported in Table 2 with version 3 of the CRONUS-Earth online calculator (Balco et al., 2008) using the time-independent scaling model of Lal (1991) and Stone (2000) and the assumption of no cover by snow or ice. As the online calculator cannot calculate catchment-wide erosion rates based on pixelwise production rates, we proceeded as follows. We applied the scaling procedure of Stone (2000) to calculate the local 10Be production rate for every pixel of a catchment using a DEM with a pixel size of 10 m. The 10Be production rate due to spallation at sea level and high latitude (SLHL) is 4.01 at g−1 yr−1 (Borchers et al., 2016, their Table 7). The SLHL 10Be production rates by slow and fast muons are 0.0467 and 0.0278 at g−1 yr−1, respectively, and were derived with the MATLAB code provided in the data repository of Balco (2017). The SLHL 10Be production rates were scaled separately to the position and elevation of each pixel of a catchment with Eqs. (1)–(3) of Stone (2000). Slow and fast muons were scaled with attenuation lengths of 260 and 510 g cm−2, respectively (Braucher et al., 2011). For the scaling procedure, we used the mean latitude of each catchment, which is given in Table 1. This simplification does not affect the results because our catchments are small. The 10Be production rates due to spallation and muons obtained for all pixels were then added, and the average 10Be production rate for each catchment was calculated. In the last step, we determined the elevation that is equivalent to the average 10Be production rate and is called “equivalent catchment elevation” in Table 2. Finally, the catchment-wide erosion rates were calculated with the CRONUS-Earth online calculator using the equivalent elevation as input. The procedure described above has the advantage that the erosion rates can be easily reproduced with the information given in Table 2. The online calculator also has the advantage of providing internal and external uncertainties on the erosion rates. Internal uncertainties include the analytical uncertainty and the error of the blank correction, whereas external uncertainties also include the systematic uncertainty of the sea-level, high-latitude production rate of 10Be. Finally, we note that erosion rates based on the mean elevation of the catchments (instead of the mean production rate from the pixel-based calculations) differ by less than 1.5 % from those reported in Table 2.
Table 210Be concentrations and erosion rates from stream-sediment and bedrock samples in the area of the Brocken granite, Harz Mountains.
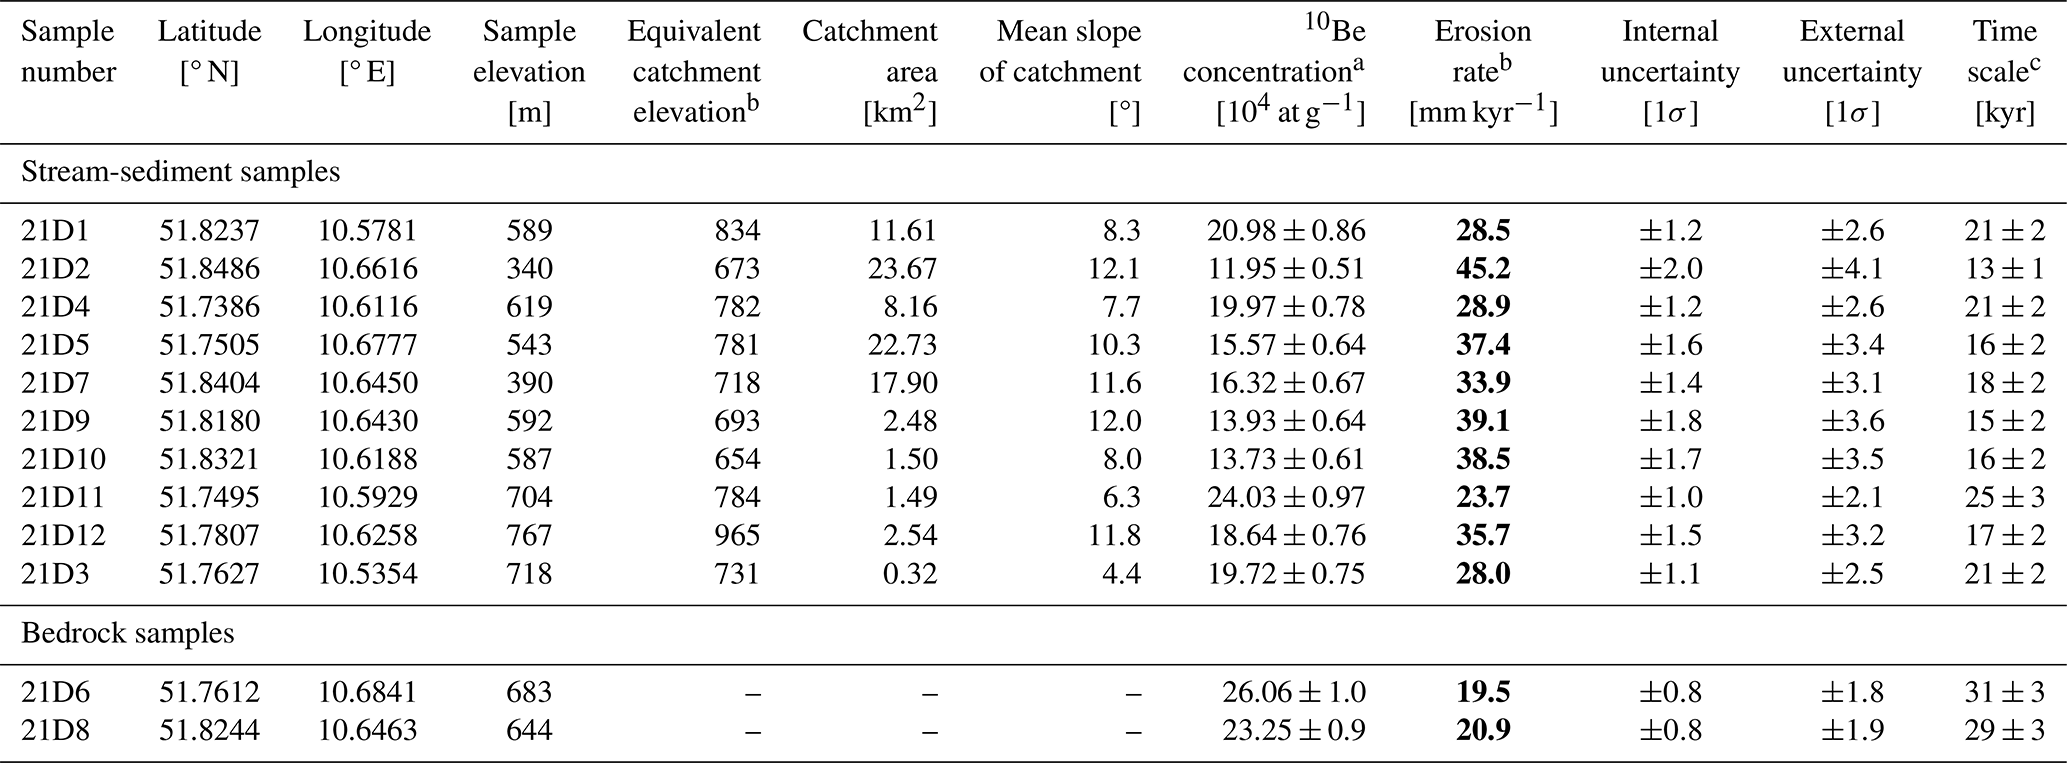
a Blank-corrected 10Be concentrations (blank correction is ≤ 1.1 % for all samples). The uncertainty of the 10Be concentration (1σ) includes the error of the blank correction and the propagated error of the analytical uncertainty. The analytical error takes into account the error based on counting statistics, the scatter of the repeated measurement of the same sample, and the uncertainty of the standard normalization. 10Be concentrations were measured at CologneAMS, Germany (Dewald et al., 2013), and are normalized to the standards KN01-6-2 and KN01-5-3 with nominal ratios of and , respectively. We also analysed one aliquot of the quartz reference material CoQtz-N with a 10Be concentration of at g−1 (Binnie et al., 2019), for which we obtained a concentration of at g−1.
b Erosion rates were calculated with the CRONUS-Earth 10Be−26Al online calculator (Balco et al., 2008; http://hess.ess.washington.edu, last access: 8 July 2024; version 3) and the time-invariant production rate scaling model of Lal (1991)–Stone (2000) (see Sect. 3.3 for details). The equivalent catchment elevation is the elevation that corresponds to the spatially averaged 10Be production rate of a catchment. For calculating the erosion rates, we used a density of 2.65 g cm−3. Internal uncertainties include the analytical uncertainty and the error of the blank correction, whereas external uncertainties also include the systematic uncertainty of the sea-level, high-latitude production rate.
c Erosion rates integrate over a time that is calculated by dividing the absorption depth scale of 60 cm with the erosion rate (using the external uncertainty).
The 10Be catchment-wide erosion rates derived from the 10 stream-sediment samples range from 23.7 ± 1.0 to 45.2 ± 2.0 mm kyr−1 (internal uncertainties), whereas the two samples from bedrock outcrops yielded consistent local erosion rates of 19.5 ± 0.8 and 20.9 ± 0.8 mm kyr−1 (Table 2). The two western catchments of the rivers Ecker and Warme Bode erode at rates of ∼ 28.5 and ∼ 28.8 mm kyr−1 (samples 21D1 and 21D4), whereas the watershed of the Kalte Bode returned a rate of ∼ 37 mm kyr−1 (sample 21D5) (Fig. 4). The highest erosion rate of 45.2 ± 2.0 mm kyr−1 was obtained for the Ilse catchment (sample 21D2), which is deeply incised in its northern part (Figs. 3, 4). The less-incised upper part of this catchment erodes at a lower rate of 33.7 ± 1.4 mm kyr−1 (sample 21D7). Using the 10Be concentrations of the two samples 21D2 and 21D7, we calculated a differential erosion rate for the lower part of the Ilse catchment following the approach of Vance et al. (2003). This approach uses the fact that one sample (here 21D2) receives its sediment from the entire catchment, whereas the other sample located farther upstream (here 21D7) receives its sediment only from the respective upstream part of the catchment (Fig. 4). Using the 10Be concentrations of the two samples taken at different positions along the main channel, the erosion rate of the lower part of the entire catchment (here the area between 21D7 and 21D2) can be calculated using the equations given in Vance et al. (2003). The resulting erosion rate for the deeply incised northern part of the Ilse catchment is 54.6 ± 3.4 mm kyr−1.
A digital elevation model with a spatial resolution of 5 m (Fig. 4) was used to calculate a slope map that illustrates the spatial variability of the hillslope angles in the study area (Fig. 5). We also determined slope–frequency distributions for all catchments, differentiating between catchments with an area of more than 5 km2 (including the lower and upper part of the Ilse catchment) and smaller catchments, which are less than 2.6 km2 in size (Table 2; Fig. 5). The slope–frequency distributions of the four catchments with the lowest erosion rates (< 30 mm kyr−1) have their peaks at low slope angles of 3–6° (21D1, 21D3, 21D4, and 21D11). In contrast, the three catchments with the highest erosion rates (21D9, 21D2, and the lower part of D2) are characterized by a significant portion of slopes with angles between 20 and 35° (Fig. 5).
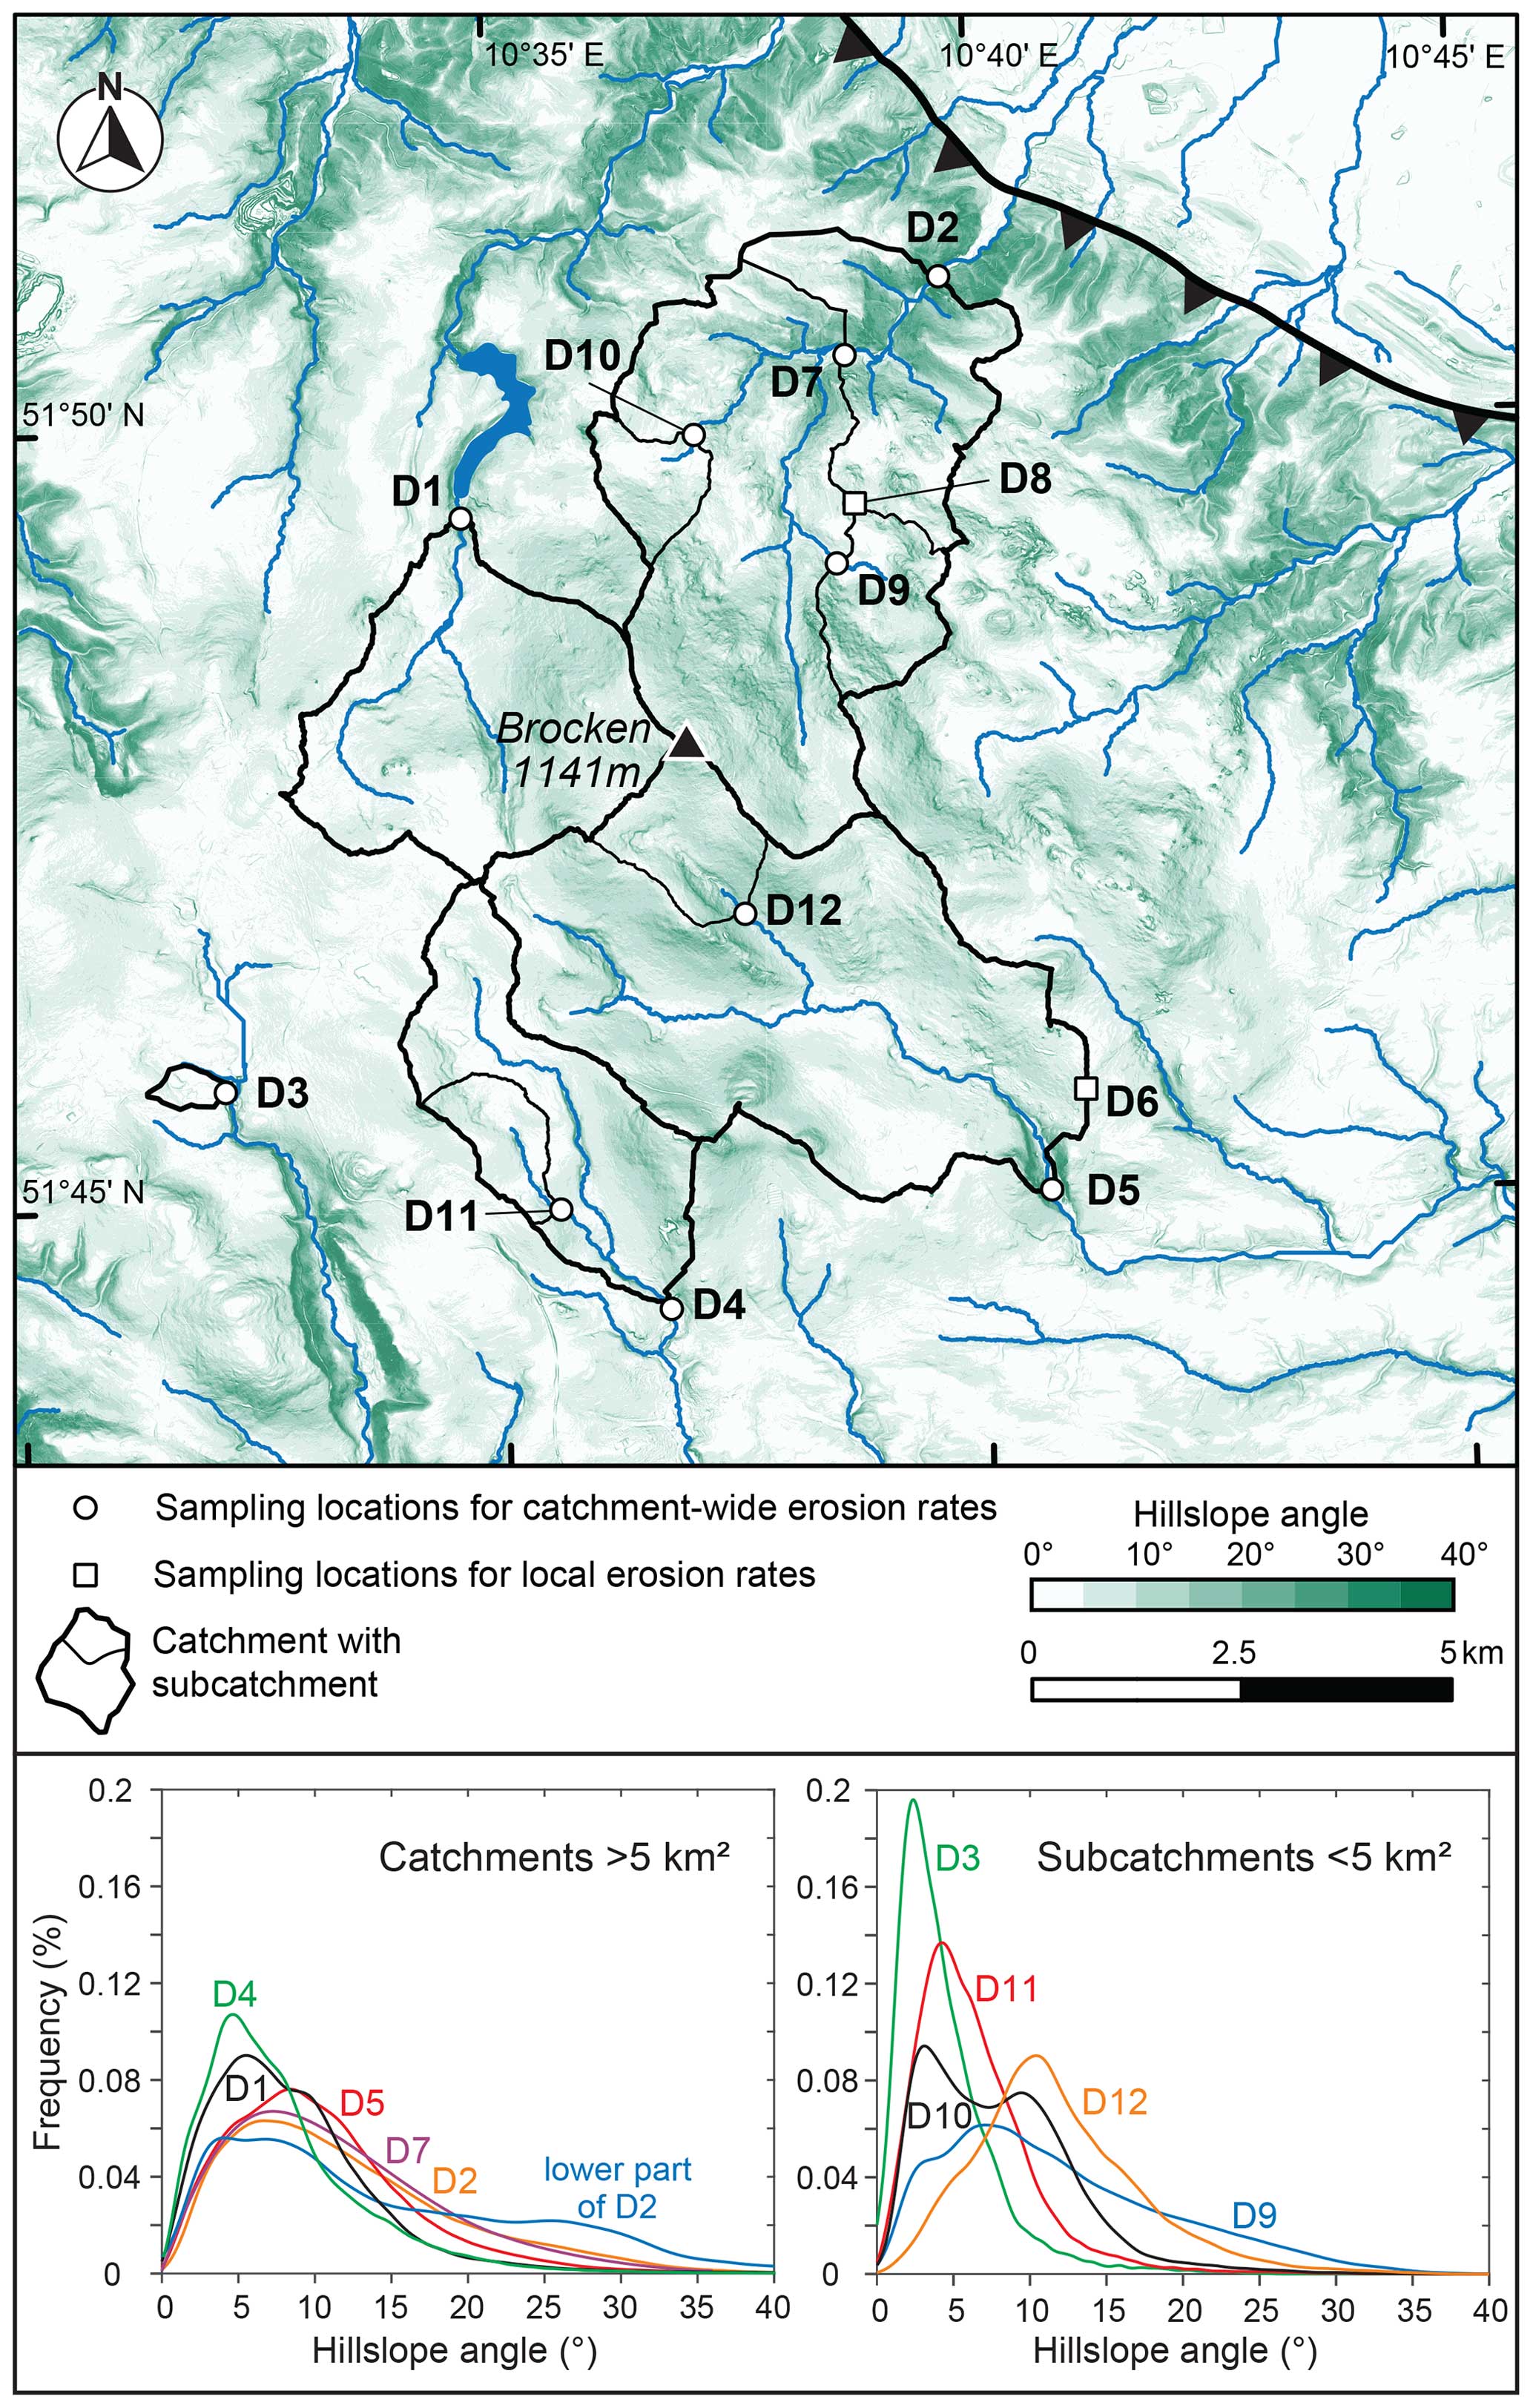
Figure 5Slope map of the study area with the position of the samples and their respective catchment areas. The two lower diagrams show the slope–frequency distribution for catchments larger and smaller than 5 km2, respectively. The lower part of D2 refers to the northern, deeply incised part of the Ilse catchment (i.e. downstream of sample D7; see Fig. 3).
5.1 Factors controlling rates of erosion in the Brocken pluton
The new catchment-wide erosion rates presented in this study – derived from 10Be concentrations of stream-sediment samples collected in the summit region of the Harz Mountains – range from 24 to 45 mm kyr−1 and integrate over the past 13–25 kyr (Table 2). As the studied catchments are entirely located within the Permian Brocken granite (Fig. 1), the assumption of a homogeneous distribution of quartz in the eroding bedrock (see von Blanckenburg, 2006; Carretier et al., 2015) is well justified. Owing to the uniform bedrock lithology, spatial variations in rock strength and susceptibility to weathering are unlikely to play a significant role in controlling the spatial variability of the calculated 10Be erosion rates (see Palumbo et al., 2010; Scharf et al., 2013).
The observation that the erosion rates of catchments larger than 5 km2 show a good correlation with their mean hillslope angle (r2 = 0.87; Fig. 6) suggests that hillslope steepness exerts an important control on local erosion, as has also been observed by similar studies elsewhere (e.g. Binnie et al., 2007; Palumbo et al., 2010). Note that the plot shown in Fig. 6 also includes the differential erosion rate of 54.6 ± 3.4 mm kyr−1 for the steep lower part of the Ilse catchment, which we determined using an approach of Vance et al. (2003). For (sub)catchments with an area of less than 5 km2, the variability in the measured erosion rates is rather small (grey symbols in Fig. 6). Still, the two catchments with the lowest mean slope angles of all catchments (21D3 = 4.4° and 21D11 = 6.3°; Table 2) also yielded the lowest erosion rates (i.e. ∼ 24 and ∼ 28 mm kyr−1). The significance of hillslope steepness can also be demonstrated by analysing the slope–frequency distribution within the 10 studied catchments, showing that the catchments with the largest proportion of low slope angles (21D4, 21D1, 21D3, 21D11; see plots in Fig. 5) also yielded the lowest erosion rates (Fig. 6).

Figure 6Catchment-wide erosion rates derived from 10Be concentrations of the stream-sediment samples plotted versus the mean hillslope angles of the investigated catchments. The exponential regression is based only on catchments with an area of > 5 km2 (black data points). The lower part of D2 refers to the northern part of the Ilse catchment, which has a mean slope angle of 13.8°. The catchments smaller than 5 km2 (not used in the regression) are shown with grey symbols.
The two samples from bedrock outcrops gave consistent erosion rates of 19.5 ± 0.8 and 20.9 ± 0.8 mm kyr−1 (Table 2), showing that bare bedrock erodes at a rate which is even lower than that for the catchments with the lowest hillslope angles. This finding corroborates the view that the absence of soil reduces the intensity of physical disintegration and weathering of granitic bedrock compared to those parts of the landscape that are soil-covered (Small et al., 1999; Meyer et al., 2010a).
5.2 Estimates of post-Oligocene uplift and comparison with 10Be erosion rates
Regarding the question of whether the Oligocene low-relief surfaces preserved in the Harz Mountains formed originally as a single erosion surface or instead constitute several distinct erosion levels that record potential uplift events (e.g. Hövermann, 1950; Thiem, 1974), we emphasize that recent results by Diercks et al. (2021), who undertook a detailed morphometric analysis of the Harz topography, provide strong evidence for only one major erosion level; therefore, all observed palaeo-surface remnants can be linked to the same uplift event. Our data support this view and provide additional evidence for their interpretation that minor elevation differences between these surface remnants are best explained by the occurrence of more or less competent rock lithologies, which erode at slightly different rates. For example, quartzites and plutonic rocks such as the Brocken granite are expected to erode at lower rates than weak slates or sandstones – an inference which could be tested by further 10Be studies. Finally, we argue that the major part of the Brocken granite escaped erosional planation during the formation of the low-relief surface, which ended in the Oligocene (König et al., 2011). Therefore, the summit area of the Brocken, which rises a few hundred metres above the low-relief surface (Fig. 2), represents a relict landscape that has been inherited from before the time when the low-relief surface was generated.
The elevated position of the low-relief surface in the Harz Mountains relative to the surrounding regions (Fig. 2b) has generally been interpreted as result of post-Oligocene uplift; however, widely different opinions still exist on the amount and timing of mountain uplift (e.g. Thiem, 1974; König and Blumenstengel, 2005; König et al., 2011; Diercks et al., 2021). For example, based on geomorphological and geological investigations, Thiem (1974) argued for a total amount of 300–400 m of uplift of the western Harz since the Early Miocene and concluded that uplift must have ended before the Elsterian glaciation during Marine Isotope Stage 12 (ca. 480–420 ka; Lauer and Weiss, 2018), because an early Elsterian pediment surface extends across the Harz Northern Boundary Fault without being deformed. Likewise, river terraces which formed after the Elsterian glaciation have not been deformed by the Harz Northern Boundary Fault (Thiem, 1972).
For the central Harz, König and Blumenstengel (2005) proposed ∼ 300 m of post-Rupelian uplift by correlating marine sediments of Rupelian (early Oligocene) age, which are preserved in uplifted karst caves of the Elbingerode Complex, with coastal marine sediments of the same age exposed in the northern foreland of the Harz between Blankenburg and Thale (see Fig. 2 for location of these towns). However, they did not specify the timing of uplift in any detail. Subsequently, König et al. (2011) related the development of karst forms in the subsurface of the Elbingerode Complex to the incision history of the river Bode (see Fig. 1 for location) and suggested that the uplift of the central Harz occurred mainly during the Late Pliocene and Quaternary.
The most recent study by Diercks et al. (2021) inferred a tectonic uplift of the Harz of only 80–90 m, based on the presence of an upper knickzone in the stream profile of the river Bode southwest of Thale (Fig. 1). They suggested that the uplift was associated with the Elsterian glaciation and proposed that loading of the northern Harz foreland by the Elsterian ice sheet led to the reactivation of vertical fault structures along which the entire Harz Mountains were uplifted. They also proposed that a lower and younger knickzone along the Bode river provides evidence for a substantial amount of erosion (i.e. 100–150 m) of relatively weak Mesozoic sediments from across the entire Subhercynian Basin over a relatively short period of time since the termination of the Saale glaciation (i.e. between ∼ 140 ka and the present; Diercks et al., 2021). Thus, they concluded that tectonic uplift only accounts for a fraction of the overall altitudinal difference of 300 m between the central Harz plateau and the northern Harz foreland (Fig. 2), with widespread erosion of the Subhercynian basin being the more dominant factor.
In the following, we estimate rates of uplift implied by the different models summarized above and evaluate the plausibility of these uplift rates considering our 10Be erosion rates. For an uplift of 300–400 m since 20 Ma (i.e. Early Miocene), as proposed by Thiem (1974), an average uplift rate of 15–20 m Myr−1 (i.e. 15–20 mm kyr−1) is required. Given that this estimate is lower than our catchment-wide 10Be erosion rates, we argue that in this scenario with comparatively low uplift rates it would be impossible to generate a significant post-Oligocene relief uplift in the Harz area, because at these rates any evolving mountainous topography would be removed by erosion. This argument assumes that our reconstructed 10Be erosion rates, which integrate over the Late Pleistocene and Holocene (Table 2), are representative of the Quaternary and Neogene periods as well. Given that the climate in the Quaternary was characterized by repeated glacial–interglacial cycles and that most of our erosion rates integrate over the time from the Last Glacial Maximum to the present day (i.e. over most of the last climate cycle), this assumption may hold for the Quaternary. However, if the investigated catchments eroded more rapidly during the last glaciation due to periglacial conditions or the presence of glaciers, the assumptions of uniform erosion and a steady state between 10Be generation and outflux via erosion and decay would be violated. In that case, our erosion rates would be somewhat overestimated, as indicated by numerical simulations that model temporal changes in erosion rate and their effect on cosmogenic-nuclide inventories (e.g. von Blanckenburg, 2006; Glotzbach et al., 2014). Given that our 10Be erosion rates are similar to or lower than 10Be erosion rates determined for other, unglaciated regions in Germany and Europe (e.g. Schaller et al., 2001; Meyer et al., 2010b; Schaller et al., 2016), we argue that a potential overestimation is small. Extrapolation of erosion rates further back in time (i.e. to the Neogene) is more uncertain, because the Neogene period was characterized by a warmer climate with only minor climate fluctuations (e.g. Zachos et al., 2001).
Assuming an amount of 300 m of uplift since the Late Pliocene (i.e. during the past ∼ 3.5 Ma), as proposed by König and Blumenstengel (2005) and König et al. (2011), we derive an average uplift rate of ∼ 86 mm kyr−1. Moreover, if the uplift stopped ∼ 0.5 Ma (i.e. before the Elsterian glaciation, as argued by Thiem, 1974), the resulting uplift rate would be ∼ 100 mm kyr−1. Given that both estimates exceed our catchment-wide 10Be erosion rates by a factor of 2–4, the amount and timing of uplift provided in the model by König et al. (2011) would be compatible with the generation of significant relief in the Harz during the Pliocene and Quaternary periods, despite the continued removal of surface material by erosion in the Harz Mountains at rates derived in this study.
In contrast, a model of neotectonic uplift totalling up to 90 m triggered by glacial isostatic adjustment to the Elsterian glaciation (i.e. within a relatively short period of only 60–100 kyr) was proposed by Diercks et al. (2021). Such values would imply very high Middle Pleistocene uplift rates of 900–1500 mm kyr−1, which we consider to be unrealistic, because rock-uplift rates of this magnitude occur only in tectonically very active regions such as New Zealand (e.g. Tippett and Kamp, 1995; Houlié and Stern, 2012) or the margins of the Tibetan Plateau (e.g. Hetzel, 2013; Godard et al., 2014). This notwithstanding, mountain uplift according to Diercks et al. (2021) was caused by crustal loading of the northern Harz foreland by the Elsterian ice sheet and the resulting reactivation of vertical structures along the northern and southern boundaries of the Harz Mountains (see Diercks et al., 2021, their Fig. 9). However, we note that such inherited structures are not known to exist along the southern Harz boundary, as also stated by Diercks et al. (2021) themselves. In addition, the Harz Northern Boundary Fault is not a vertical structure but actually dips at an angle of 50–60° to the SSW (Krawczyk and Stiller, 1999; Tanner and Krawczyk, 2017). Furthermore, Diercks et al. (2021) did not elaborate on physical arguments or present a numerical model to support their proposed mechanism; thus, the postulated uplift of the Harz due to foreland loading by the Elsterian ice sheet remains highly speculative. In this context, we note that finite-element models containing discrete fault planes with a Mohr–Coulomb rheology were used previously to investigate the slip behaviour of faults during ice-cap growth and subsequent melting (e.g. Turpeinen et al., 2008; Hampel et al., 2009, 2010). Thus, any argument of glacial foreland loading as a trigger for rapid Middle Pleistocene uplift requires careful consideration of crustal conditions and the Elsterian ice sheet configuration, including ice thickness and gradient. Although reliable reconstructions of the thickness of the former Elsterian ice sheet in the study area are lacking, we can base a reasonable estimate on the altitude of Elsterian deposits in the eastern Harz (i.e. Feuersteinlinie at ca. 470 m a.s.l. near Ramberg). With an ice sheet surface slope of ca. 2° for a terminal ice sheet region based on modern ice sheet analogues (Yi et al., 2005), we obtain a palaeo-ice sheet surface gradient of ca. 35 m km−1. Taking into account the altitude of the Subhercynian Basin (i.e. the base level of the ice sheet), we find that the thickness of the Elsterian ice sheet in the Subhercynian Basin at a distance of 10–15 km from the Harz Mountain front is unlikely to have exceeded 600–800 m at any time during the Elsterian glaciation. To evaluate whether glacial loading (and/or subsequent unloading) by an ice sheet of this thickness can provide a feasible mechanism potentially explaining the uplift of the Harz Mountains by slip along pre-existing structures, a numerical modelling approach should be pursued.
All studies on the Harz Mountains cited above have explicitly (or implicitly) related the post-Oligocene uplift of the Harz to a renewed phase of tectonic activity of the Harz Northern Boundary Fault (and hence to reverse faulting). In the following, we review the published literature to evaluate whether reverse faulting is still ongoing or not.
5.3 Are the Harz Mountains still uplifted by reverse slip on the Harz Northern Boundary Fault?
A seismological hazard assessment for northern Germany has argued that the Harz Mountains are part of a low-seismicity region and lack evidence for Quaternary displacements along existing faults (Leydecker and Kopera, 1999). In contrast, a subsequent study by Kaiser et al. (2005) applied thin-shell finite-element modelling to estimate the slip rates of about 20 faults in the Central European Basin, which were considered to be active. In their Table 1, Kaiser et al. (2005) describe the Harz Northern Boundary Fault as a reverse fault and report a modelled present-day slip rate of 0.08 mm yr−1 for the fault. However, inspection of their model results reveals that the fault is not active as a reverse fault but as a dextral strike-slip fault (see Figs. 7 and 8 in Kaiser et al., 2005). More importantly, the velocity boundary condition of 1–2 mm north–south shortening per year, which Kaiser et al. (2005) applied in their numerical model, overestimates the current shortening rate between the Alps and south Scandinavia significantly. A recent analysis of GPS data has shown that north–south shortening in this region is negligible (Piña-Valdés et al., 2022). As a consequence, the fault-slip rates reported by Kaiser et al. (2005) should be considered overestimates, and it may well be that some of the modelled faults, including the Harz Northern Boundary Fault, are not tectonically active at all.
The issue of whether the Harz experienced neotectonic uplift has also been addressed by studying terrace profiles along river valleys emanating from the Harz Mountains. Generally, three sets of regional terrace levels can be differentiated in the northern Harz foreland based on their relative position above the modern floodplain and the distinct petrographic clast composition of the respective terrace deposits. Of these, the highest and oldest terrace system is located 35–70 m above the modern river level and has been associated with Middle Pleistocene aggradation during pre-Elsterian or early Elsterian times (Weymann et al., 2005). A second flight of terraces, which, in contrast to the higher terrace deposits, also contains nordic clast components, is found 15–20 m above the river and formed during the early part of the Saalian glaciation (Drenthe). Finally, a lower terrace system, associated with the Weichselian cold stage, is located approximately 1 m above the modern floodplain (Weymann et al., 2005).
These terrace remnants have been used for nearly a century to construct and evaluate palaeo-valley long profiles in order to identify evidence for or against neotectonic movements along the northern margin of the Harz and its foreland (Weissermel et al., 1932; Hövermann, 1950; Lüttig, 1955; Thiem, 1972; Bombien, 1987; Jordan, 1995; Weymann et al., 2005). Unfortunately, no consensus has been reached on this matter because issues related to the effects of local salt tectonics and/or subrosion as well as difficulties in linking terrace fragments over longer distances for palaeo-profile reconstructions have complicated the analysis.
To the best of our knowledge, the only field evidence for late Quaternary faulting at the northern margin of the Harz Mountains was presented by Franzke et al. (2015). About 1 km SSE of the village of Benzingerode (Fig. 2a), they discovered a steeply dipping fault (105/75 NNE) in a karst sinkhole ∼ 30 m north of the Harz boundary fault. The fault offsets a debris-flow deposit with angular clasts of Palaeozoic rocks by at least 1 m and is sealed by a younger debris flow containing gypsum fragments (Franzke et al., 2015). Two different striations occur on the fault plane. A well-developed striation plunges to the east (80/56), and kinematic indicators and the apparent offset observed in the sinkhole indicate normal faulting with a dextral strike-slip component (Franzke et al., 2015). The less well-developed second striation plunges gently to the WNW (300/35) and is related to dextral strike-slip faulting with a minor component of reverse faulting. Faulting was inferred to be Late Pleistocene to Early Holocene in age (Franzke et al., 2015), and this timing is supported by two optically stimulated luminescence (OSL) ages of 15–14 ka obtained from one sample taken from the offset debris flow (Müller et al., 2020). Although the observations by Franzke et al. (2015) clearly indicate local faulting in the footwall of the Harz Northern Boundary Fault, the northward dip of the fault plane and the evidence for normal and dextral strike-slip faulting (with only a minor component of reverse faulting) are inconsistent with a reactivation of the Harz Northern Boundary Fault as a reverse fault. As suggested by Müller et al. (2020), the local faulting may have been caused by stress changes triggered by the retreat of the Late Pleistocene (Weichselian) ice sheet. In summary, none of the studies cited above provides convincing evidence for significant ongoing or recent uplift of the Harz Mountains by reverse faulting, and this interpretation is supported by the lack of elastic strain accumulation in northern Germany, as documented by the recent analysis of GPS data across Europe (Piña-Valdés et al., 2022).
5.4 Lowering of the areas around the Harz by erosion, subrosion, and migration of salt
A completely different mechanism that may have contributed to the elevated position of the low-relief surface in the Harz Mountains relative to its foreland is the erosion and thereby lowering of regions surrounding the Harz. Indeed, Diercks et al. (2021) suggested that the lower knickzone in the Bode valley was produced by the rapid erosion of 100–150 m of relatively weak Mesozoic and younger sedimentary rocks from the Subhercynian Basin after the Saalian glaciation (i.e. after ∼ 140 ka), causing significant relative foreland lowering over a short period of time, implying very high area-wide erosion rates of 700–1100 mm kyr−1. We consider this scenario to be inconsistent with field evidence, because the Subhercynian Basin preserves extensive Middle Pleistocene glacial cover sediments of Saalian and Elsterian age, which should not be the case if the basin had experienced erosion of the order of 100–150 m in post-Saalian times.
Although we consider a model of surface lowering of the Subherzynian Basin of 100–150 m over the past 140 kyr (Diercks et al., 2021) as unrealistic, it is reasonable to assume that a far smaller portion of the apparent post-Oligocene uplift may in fact reflect a moderate lowering of the landscape around the Harz by erosion. For example, if we assume that the low-relief bedrock surface in the Harz erodes at rates of about 20–30 mm kyr−1 (as indicated by our 10Be data), erosion of the surrounding regions at slightly higher rates of 40–50 mm kyr−1 would generate an elevation difference of about 20 m in 1 million years. Hence, differential erosion in the last few million years may have caused an elevation difference of several tens of metres between the Harz and its surroundings. A differential erosion between the Harz Mountains and regions farther south and southwest is also indicated on a longer timescale by the spatial distribution of AFT and AHe ages (von Eynatten et al., 2019, 2021). In the Weser–Fulda–Werra region (southwest of the Harz), AFT ages are 10–20 Ma younger than in the Harz Mountains, and thermal modelling of these data indicates that the Harz was exhumed earlier than the Weser–Fulda–Werra region, where 3–4 km of Mesozoic strata have been eroded between ∼ 75 and ∼ 55 Ma (von Eynatten et al., 2021; their Figs. 8a and 9). For the Mesozoic sediments, these values suggest a long-term erosion rate of 150–200 m Myr−1 in the Late Cretaceous and the Palaeocene.
Two other processes that may have caused surface lowering of regions surrounding the Harz include the subrosion and lateral migration of widespread Permian salt into diapirs and salt anticlines in the regions to the north and south of the Harz (Paul, 2019). The presence of many sinkholes, clearly visible in high-resolution DEMs (e.g. Müller et al., 2020) and in the field (Franzke et al., 2015), is evidence for the ongoing dissolution of the steeply dipping Permian sulfate rocks along the northern margin of the Harz. Paul (2019) goes as far as to suggest that tectonic uplift of the Harz during the late Tertiary and the Quaternary can be neglected as a process altogether and that regional subsidence of the foreland due to regional-scale subrosion and salt migration may account for 200–300 m of relative altitudinal change between the Harz and its forelands during this time. We would like to point out that under a scenario of substantial foreland subsidence since the late Tertiary, we would expect the Subherzynian Basin to have formed a major depositional trough since the late Tertiary. However, this appears to be inconsistent with the widespread lack of Tertiary deposits in the Subherzynian Basin, where Mesozoic sequences occur either at the surface or under Quaternary cover sediments, which suggests that the late Tertiary was predominantly a period of surface erosion.
This paper presents the first catchment-wide 10Be-based erosion rates for the Harz Mountains to improve our understanding of local Quaternary landscape dynamics under changing tectonic and climatic boundary conditions. Our findings, derived from stream-sediment samples of granitic catchments draining the highest portion of the Harz Mountains (Brocken peak, 1141 m a.s.l.), show that the tested catchments erode at rates between 24 ± 2 and 55 ± 3 mm kyr−1, integrated over the past 13–25 kyr. The spatial distribution of our 10Be data indicates that slope steepness exerts a major control on the magnitude of local erosion, with catchments characterized by steeper slopes (i.e. 20 to 35°) eroding at higher rates between 30 and 55 mm kyr−1, while areas within the prominent low-relief surfaces of the Harz (slope angles < 10°) erode at lower rates of 24–30 mm kyr−1. The lowest erosion rates were obtained from granitic bedrock tors near the summit region of the Brocken (19–21 mm kyr−1), demonstrating that the physical and chemical disintegration of bare rock surfaces occurs at even lower rates than those recorded for low-relief but soil-covered parts of the landscape.
Based on our new 10Be erosion rates and our assessment of previously proposed models for the evolution of the Harz topography, we argue that the post-Oligocene elevation difference of ∼ 300 m between the low-relief bedrock surface in the Harz Mountains and the surrounding lowlands is the result of at least three distinct processes: (1) mountain uplift due to a potential reactivation of the range-bounding reverse fault during the Neogene and Quaternary until ∼ 0.5 Ma; (2) widespread erosion of weak sedimentary rocks in the regions adjacent to the Harz; and (3) dissolution and lateral migration of Permian salt at depth, which led to surface lowering in the vicinity of the Harz Mountains.
The erosion rates given in Table 2 were calculated with the CRONUS-Earth online calculator (Balco et al., 2008), which is freely available at http://hess.ess.washington.edu (last access: 29 September 2024).
All data from which the 10Be erosion rates were calculated are provided in Tables 1 and 2.
The study was designed by RH and HR. Conceptualization, supervision, and project administration were done by RH and HR. Analytical methods were applied by KH, RW, and RH. Formal data analysis and visualization were done by RW and RH. The first draft was written by RH, HR, and RW. Manuscript editing during the revision was done by RH and RW.
The contact author has declared that none of the authors has any competing interests.
Publisher’s note: Copernicus Publications remains neutral with regard to jurisdictional claims made in the text, published maps, institutional affiliations, or any other geographical representation in this paper. While Copernicus Publications makes every effort to include appropriate place names, the final responsibility lies with the authors.
We are grateful to Friedhart Knolle from the Harz National Park for his help in obtaining the permission to collect the samples used in this study. We thank Jana Klisiewicz for her help during fieldwork and sample preparation. The digital elevation model of the study area was kindly provided by the Landesamt für Geologie und Bergwesen Sachsen-Anhalt (LAGB). We thank the associate editor Zsófia Ruszkiczay-Rüdiger, Hilmar von Eynatten, and an anonymous reviewer for their constructive comments on the manuscript.
This open-access publication was funded by the University of Münster.
This paper was edited by Zsófia Ruszkiczay-Rüdiger and reviewed by Hilmar von Eynatten and one anonymous referee.
Ahnert, F.: Functional relationship between denudation, relief, and uplift in large mid-latitude drainage basins, Am. J. Sci., 268, 243–263, https://doi.org/10.2475/ajs.268.3.243, 1970.
Balco, G.: Production rate calculations for cosmic-ray-muon-produced 10Be and 26Al benchmarked against geological calibration data, Quat. Geochronol., 39, 150–173, https://doi.org/10.1016/j.quageo.2017.02.001, 2017.
Balco, G., Stone, J. O., Lifton, N. A., and Dunai, T. J.: A complete and easily accessible means of calculating surface exposure ages or erosion rates from 10Be and 26Al measurements, Quat. Geochronol., 3, 174–195, https://doi.org/10.1016/j.quageo.2007.12.001, 2008 (code available at: http://hess.ess.washington.edu, last access: 29 September 2024).
Benda, L. and Dunne, T.: Stochastic forcing of sediment supply to channel networks from landsliding and debris flows, Water Resour. Res., 33, 2849–2863, https://doi.org/10.1029/97WR02388, 1997.
Binnie, S. A., Phillips, W. M., Summerfield, M. A., and Fifield, L. K.: Tectonic uplift, threshold hillslopes, and denudation rates in a developing mountain range, Geology, 35, 743–746, https://doi.org/10.1130/G23641A.1, 2007.
Binnie, S. A., Dewald, A., Heinze, S., Voronina, E., Hein, A., Wittman, H., von Blanckenburg, F., Hetzel, R., Christl, M., Schaller, M., Léanni, L., ASTER Team, Hippe, K., Vockenhuber, C., Ivy-Ochs, S., Maden, C., Fülöp, R.-H., Fink, D., Wilcken, K. M., Fujioka, T., and Dunai, T. J.: Preliminary results of CoQtz-N: A quartz reference material for terrestrial in-situ cosmogenic 10Be and 26Al measurements, Nucl. Instrum. Meth. B, 456, 203–212, https://doi.org/10.1016/j.nimb.2019.04.073, 2019.
Bombien, H.: Geologisch-petrographische Untersuchungen zur quartären (früh-Saale-zeitlichen) Flussgeschichte im nördlichen Harzvorland, Mitteilungen aus dem Geologischen Institut der Universität Hannover, 26, 131 pp., 1987.
Borchers, B., Marrero, S., Balco, G., Caffee, M., Goehring, B., Lifton, N., Nishiizumi, K., Phillips, F., Schaefer, J., and Stone, J.: Geological calibration of spallation production rates in the CRONUS-Earth project, Quat. Geochronol., 31, 188–198, https://doi.org/10.1016/j.quageo.2015.01.009, 2016.
Braucher, R., Merchel, S., Borgomano, J., and Bourlès, D. L.: Production of cosmogenic radionuclides at great depth: A multi element approach, Earth Planet. Sci. Lett., 309, 1–9, https://doi.org/10.1016/j.epsl.2011.06.036, 2011.
Brown, E. T., Stallard, R. F., Larsen, M. C., Raisbeck, G. M., and Yiou, F.: Denudation rates determined from the accumulation of in situ-produced 10Be in the Luquillo Experimental Forest, Puerto Rico, Earth Planet. Sci. Lett., 129, 193–202, https://doi.org/10.1016/0012-821X(94)00249-X, 1995.
Carretier, S, Regard, V., Vassallo. R., Martinod, J., Christophoul, F., Gayer, E., Audin, L., and, Lagane C.: A note on 10Be-derived mean erosion rates in catchments with heterogeneous lithology: examples from the western Central Andes, Earth Surf. Proc. Land. 40, 1719–1729, https://doi.org/10.1002/esp.3748, 2015.
DEKORP-BASIN Research Group: Deep crustal structure of the Northeast German basin: New DEKORP-BASIN'96 Deep-Profiling Results, Geology, 27, 55–58, https://doi.org/10.1130/0091-7613(1999)027<0055:DCSOTN>2.3.CO;2, 1999.
Delunel, R., Schlunegger, F., Valla, P. G., Dixon, J., Glotzbach, C., Hippe, K., Kober, F., Molliex, S., Norton, K. P., Salcher, B., Wittmann, H., Akçar, N., and Christl, M.: Late-Pleistocene catchment-wide denudation patterns across the European Alps, Earth-Sci. Rev., 211, 103407, https://doi.org/10.1016/j.earscirev.2020.103407, 2020.
Dewald, A., Heinze, S., Jolie, J., Zilges, A., Dunai, T., Rethemeyer, J., Melles, M., Staubwasser, M., Kuczewski, B., Richter, J., Radtke, U., von Blanckenburg, F., and Klein, M.: CologneAMS, a dedicated center for accelerator mass spectrometry in Germany, Nucl. Instrum. Meth. B, 294, 18–23, https://doi.org/10.1016/j.nimb.2012.04.030, 2013.
DiBiase, R. A., Whipple, K. X., Heimsath, A. M., and Ouimet, W. B.: Landscape form and millennial erosion rates in the San Gabriel Mountains, CA, Earth Planet. Sci. Lett., 289, 134–144, https://doi.org/10.1016/j.epsl.2009.10.036, 2010.
Dielforder, A., Frasca, G., Brune, S., and Ford, M.: Formation of the Iberian-European convergent plate boundary fault and its effect on intraplate deformation in Central Europe, Geochem. Geophy. Geosy., 20, 2395–2417, https://doi.org/10.1029/2018GC007840, 2019.
Diercks, M.-L., Stanek, K., Domiìnguez-Gonzalez, L., and Ehling, B.: Quaternary landscape evolution and tectonics in Central Germany – A case study of the Harz, Geomorphology, 388, 107794, https://doi.org/10.1016/j.geomorph.2021.107794, 2021.
Dunai, T. J. (Eds.): Cosmogenic nuclides – Principles, Concepts and Applications in the Earth Surface Sciences, Cambridge University Press, 187 pp., ISBN 9781108445726, 2010.
Duphorn, K.: Ist der Oberharz im Pleistozän vergletschert gewesen?, Eiszeitalter und Gegenwart, 19, 164–174, 1968.
Ehlers, J., Grube, A., Stephan, H. J., and Wansa, S.: Chapter 13 - Pleistocene glaciations of North Germany - new results, in: Quaternary Glaciations – Extent and Chronology: A Closer Look, edited by: Ehlers, J., Gibbard, P. L., and Hughes, P. D., Developments in Quaternary Sciences, 15, 149–162, https://doi.org/10.1016/B978-0-444-53447-7.00013-1, 2011.
Eissmann, L.: Quaternary geology of eastern Germany (Saxony, Saxon–Anhalt, South Brandenburg, Thuringia), type area of the Elsterian and Saalian Stages in Europe, Quaternary Sci. Rev., 21, 1275–1346, 2002.
Feldmann, L.: Das Quartär zwischen Harz und Allertal mit einem Beitrag zur Landschaftsgeschichte im Tertiär, Clausthaler Geowissenschaften, 1, 1–149, 2002.
Franke, W.: Variscan plate tectonics in Central Europe – current ideas and open questions, Tectonophysics, 169, 221–228, https://doi.org/10.1016/0040-1951(89)90088-7, 1989.
Franzke, H.-J., Voigt, T., von Eynatten, H., Brix, M. R., and Burmester, G.: Geometrie und Kinematik der Harznordrandstörung, erläutert an Profilen aus dem Gebiet von Blankenburg, Geowiss. Mitt. Thüringen, 11, 39–62, 2004.
Franzke, H. J., Hauschke, N., and Hellmund, M.: Spätpleistozäne bis frühholozäne Tektonik in einem Karsttrichter im Bereich der Störungszone des Harznordrandes nahe Benzingerode (Sachsen-Anhalt), Hallesches Jahrbuch für Geowissenschaften, 37, 1–10, https://doi.org/10.25673/91889, 2015.
Frebold, G.: Die Oberflächengestaltung des Brockengebietes, Jahrbuch der Geographischen Gesellschaft zu Hannover, 1932/33, 89–120, 1933.
Fuller, C. W., Willett, S. D., Hovius, N., and Slingerland, R.: Erosion rates for Taiwan mountain basins: new determinations from suspended sediment records and a stochastic model of their temporal variation, J. Geol., 111, 71–87, https://doi.org/10.1086/344665, 2003.
Gilbert, G. K.: Report on the geology of the Henry Mountains, U.S. Geographical and Geological Survey of the Rocky Mountain Region, Government Printing Office, Washington, https://doi.org/10.3133/70039916, 1877.
Glotzbach, C., Röttjer, M., Hampel, A., Hetzel, R., and Kubik, P. W.: Quantifying the impact of former glaciation on catchment-wide denudation rates derived from cosmogenic 10Be, Terra Nova, 26, 186–194, https://doi.org/10.1111/ter.12085, 2014.
Godard, V., Bourlès, D. L., Spinabella, F., Burbank, D. W., Bookhagen, B., Fisher, G. B., Moulin, A., and Léanni, L.: Dominance of tectonics over climate in Himalayan denudation, Geology, 42, 243–246, 2014.
Goethals, M. M., Hetzel, R., Niedermann, S., Wittmann, H., Fenton, C. R., Kubik, P. W., Christl, M., and von Blanckenburg, F.: An improved experimental determination of cosmogenic 10Be/21Ne and 26Al/21Ne production ratios in quartz, Earth Planet. Sci. Lett., 284, 187–198, https://doi.org/10.1016/j.epsl.2009.04.027, 2009.
Granger, D. E., Kirchner, J. W., and Finkel, R.: Spatially averaged long-term erosion rates measured from in situ produced cosmogenic nuclides in alluvial sediment, J. Geol., 104, 249–257, https://doi.org/10.1086/629823, 1996.
Hampel, A., Hetzel, R., Maniatis, G., and Karow, T.: Three-dimensional numerical modeling of slip rate variations on normal and thrust fault arrays during ice cap growth and melting, J. Geophys. Res., 114, B08406, https://doi.org/10.1029/2008JB006113, 2009.
Hampel, A., Hetzel, R., and Maniatis, G.: Response of faults to climate-driven changes in ice and water volumes on Earth's surface, Philos. T. Roy. Soc. A, 368, 2501–2517, https://doi.org/10.1098/rsta.2010.0031, 2010.
Hancock, G. and Kirwan, M.: Summit erosion rates deduced from 10Be: Implications for relief production in the central Appalachians, Geology, 35, 89–92, https://doi.org/10.1130/G23147A.1, 2007.
Heineke, C., Hetzel, R., Nilius, N.-P., Glotzbach, C., Akal, C., Christl, M., and Hampel, A.: Spatial patterns of erosion and landscape evolution in a bivergent metamorphic core complex revealed by cosmogenic 10Be: The central Menderes Massif (western Turkey), Geosphere, 15, 1846–1868, https://doi.org/10.1130/GES02013.1, 2019.
Hetzel, R.: Active faulting, mountain growth, and erosion at the margins of the Tibetan Plateau constrained by in situ-produced cosmogenic nuclides, Tectonophysics, 582, 1–24, https://doi.org/10.1016/j.tecto.2012.10.027, 2013.
Hinze, C., Jordan, H., Knoth, W., Kriebel, U., and Martiklos, G.: Geologische Karte Harz 1: 100 000, Landesamt für Geologie und Bergwesen Sachsen-Anhalt, 1998.
Hövermann, J.: Die diluvialen Terrassen des Oberharzes und seines Vorlandes - Ein Beitrag zur Frage der Harzhebung, Petermann. Geogr. Mitt., 94, 121–130, 1950.
Houlié, N. and Stern, T.: A comparison of GPS solutions for strain and SKS fast directions: Implications for modes of shear in the mantle of a plate boundary zone, Earth Planet. Sci. Lett., 345–348, 117–125, https://doi.org/10.1016/j.epsl.2012.06.029, 2012.
Jankowski, G.: Die Tertiärbecken des südlichen Harzvorlandes und ihre Beziehungen zur Subrosion, Geologie, Beiheft, 43, 1–64, 1964.
Jordan, H.: Quartäre Tektonik und Gipskarst am Südharz, Niedersachsen, Beiträge zur Geologie von Thüringen, Neue Folge, 2, 75–96, 1995.
Kaiser, A., Reicherter, K., Hübscher, C., and Gajewski, D.: Variation of the present-day stress field within the North German Basin insights - from thin shell FE modeling based on residual GPS velocities, Tectonophysics, 397, 55–72, https://doi.org/10.1016/j.tecto.2004.10.009, 2005.
Kirchner, J. W., Finkel, R. C., Riebe, C. S., Granger, D. E., Clayton, J. L., King, J. G., and Megahan, W. F.: Mountain erosion over 10 yr, 10 k.y., and 10 m.y. time scales, Geology, 29, 591–594, https://doi.org/10.1130/0091-7613(2001)029<0591:MEOYKY>2.0.CO;2, 2001.
Kley, J. and Voigt, T.: Late Cretaceous intraplate thrusting in Central Europe: Effect of Africa-Iberia-Europe convergence, not Alpine collision, Geology, 36, 839–842, https://doi.org/10.1130/G24930A.1, 2008.
König, W. and Blumenstengel, H.: Die Oligozänvorkommen am Hartenberg und bei Hüttenrode im Mittelharz und ihre Bedeutung für die känozoische Harzentwicklung, Mitteilungen Verband deutscher Höhlen- und Karstforscher, 51, 120–125, 2005.
König, W., Köthe, A., and Ritz, I.: Die marine Beeinflussung der Subherzynen Senke und der Mittelharzhochfläche im Oligozän – Biostratigraphische und sedimentpetrographische Analysen tertiärer Sandvorkommen, Z. Geol. Wissenschaft, 39, 387–431, 2011.
Kohl, C. P. and Nishiizumi, K.: Chemical isolation of quartz for measurement of in-situ-produced cosmogenic nuclides, Geochim. Cosmochim. Ac., 56, 3583–3587, https://doi.org/10.1016/0016-7037(92)90401-4, 1992.
Krawczyk, C. M., Stiller, M., and DEKORP-Basin Research Group: Reflection seismic constraints on Paleozoic crustal structure and Moho beneath the NE German Basin, Tectonophysics, 314, 241–253, https://doi.org/10.1016/S0040-1951(99)00246-2, 1999.
Lal, D.: Cosmic ray labeling of erosion surfaces: in situ nuclide production rates and erosion models, Earth Planet. Sci. Lett., 104, 424–439, https://doi.org/10.1016/0012-821X(91)90220-C, 1991.
Lauer, T. and Weiß, M.: Timing of the Saalian- and Elsterian glacial cycles and the implications for Middle – Pleistocene hominin presence in central Europe, Sci. Rep.-UK, 8, 5111, https://doi.org/10.1038/s41598-018-23541-w, 2018.
Leydecker, G. and Kopera, J. R.: Seismological hazard assessment for a site in Northern Germany, an area of low seismicity, Eng. Geol., 52, 293–304, https://doi.org/10.1016/S0013-7952(99)00012-5, 1999.
Lüttig, G.: Hat sich der Nordwestharz im Postglazial gehoben?, Geologisches Jahrbuch, 70, 405–434, 1955.
Meyer, H., Hetzel, R., Fügenschuh, B., and Strauss, H.: Determining the growth rate of topographic relief using in situ-produced 10Be: A case study in the Black Forest, Germany, Earth Planet. Sci. Lett., 290, 391–402, https://doi.org/10.1016/j.epsl.2009.12.034, 2010a.
Meyer, H., Hetzel, R., and Strauss, H.: Erosion rates on different timescales derived from cosmogenic 10Be and river loads: Implications for landscape evolution in the Rhenish Massif, Germany, Int. J. Earth Sci., 99, 395–412, https://doi.org/10.1007/s00531-008-0388-y, 2010b.
Mücke, E.: Zur Großformung der Hochfläche des östlichen Harzes, Hercynia, 3, 221–244, 1966.
Müller, K., Polom, U., Winsemann, J., Steffen, H., Tsukamoto, S., Günther, T., Igel, J., Spies, T., Lege, T., Frechen, M., Franzke, H. J., and Brandes, C.: Structural style and neotectonic activity along the Harz Boundary Fault, northern Germany: a multimethod approach integrating geophysics, outcrop data and numerical simulations, Int. J. Earth Sci., 109, 1811–1835, https://doi.org/10.1007/s00531-020-01874-0, 2020.
Niedermann, S.: Cosmic-ray-Produced Noble Gases in Terrestrial Rocks: Dating Tools for Surface Processes, Rev. Mineral. Geochem., 47, 731–784, https://doi.org/10.2138/rmg.2002.47.16, 2002.
Palumbo, L., Hetzel, R., Tao, M., and Li, X.: Topographic and lithologic control on catchment-wide denudation rates derived from cosmogenic 10Be in two mountain ranges at the margin of NE Tibet, Geomorphology, 117, 130–142, https://doi.org/10.1016/j.geomorph.2009.11.019, 2010.
Pan, B.-T., Geng, H.-P., Hu, X.-F., Sun, R.-H., and Wang, C.: The topographic controls on the decadal-scale erosion rates in Qilian Shan Mountains, N.W. China, Earth Planet. Sc. Lett., 292, 148–157, https://doi.org/10.1016/j.epsl.2010.01.030, 2010.
Paul, J.: Hat sich der Harz im jüngeren Tertiär und Quartär gehoben?, Zeitschrift der Deutschen Gesellschaft für Geowissenschaften, 170, 95–107, https://doi.org/10.1127/zdgg/2019/0181, 2019.
Penck, W.: Die morphologische Analyse, Ein Kapitel der physikalischen Geologie, Verlag J Engelhorn Nachf, Stuttgart, 283 pp., 1924.
Piña-Valdés, J., Socquet, A., Beauval, C., Doin, M.-P., D'Agostino, N., and Shen, Z.-K.: 3D GNSS velocity field sheds light on the deformation mechanisms in Europe: Effects of the vertical crustal motion on the distribution of seismicity, J. Geophys. Res., 127, e2021JB023451, https://doi.org/10.1029/2021JB023451, 2022.
Pinet, P. and Souriau, M.: Continental erosion and large-scale relief, Tectonics 7, 563–582, https://doi.org/10.1029/TC007i003p00563, 1988.
Philippi, E.: Über die präoligozäne Landoberfläche in Thüringen, Z. Dtsch. Geol. Ges., 62, 305–404, 1910.
Portenga, E. W. and Bierman, P. R.: Understanding Earth's eroding surface with 10Be, GSA Today, 21, 4–10, 2011.
Schaller, M., von Blanckenburg, F., Hovius, N., and Kubik, P.W.: Large-scale erosion rates from in situ-produced cosmogenic nuclides in European river sediments, Earth Planet. Sci. Lett., 188, 441–458, 2001.
Schaller, M., Ehlers, T. A., Stor, T., Torrent, J., Lobato, L., Christl, M., and Vockenhuber, C.: Spatial and temporal variations in denudation rates derived from cosmogenic nuclides in four European fluvial terrace sequences, Geomorphology, 274, 180–192, https://doi.org/10.1016/j.geomorph.2016.08.018, 2016.
Scharf, T. E., Codilean, A. T., de Wit, M., Jansen, J. D., and Kubik, P. W.: Strong rocks sustain ancient postorogenic topography in southern Africa, Geology, 41, 331–334, https://doi.org/10.1130/G33806.1, 2013.
Small, E. E., Anderson, R. S., and Hancock, G. S.: Estimates of the rate of regolith production using 10Be and 26Al from an alpine hillslope, Geomorphology, 27, 131–150, 1999.
Stollhofen, H., Bachmann, G. H., Barnasch, J., Bayer, U., Beutler, G., Franz, M., Kästner, M., Legeler, B., Mutterlose, J., and Radies, D.: Upper Rotliegend to Early Cretaceous basin development, in: Dynamics of Complex Intracontinental Basins. The Central European Basin System, edited by: Littke, R., Bayer, U., Gajewski, D., and Nelskamp, S., Springer, Berlin, Heidelberg, Germany, Chap. 4.3, 181–210, https://doi.org/10.1007/978-3-540-85085-4, 2008.
Stone, J. O.: Air pressure and cosmogenic isotope production, J. Geophys. Res., 105, 23753–23759, https://doi.org/10.1029/2000JB900181, 2000.
Strobl, M., Hetzel, R., Niedermann, S., Ding, L., and Zhang, L.: Landscape evolution of a bedrock peneplain on the southern Tibetan Plateau revealed by in situ-produced cosmogenic 10Be and 21Ne, Geomorphology, 153–154, 192–204, https://doi.org/10.1016/j.geomorph.2012.02.024, 2012.
Summerfield, M. A. and Hulton, N. J.: Natural controls of fluvial denudation rate in major world drainage basins, J. Geophys. Res., 99, 13871–13883, https://doi.org/10.1029/94JB00715, 1994.
Tanner, D. C. and Krawczyk, C. M.: Restoration of the Cretaceous uplift of the Harz Mountains, North Germany: Evidence for the geometry of a thick-skinned thrust, Int. J. Earth Sci., 106, 2963–2972, https://doi.org/10.1007/s00531-017-1475-8, 2017.
Thiem, W.: Geomorphologie des westlichen Harzrandes und seiner Fußregion, Jahrbuch der Geographischen Gesellschaft zu Hannover, Sonderheft, 6, 271 pp., 1972.
Thiem, W.: Neue Aspekte für die Rekonstruktion der Reliefentwicklung des Harzes, Hercynia, 11, 233–260, https://doi.org/10.25673/93855, 1974.
Tippett, J. M. and Kamp, P. J. J.: Geomorphic evolution of the Southern Alps, New Zealand, Earth Surf. Proc. Land., 20, 177–192, 1995.
Turpeinen, H., Hampel, A., Karow, T., and Maniatis, G.: Effect of ice sheet growth and melting on the slip evolution of thrust faults, Earth Planet. Sci. Lett., 269, 230–241, https://doi.org/10.1016/j.epsl.2008.02.017, 2008.
Vance, D., Bickle, M., Ivy-Ochs, S., and Kubik, P. W.: Erosion and exhumation in the Himalaya from cosmogenic isotope inventories of river sediments, Earth Planet. Sc. Lett., 206, 273–288, https://doi.org/10.1016/S0012-821X(02)01102-0, 2003.
Voigt, T., Wiese, F., von Eynatten, H., Franzke, H.-J., and Gaupp, R.: Facies evolution of syntectonic Upper Cretaceous Deposits in the Subhercynian Cretaceous Basin and adjoining areas (Germany), Zeitschrift der Deutschen Gesellschaft für Geowissenschaften, 157, 203–244, https://doi.org/10.1127/1860-1804/2006/0157-0203, 2006.
Voigt, T., Kley, J., and Voigt, S.: Dawn and dusk of Late Cretaceous basin inversion in central Europe, Solid Earth, 12, 1443–1471, https://doi.org/10.5194/se-12-1443-2021, 2021.
von Blanckenburg, F.: The control mechanisms of erosion and weathering at basin scale from cosmogenic nuclides in river sediment, Earth Planet. Sc. Lett., 242, 224–239, https://doi.org/10.1016/j.epsl.2005.11.017, 2006.
von der Sahle, E.: Härtlingszüge. Morphologische Studien aus deutschen Mittelgebirgen, Berliner Geogr. Arb., 21, 1–113, 1942.
von Eynatten, H., Voigt, T., Meier, A., Franzke, H.-J., and Gaupp, R.: Provenance of the clastic Cretaceous Subhercynian Basin fill: constraints to exhumation of the Harz Mountains and the timing of inversion tectonics in the Central European Basin, Int. J. Earth Sci., 97, 1315–1330, https://doi.org/10.1007/s00531-007-0212-0, 2008.
von Eynatten, H., Dunkl, I., Brix, M., Hoffmann, V.-E., Raab, M., Thomson, S. N., and Kohn, B.: Late Cretaceous exhumation and uplift of the Harz Mountains, Germany: a multi-method thermochronological approach, Int. J. Earth Sci., 108, 2097–2111, https://doi.org/10.1007/s00531-019-01751-5, 2019.
von Eynatten, H., Kley, J., Dunkl, I., Hoffmann, V.-E., and Simon, A.: Late Cretaceous to Paleogene exhumation in central Europe – localized inversion vs. large-scale domal uplift, Solid Earth, 12, 935–958, https://doi.org/10.5194/se-12-935-2021, 2021.
Weissermel, W., Grupe, O., Dahlgrün, F., and Schriel, W.: Zum Problem des Harzranddiluviums, Zeitschrift der Deutschen Geologischen Gesellschaft, 84, 173–189, 1932.
Weymann, H.-J., Feldmann, L., and Bombien, H.: Das Pleistozän des nördlichen Harzvorlandes – eine Zusammenfassung, Eiszeitalter und Gegenwart, 55, 43–63, 2005.
Wolff, R., Hetzel, R., and Strobl, M.: Quantifying river incision into low-relief surfaces using local and catchment-wide 10Be denudation rates, Earth Surf. Proc. Land., 43, 2327–2341, https://doi.org/10.1002/esp.4394, 2018.
Yi, D., Jay Zwally, H., and Sun, X.: ICESat measurement of Greenland ice sheet surface slope and roughness, Ann. Glaciol., 42, 83–89, 2005.
Zachos, J., Pagani, M., Sloan, L., Thomas, E., and Billups, K.: Trends, rhythms, and aberrations in global climate 65 Ma to present, Science, 292, 686–693, https://doi.org/10.1126/science.1059412, 2001.
Zech, J., Jeffries, T., Faust, D., Ullrich, B., and Linnemann, U.: U/Pb-dating and geochemical characterization of the Brocken and Ramberg Pluton, Harz Mountains, Germany, Geologica Saxonica, 56, 9–24, 2010.
Ziegler, P. A., Schumacher, M. E., Dèzes, P., Van Wees, J. D., and Cloetingh, S.: Post-Variscan evolution of the lithosphere in the area of the European Cenozoic Rift System, Geological Society, London, Memoirs, 32, 97–112, https://doi.org/10.1144/GSL.MEM.2006.032.01.06, 2006.