the Creative Commons Attribution 4.0 License.
the Creative Commons Attribution 4.0 License.
 | 17 Oct 2025
Luminescence dating of alluvial sediments from the Quaternary fan–terrace sequence of the lower Bruche valley, Upper Rhine Graben, France
Madhurima Marik
Elena Serra
Gilles Rixhon
Frank Preusser
Marik, M., Serra, E., Rixhon, G., and Preusser, F.: Luminescence dating of alluvial sediments from the Quaternary fan–terrace sequence of the lower Bruche valley, Upper Rhine Graben, France, E&G Quaternary Sci. J., 74, 169–192, https://doi.org/10.5194/egqsj-74-169-2025, 2025.
Geochronological constraints on fluvial terraces provide valuable insights into channel migration and adjustment involved within actively meandering river systems. However, numerical age estimation of fluvial deposits using luminescence dating is often challenged by inherent methodological limitations. Pre-depositional partial bleaching of grains can lead to overestimation, while anomalous fading in feldspar grains often results in underestimation of the luminescence ages. The current study applies both optically stimulated luminescence and multi-elevated temperature post-infrared infrared stimulated luminescence dating to fine sand and sandy matrix deposits collected from three distinct fluvial terrace levels across the lower reach of the Bruche River, in the Upper Rhine Graben (URG, north-eastern France). To evaluate the extent of partial bleaching, modern alluvial sand from the active riverbed is analysed for residual luminescence signals. Additionally, fading rates are measured, and quartz and feldspar ages are compared to evaluate the effectiveness of the applied measurement protocol in targeting signals less susceptible to fading. Overall, our study provides (i) a methodological focus, highlighting the effect of partial bleaching and fading on age estimation, and (ii) new insights into landscape evolution of the lower Bruche valley through numerical dating of the terrace deposits. The luminescence ages of the three fluvial terraces reveal distinct periods of aggradation in the URG. The uppermost sequences of the youngest (i.e. lowest) and middle terraces were deposited during the Younger Dryas (∼ 12–14 ka) and Marine Isotope Stage 3 (∼ 27–35 ka), respectively, while the oldest (i.e. highest) alluvial terrace has a minimum age of ∼ 200 ka.
Geochronologische Untersuchungen von Flussterrassen erlauben wertvolle Einblicke in die Migration und Anpassung von Gerinnen in aktiv mäandrierenden Flusssystemen. Die numerische Altersbestimmung von fluvialen Ablagerungen mit Hilfe der Lumineszenzdatierung wird jedoch häufig durch inhärente methodische Beschränkungen in Frage gestellt. Das teilweise Bleichen von Körnern vor der Ablagerung kann zu einer Überschätzung führen, während anomales Fading in Feldspatkörnern oft zu einer Unterschätzung des Lumineszenzalters führt. Die aktuelle Studie wendet sowohl optisch stimulierte Lumineszenz als auch stufenweise erhöhte Temperatur post-infrarot stimulierte Lumineszenzdatierung auf Feinsand und sandige Matrixablagerungen an, die von drei verschiedenen fluvialen Terrassenebenen an dem Unterlauf des Flusses Bruche im Oberrheingraben (URG, nordöstliches Frankreich) entnommen wurden. Um das Ausmaß der partiellen Ausbleichung zu bewerten, wird moderner Schwemmsand aus dem aktiven Flussbett auf residuale Lumineszenzsignale hin untersucht. Darüber hinaus werden die Bleichungsraten gemessen und das Alter von Quarz und Feldspat verglichen, um die Wirksamkeit des angewandten Messprotokolls bei der Erkennung von Signalen zu bewerten, die weniger anfällig für Ausbleichen sind. Insgesamt bietet unsere Studie (i) einen methodischen Schwerpunkt, der die Auswirkungen des partiellen Ausbleichens und des Fadings auf die Altersbestimmung hervorhebt, und (ii) neue Einblicke in die Landschaftsentwicklung des unteren Bruche-Tals durch die numerische Datierung der Terrassenablagerungen. Die Lumineszenz-Alter der drei Flussterrassen lassen unterschiedliche Phasen der Aggradation im URG erkennen. Die obersten Abfolgen der jüngsten (d.h. untersten) und mittleren Terrassen wurden während der Jüngeren Dryas (∼ 12–14 ka) bzw. der marinen Isotopenstufe 3 (∼ 27–35 ka) abgelagert, während die älteste (d.h. höchste) alluviale Terrasse ein Mindestalter von ∼ 200 ka aufweist.
- Article
(11978 KB) - Full-text XML
-
Supplement
(769 KB) - BibTeX
- EndNote


From the Late Pleistocene to the Holocene, river dynamics within central Europe underwent significant changes due to hydro-climatic variations and anthropogenic activities (e.g. Houben, 2003; Macklin et al., 2006; Notebaert and Verstraeten, 2010). Formation of river terrace sequences frequently results from complex interplay between regional-scale tectonics and climatic fluctuations (e.g. Antoine et al., 2000; Bridgland and Westaway, 2008; Rixhon et al., 2011). While the Upper Rhine Graben (URG) represents an excellent setting in central Europe to study these intertwined effects between tectonics and climate on Quaternary timescales (e.g. Nivière et al., 2008; Preusser et al., 2021; Gegg et al., 2024, 2025), studies on fluvial landscape reconstruction have primarily dealt with the Rhine hydrosystem. These studies have focused on, among other aspects, (i) terrace formation during the Late Pleistocene (e.g. Erkens et al., 2009; Kock et al., 2009), (ii) Late Glacial to Holocene fluvial dynamics in the alluvial plain (e.g. Abdulkarim et al., 2022, 2024), and (iii) historical overbank deposition (e.g. Euzen et al., 2024). By contrast, Quaternary alluvial accumulations in the URG deposited by Rhine (sub-)tributaries originating from the Vosges Mountains or Black Forest have seen rather limited attention. One example is the Bruche River, whose (sub-)modern fluvial morphodynamics were recently studied (Jautzy et al., 2020, 2022). In the long-term subsiding URG, the Bruche system is unique among the western sub-tributaries because it is the only one preserving alluvial terraces along the lower valley (e.g. Castela and Tricart, 1958; Maire, 1966; Théobald, 1955). However, very little attention has been paid towards the chronology of this terrace sequence (Wuscher, 2021).
Optically stimulated luminescence (OSL) dating has been extensively used to establish chronologies for fluvial terraces (e.g. Ishii, 2022; Fuchs et al., 2014; Guo et al., 2012; Kolb et al., 2016; Rittenour, 2008; Zhang et al., 2020). This method determines the numerical age of sediment deposition by analysing luminescence signals in quartz and feldspar grains which are reset by light exposure and accumulate as trapped charge after burial, in response to environmental ionising radiation (e.g. Duller, 2008; Preusser et al., 2008). Pre-depositional complete resetting of the luminescence signal is an important prerequisite for luminescence dating, as incomplete signal resetting (so-called partial bleaching) can lead to age overestimation (e.g. Bailey et al., 1997; Preusser et al., 2007). The phenomenon of partial bleaching is especially problematic for fluvial deposits when sediments are transported for short distances and in turbid water with reduced light intensity, preventing complete signal resetting (Rittenour, 2008; Wallinga, 2002). To account for incomplete bleaching within fluvial deposits, quartz is typically favoured for analysis, as its luminescence signal resets more rapidly than that of feldspar (e.g. Godfrey-Smith et al., 1988; Murray et al., 2012). Moreover, small aliquots or single grains are generally analysed (Olley et al., 1999; Reimann et al., 2012; Smedley et al., 2019) and appropriate statistical models are used to isolate grains/aliquots representative of the true burial dose (e.g. Mahadev et al., 2019; Cunningham et al., 2015).
When dating fluvial deposits older than ca. 100–150 ka, feldspar infrared stimulated luminescence (IRSL) is necessary because of its more extended dating range compared to the quartz OSL signal (e.g. Buylaert et al., 2012). However, targeting feldspars presents additional challenges, as the IRSL signal is affected by anomalous fading – progressive signal loss over time (Wintle, 1973; Spooner, 1994) – which can lead to age underestimation. To address this issue, attempts have been made either to correct for or to avoid anomalous fading. Fading models have been proposed to correct luminescence ages (e.g. Huntley and Lamothe, 2001; Kars et al., 2008) based on the measurement of the fading rate (g value) in terms of percentage loss per decade. Alternatively, instead of applying fading corrections, measurement protocols have been developed that target signals less prone to fading. These protocols employ either two (post-IR IRSL, or pIRIR; Buylaert et al., 2009; Thomsen et al., 2008) or multiple (multi-elevated temperature post-IR IRSL, or MET-pIRIR; Li and Li, 2011) high-temperature IR stimulation steps. However, while these more stable pIRIR signals reduce the impact of fading, they are also more resistant to bleaching (Buylaert et al., 2012). As a result, a non-bleachable residual dose may persist (Li et al., 2014), potentially affecting the age estimation of sediments which experienced incomplete bleaching (e.g. in fluvial environments).
The present study aims to investigate the combined effects of partial bleaching and anomalous fading on luminescence dating of fluvial deposits. The first aspect is explicitly addressed when analysing the degree of signal resetting in modern sediments. Quartz OSL and feldspar MET-pIRIR measurements are applied to sand lenses and the sandy matrix of gravel layers from three distinct fluvial terraces of the lower Bruche (north-eastern France; Fig. 1). The latter is a rather rarely used approach (Kenworthy et al., 2014; Serra et al., 2025) but has been successfully tested on the Rhine Lower Terrace deposits from the southern part of the URG (Marik et al., 2024). The present results provide new insights into the application of luminescence dating to fluvial deposits and allow us to establish a first numerical framework for the unique Quaternary terrace sequence of the lower Bruche system. This study used feldspar MET-pIRIR measurements in addition to quartz OSL for two reasons. First, quartz grains from the URG (and other regions) often yield signals that are too dim to be used for reliable age calculation (e.g. Abdulkarim et al., 2024; Preusser et al., 2016, 2021). Second, feldspar enables dating of much older deposits, reaching further back into the middle Pleistocene (e.g. Li and Li, 2012). As the luminescence signal from feldspar resets more slowly than that from quartz and may suffer from fading, even for elevated temperature measurements, it is methodologically important to additionally assess feldspar ages for samples where quartz grains have useful luminescence signals. In addition, one out of the three sedimentary units from the Bruche Valley could not be dated using quartz alone, highlighting the added value of using feldspar grains in order to ensure robust and cross-validated age estimates.
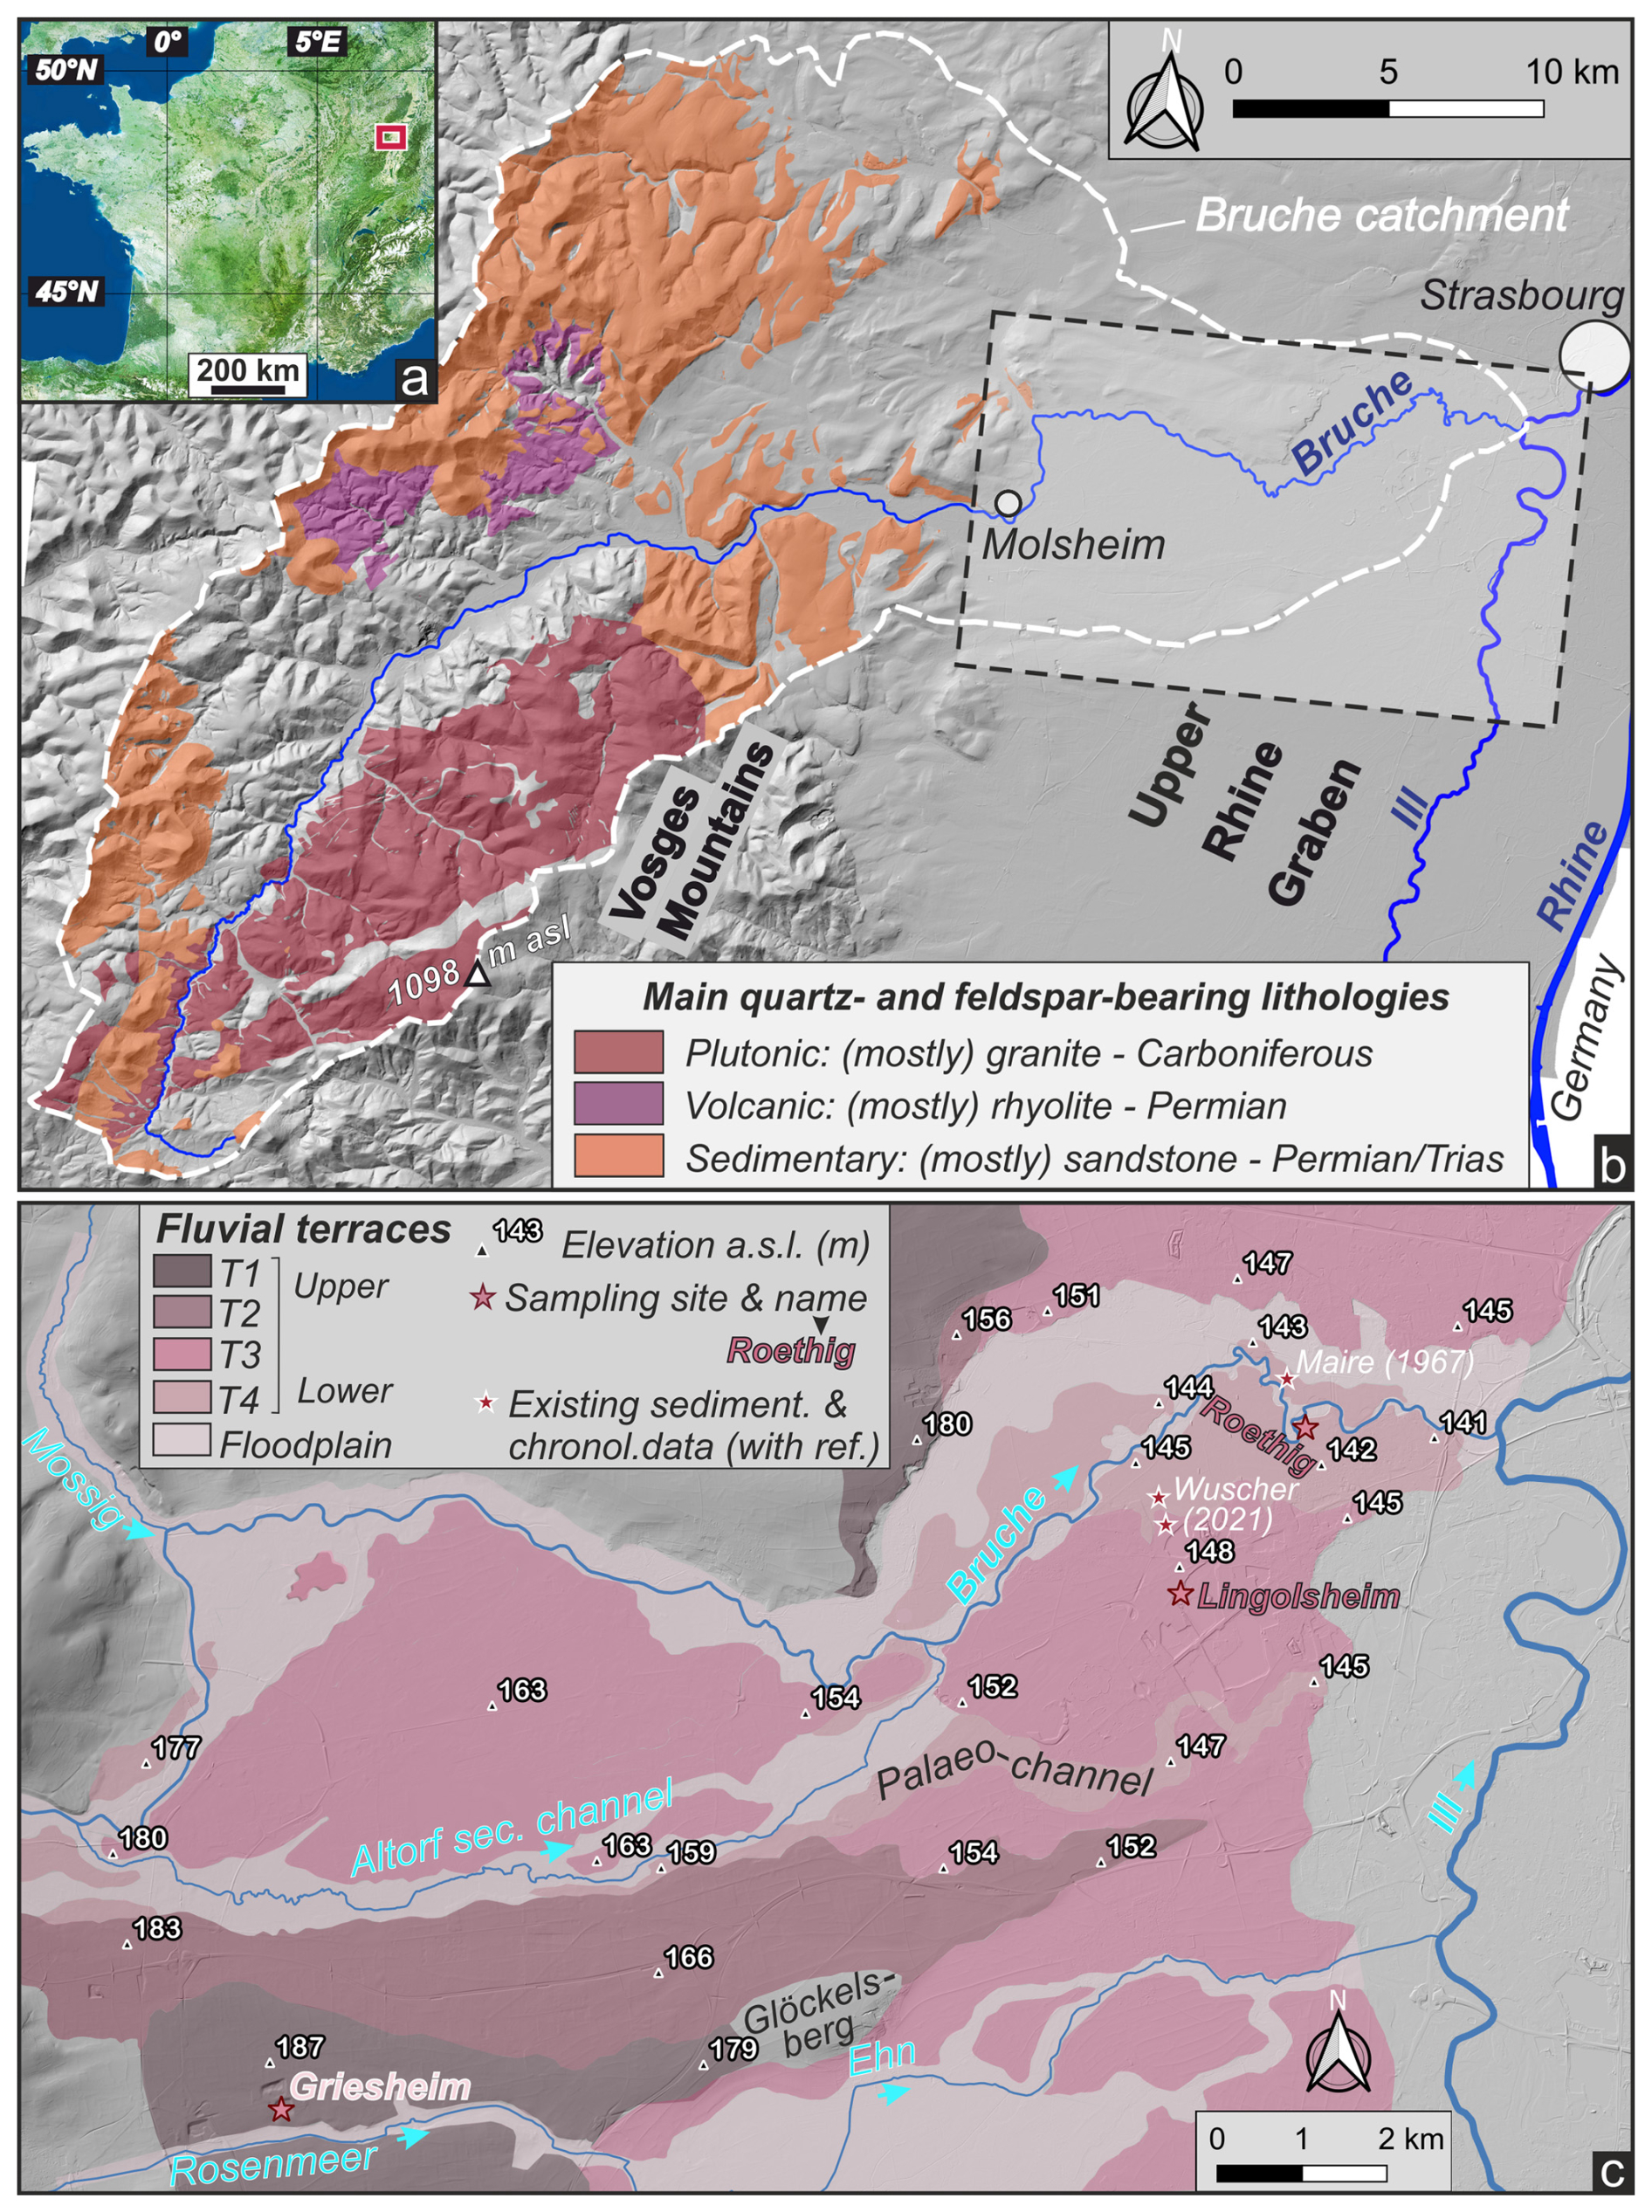
Figure 1(a) Location of the study area in north-eastern France. (b) Simplified lithological map of the Bruche catchment in the Vosges Mountains. Only the main quartz- and feldspar-bearing lithologies delivering sandy material are represented. The dashed rectangle in the lower section of the river delimits the study area presented in panel (c). (c) River terrace map (T4 to T1) of the lower Bruche. Fluvial morpho-sedimentary units after Maire (1966) with their spatial extension slightly adapted to topography where necessary. Stars with white and red borders refer to existing sedimentological and/or chronological data in the area and sampled terrace deposits, respectively.
Located in north-eastern France, the ∼ 80 km long Alsatian Bruche River flows into the Ill River directly upstream of Strasbourg (Fig. 1a–b). It is one of the main western sub-tributaries of the Upper Rhine owing to its ∼ 730 km2 large catchment and has a mean longitudinal slope of ∼ 0.007 m m−1 (Jautzy et al., 2022). Geological and geomorphological characteristics of the catchment allow two main river sections to be distinguished. The ∼ 50 km long upper section cuts through the northernmost extension of the crystalline Vosges Mountains from the source, located at ∼ 690 m above sea level (a.s.l.), to roughly Molsheim (Fig. 1b). The crystalline Vosges consists of a wide array of Palaeozoic rock formations, particularly well represented in the Bruche catchment (e.g. Jautzy et al., 2024). Whilst several Carboniferous plutonic rocks (i.e. mostly granites) form the bulk of crystalline formations to the south and peak at almost 1100 m a.s.l., Permian rhyolites occur northward of the main trunk (Fig. 1b). Permian and Lower Triassic sediments, mainly coarse-grained sandstones of the “Buntsandstein” formations, unconformably overlie the crystalline basement; these sedimentary rocks are distinguished by their characteristic reddish colour (Fig. 1b). Weathered material from these three lithologies produces quartz- and feldspar-bearing sand.
The ∼ 30 km long lower section of the Bruche River (i.e. from Molsheim to the confluence with the Ill, Fig. 1b) successively drains the Vosgian footslopes and part of the URG, where the width of the floodplain can locally exceed 1 km (Fig. 1c). Among the large rivers draining the south-western part of the URG and developing kilometre-wide alluvial fans in this long-term subsiding area (e.g. Fecht, Giessen/Liepvrette, Thur, Zorn), the Bruche system clearly stands out (Maire, 1966; Wuscher, 2021). Its Quaternary alluvial formations are indeed the only ones to be found at topographically higher-lying positions in the landscape and thereby form several terraces flanking its lower valley (Fig. 1c; Baulig, 1922; Castela and Tricart, 1958; Théobald, 1955; Lautridou et al., 1985). Maire (1966) identified four distinct levels of fan-like terrace deposits (hereinafter labelled T1–T4, from highest to lowest; Fig. 1c). The surface topography of the highest (T1) and lowest (T4) terraces is located 20–25 and 1–2 m above the present-day floodplain, respectively (Fig. 1c). Note, however, (i) that a plurimetric loess cover regularly overlies the highest terrace deposit T1 (Fig. 2c; Buraczynski and Butrym, 1984; Lautridou et al., 1985; Millot et al., 1957; Wuscher, 2023) and (ii) that the top elevation of each terrace level consistently decreases downstream (i.e. from west to east; Fig. 1c). The subsurface database of the French Geological Survey (BRGM: https://infoterre.brgm.fr/viewer/MainTileForward.do, last access: 6 October 2024) provides information on drilling performed in these terraces close to each sampling site. These data reveal that the thicknesses of alluvial bodies exceed 50 m in T1, T3, and T4 (Fig. 2), whilst a contact with the underlying Oligocene marls was identified beneath both T3 and T4. Although gravel-supported layers are predominant, loamy/sandy layers along with sand lenses are also present within the terraces' stratigraphy (Fig. 2). The colour of the silt/sand lenses and sandy–loamy matrix in gravel-supported layers allows a rough differentiation in terms of provenance: greyish to light-beige material points towards a Rhenish origin, whereas brownish to reddish material indicates a Vosgian origin (Fig. 2). This results from a relative enrichment in carbonates in the Rhenish deposits and the presence of red sandy material desegregated from the “Buntsandstein” formations in the Vosgian deposits (Wuscher, 2023). Chronological constraint on terrace formation remains poor: a few luminescence age estimates allocate T3 to Marine Isotope Stage 3 (MIS 3: ∼ 58–29 ka; Wuscher, 2023).
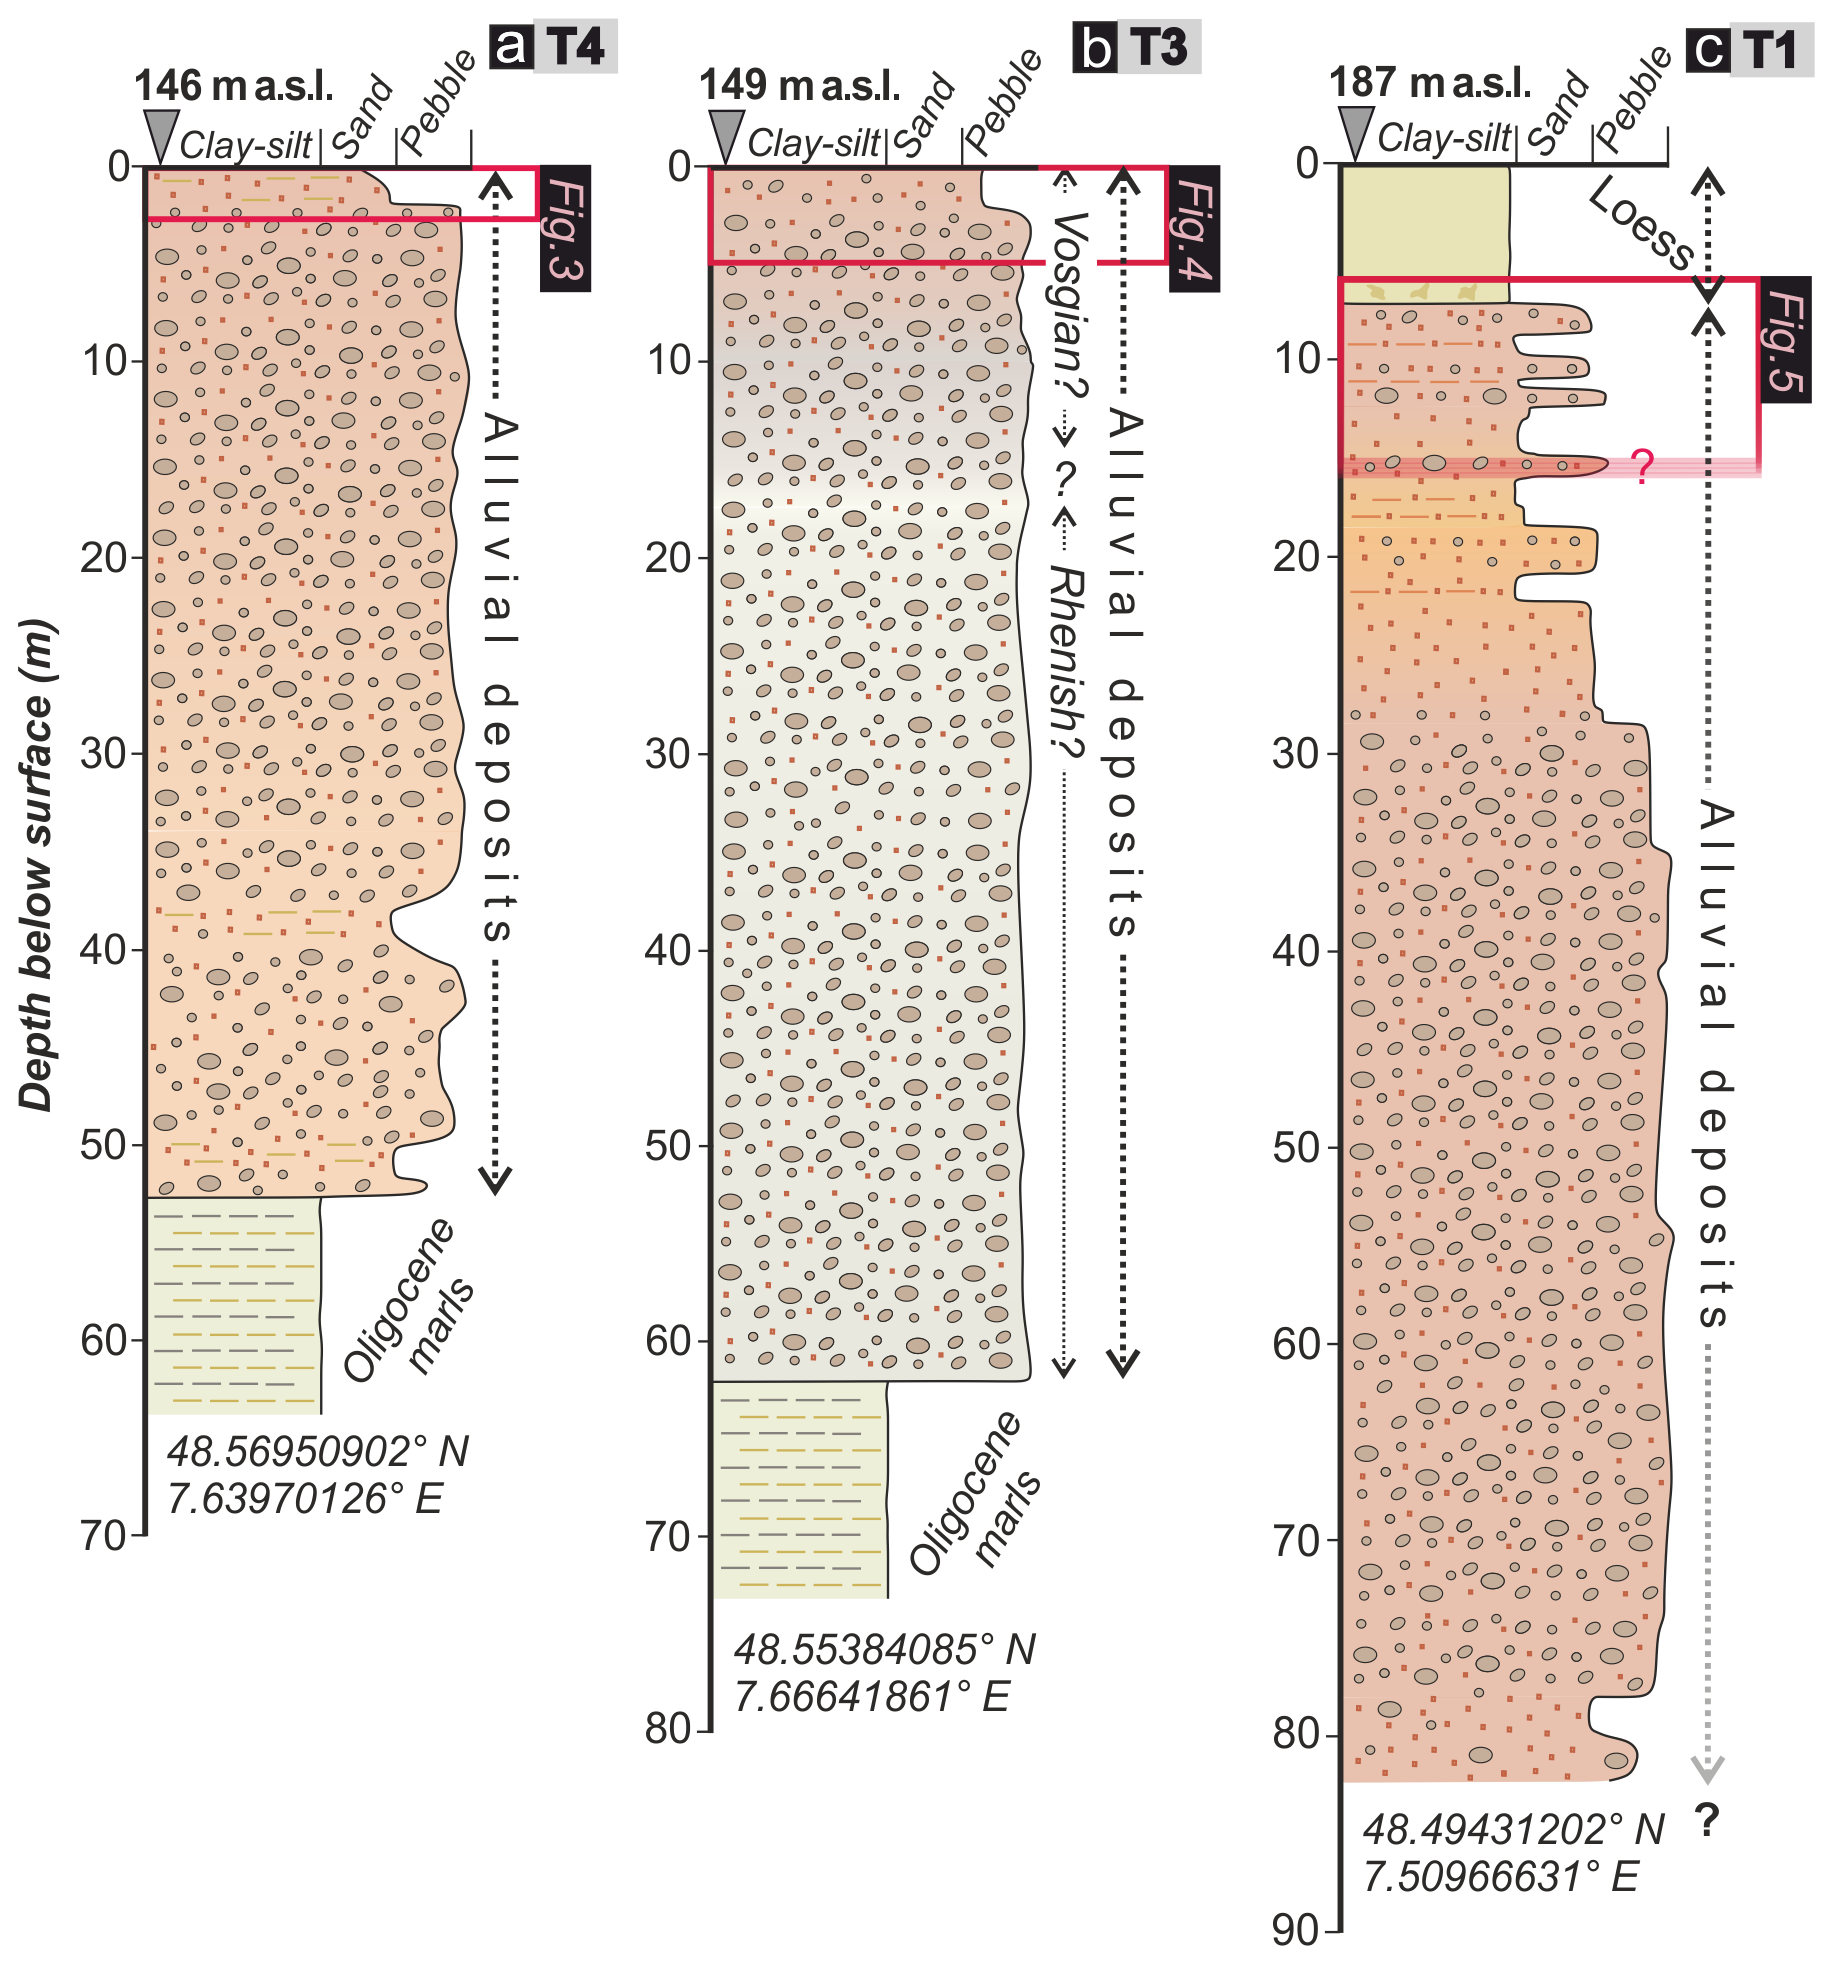
Figure 2Stratigraphic log of terrace deposits located in the vicinity of each sampling site in T4, T3, and T1. Red rectangles refer to the depth and thickness of sediments exposed in each sampling site (see details in Fig. 3). Logs are drawn according to drilling reports available from the subsurface database of the French Geological Survey (https://infoterre.brgm.fr/viewer/MainTileForward.do). The different colours of the alluvial deposits are related to the different provenances of the sediment: greyish to light-beige material points towards a Rhenish origin, whereas brownish to reddish material indicates a Vosgian origin.
3.1 Field strategy and sampling sites
The thorough terrace mapping by Maire (1966, 1967) was used in this study (Fig. 1c). Where necessary, we slightly adjusted terrace boundaries based on the light detection and ranging (LiDAR)-derived digital terrain model (DTM) provided by the French National Geographic Institute. We investigated three fluvial terraces, i.e. T4, T3, and T1, and the sampling sites are hereinafter referred to as Roethig, Lingolsheim, and Griesheim, respectively (Figs. 1c, 3, 4, and 5). Owing to modern lateral channel erosion in T4, we took advantage of this natural exposure to sample the lowermost terrace (Roethig: 48.569087° N, 7.680825° E; Fig. 3a–c). Two large gravel pits were sampled for T3 (Lingolsheim: 48.552341° N, 7.660434° E; Fig. 4a–b) and T1 (Griesheim: 48.502610° N, 7.513700° E; Fig. 5a–b). We could not sample T2 because of a lack of exposure. The sampling strategy in each terrace was twofold: sandy layers/lenses and the sandy matrix from clast-supported gravel layers were both collected (Figs. 3b, 4b, and 5b). Sand samples were collected by inserting light-proof metal or plastic tubes into freshly exposed sand layers or lenses, following the removal of ∼ 1 cm of surface material to eliminate any light-exposed sediment. Sandy matrix samples were collected from gravel-rich horizons by covering a ∼ 3 m2 area with a black pond liner to shield the outcrop from sunlight. In addition to the scarcity of well-developed sand lenses within the investigated terraces, matrix deposits were sampled for luminescence dating to acknowledge the methodological limitation associated with these less commonly dated materials, particularly related to its dosimetric complexity (Ishii and Ito, 2024; Kenworthy et al., 2014; Marik et al., 2024). This combined luminescence dating approach using both sand and matrix deposits therefore serves as a valuable reference for future studies within comparable fluvial settings, where sand layers are absent and matrix deposits present the only suitable material for establishing a chronological framework.
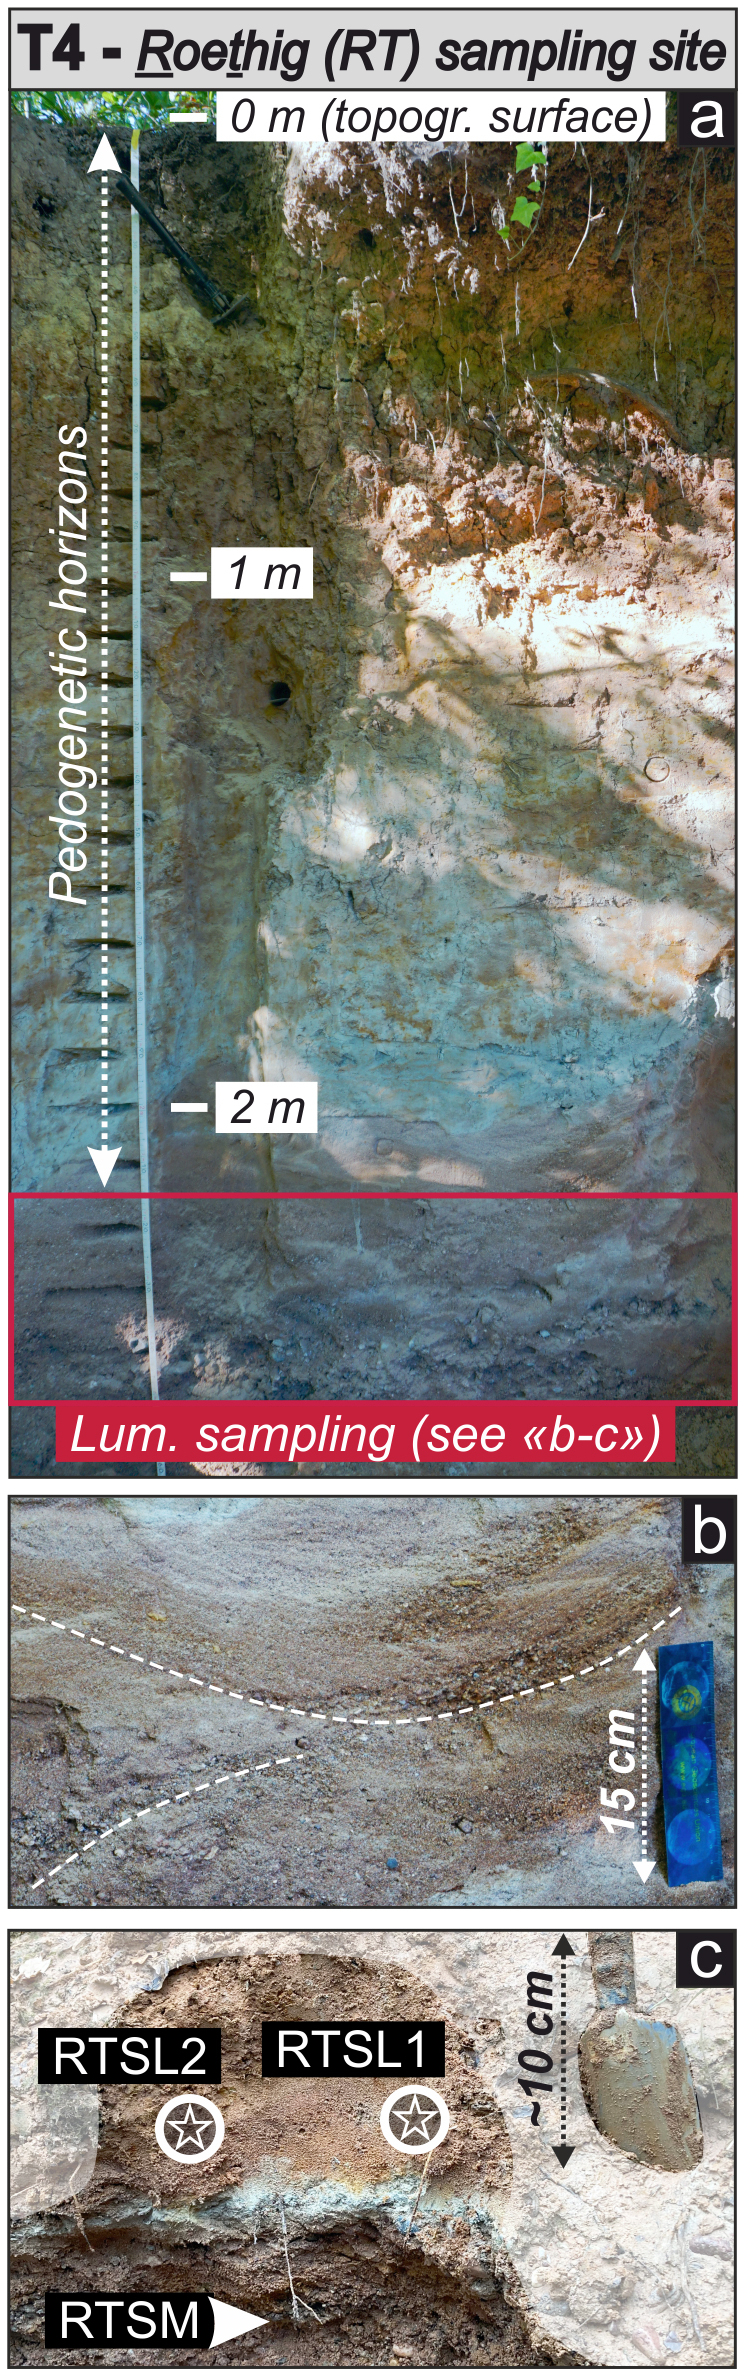
Figure 3Field characteristics of the Roethig (T4; a–c) sampling sites. The Roethig profile overview reveals pedogenesis in the upper ∼ 2 m, with cross-bedding occurring within the sampled layers (b). White stars within circles and arrows refer to luminescence samples collected in sandy layers and sandy matrix from clast-supported layers, respectively.
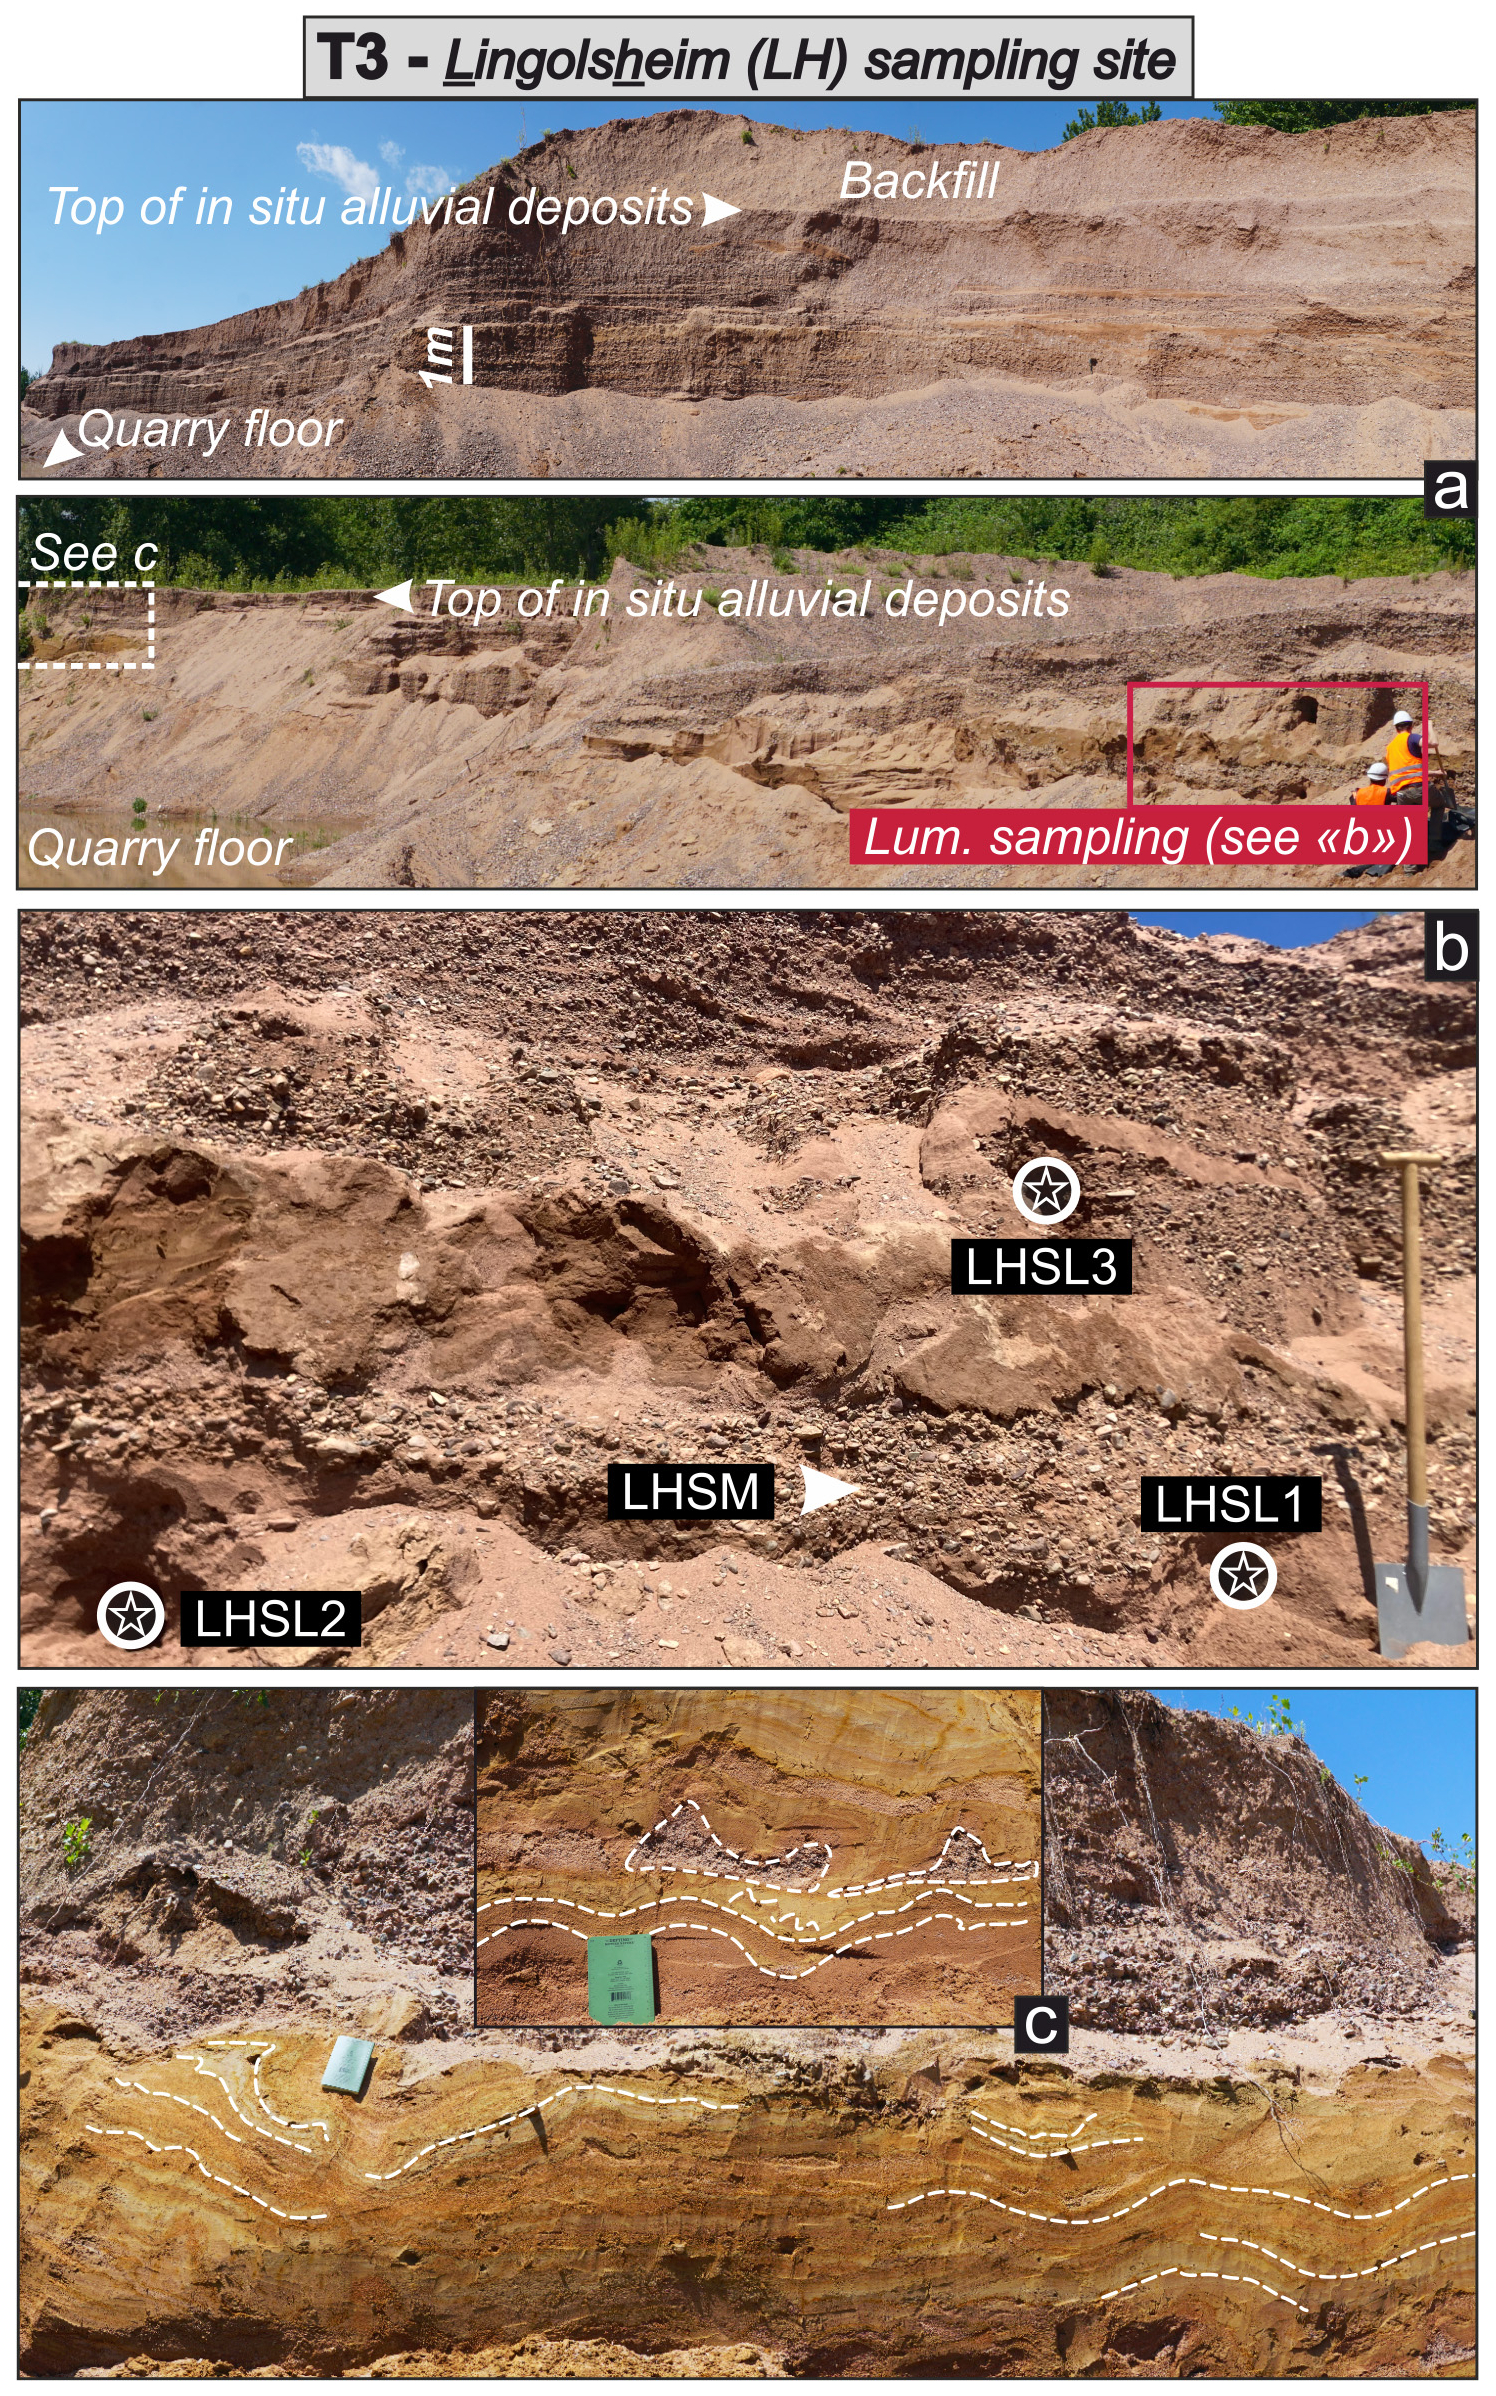
Figure 4Field characteristics of the Lingolsheim (T3) sampling sites. Panoramic views of the gravel pit at Lingolsheim (a), dominated by clast-supported layers, showing the sampling depth approximately halfway between the quarry floor and the top of alluvial deposits (vertical white segment ∼ 2.5 m below the topographic surface). Sampled layers sandwich fine-grained sediments showing cryoturbations (b) that are best visible at the pit's margin, where they affect various grain sizes ranging from silt to gravel (c). White stars within circles and arrows refer to luminescence samples collected in sandy layers and sandy matrix from clast-supported layers, respectively.
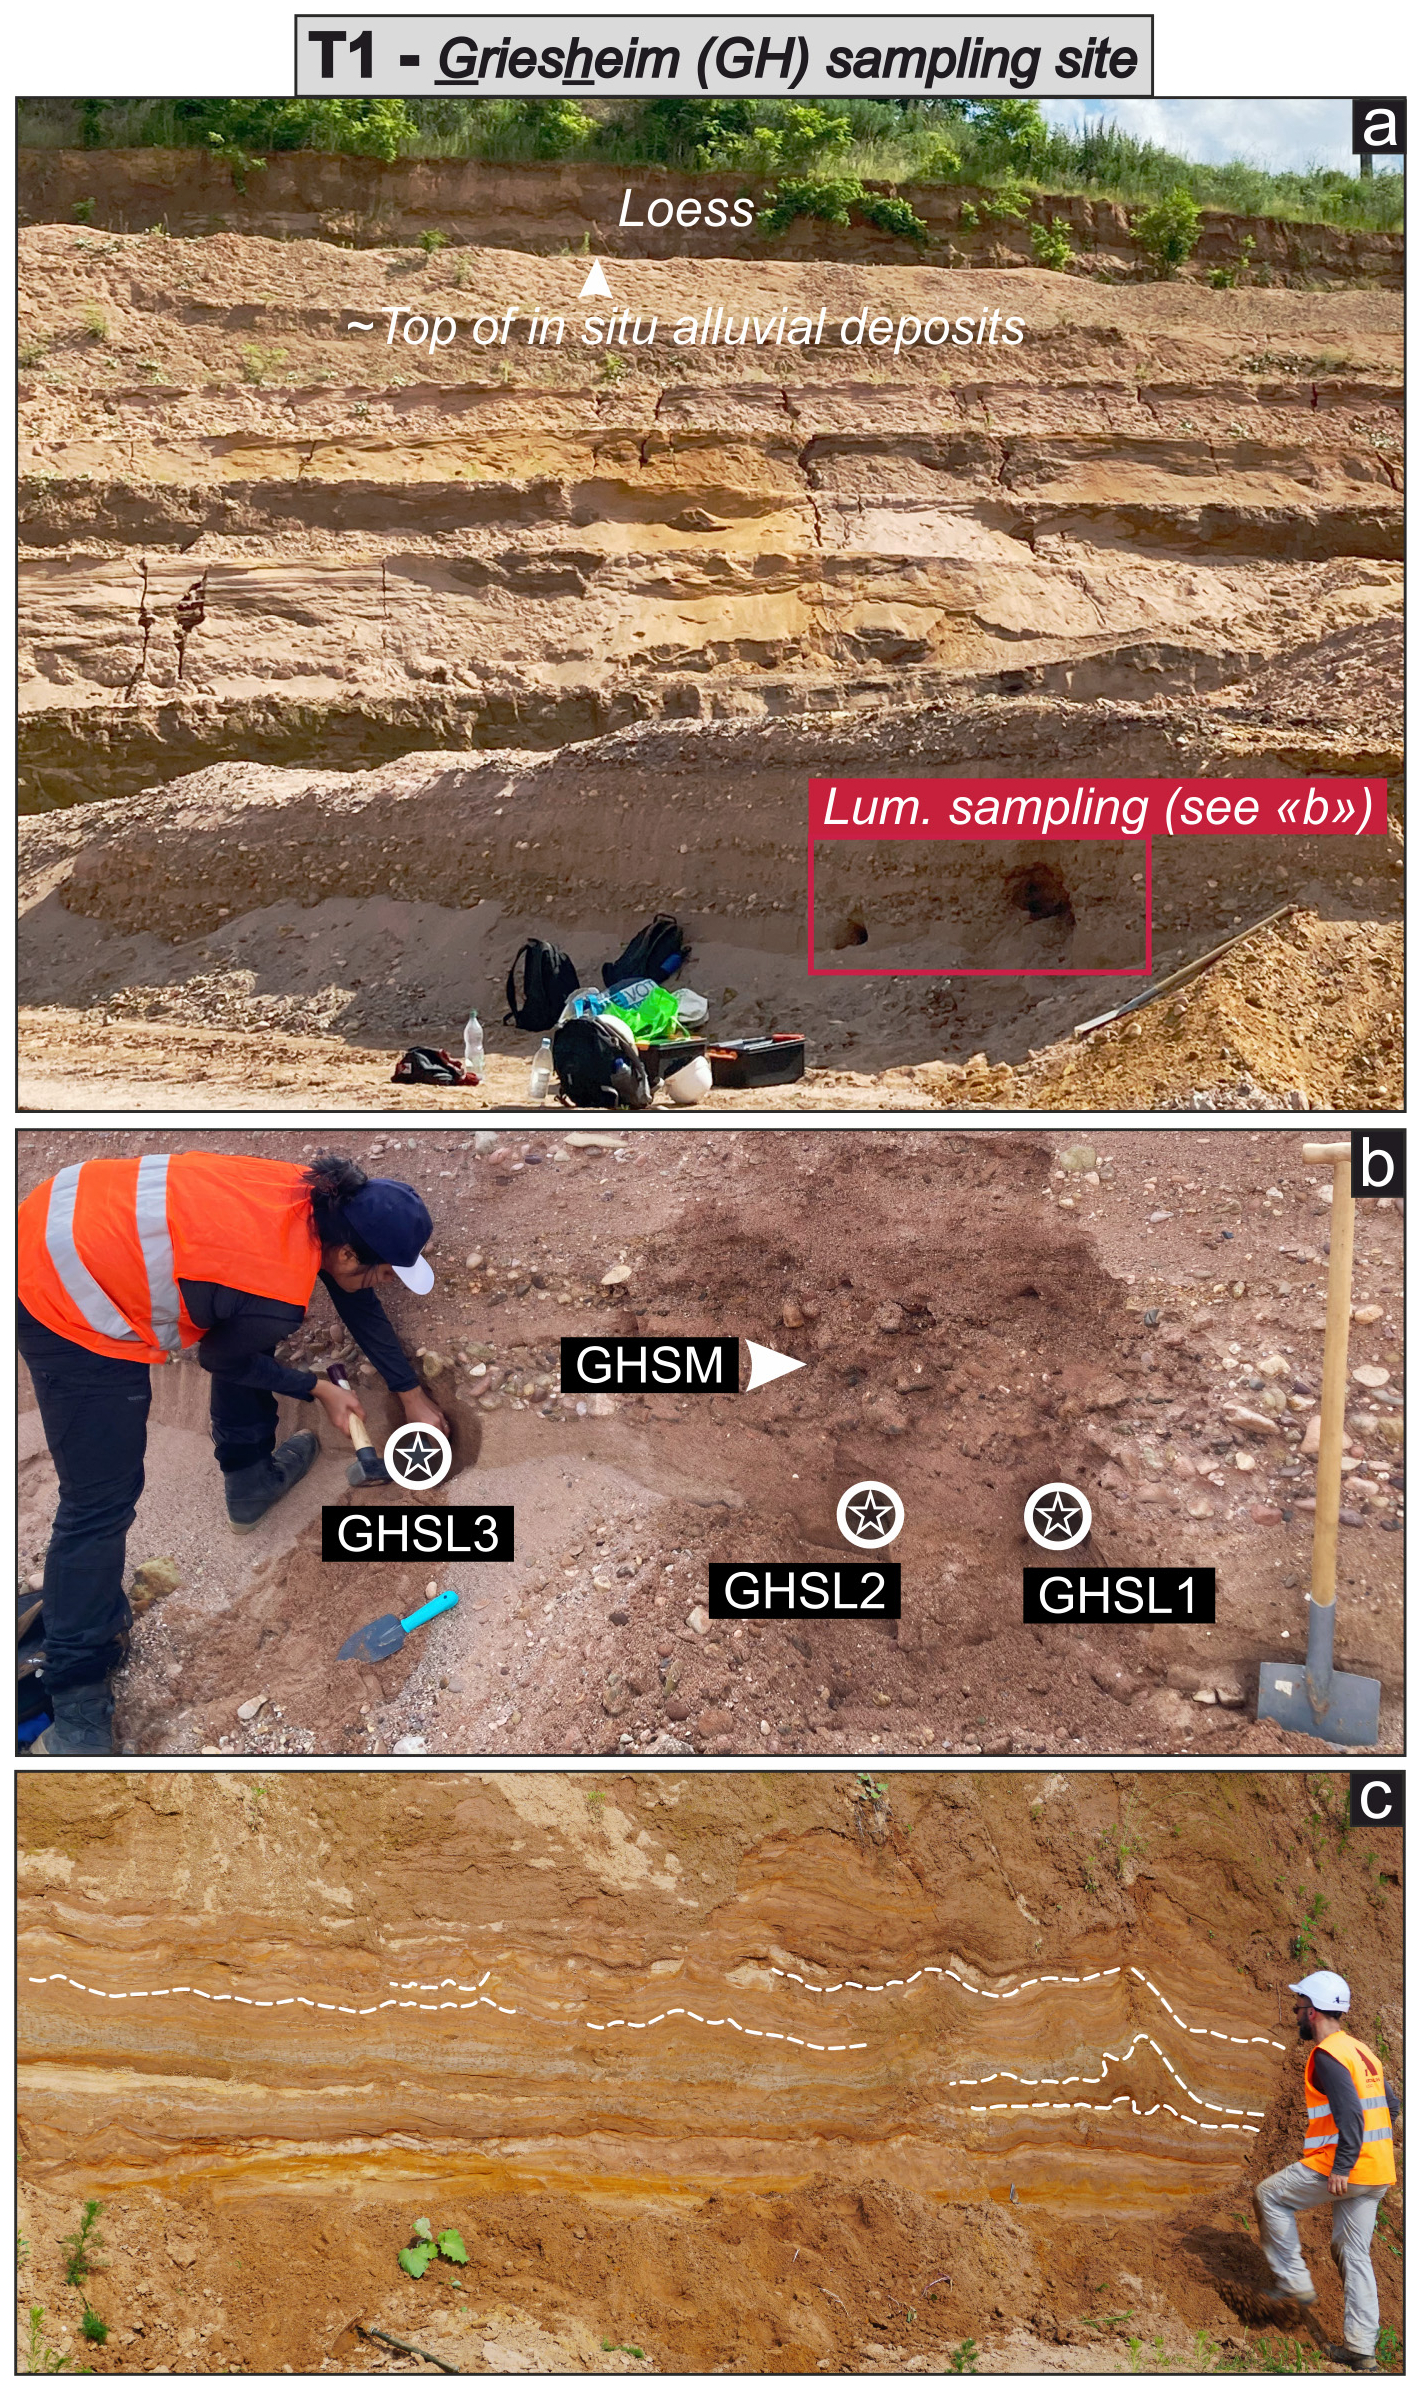
Figure 5Field characteristics of the Griesheim (T1) sampling sites. Overview of the gravel pit near Griesheim, where alluvial sandy layers and clast-supported layers are overlain by loess (a). Sampled layers are located close to the quarry floor at a depth of ∼ 8 m (b). Cryoturbations occur in fine-grained sediments approximately at the same depth as the sampled layers (c). White stars within circles and arrows refer to luminescence samples collected in sandy layers and sandy matrix from clast-supported layers, respectively.
At Roethig, the ∼ 2.6 m high fining upward sequence evolves from clast- and sand-supported layers at the base to silty/loamy material at the top (Fig. 3a). In the former, brown to reddish sandy material displaying channel structures contrasts with the assorted pedogenetic horizons developed in the latter (Fig. 3a). Two sand samples (RTSL1 and RTSL2) and one sandy matrix sample (RTSM) were collected from a sand lens and a gravel layer located at depths of ∼ 2.2 and ∼ 2.5 m below the topographic surface, respectively (Fig. 3). In the Lingolsheim gravel pit, clast-supported layers largely prevail along the ∼ 5 m high sediment exposure (Fig. 4a). They are interspersed with secondary brown sandy layers and sand lenses. Two sand samples (LHSL1 and LHSL2) and one sandy matrix sample (LHSM) were collected from a sand lens and a gravel layer located at a depth of ∼ 2 m below the visible top of in situ alluvial deposits in the pit (Fig. 4b). A third sand sample (LHSL3) was collected from a sand layer located ∼ 0.5 m above the previous ones. Decimetric deformation structures are particularly conspicuous in sandy/loamy layers at the western margin of the quarry (Fig. 4c), but they also occur in a thin sandy layer (not sampled) sandwiched between our samples. The Griesheim gravel pit exhibits at least 8 m of sediments: fluvial deposits are overlain by up to 1.5–2 m thick loess cover (Fig. 5a). Clast-supported layers are not as prevalent as in the previous outcrop, and brown to reddish/orange sandy layers or lenses regularly occur as well. Three sand samples (GHSL1, GHSL2, and GHSL3) and one sandy matrix sample (GHSM) were collected from a sand layer and a coarse gravel horizon located ∼ 8 m below the topographic surface (Fig. 5a–b). Similarly to at the Lingolsheim pit, decimetric deformation structures were observed in > 1 m thick sandy/loamy layers located near the bottom of the quarry (Fig. 5c; roughly at the same depth as the sampled layers). Finally, two sandy samples were collected from the modern riverbed of the Bruche (MOD1 and MOD2), directly downstream of the Roethig outcrop (Fig. 1c). Approximately 10 g of sand was collected at depths of ∼ 0.1 cm (MOD1, finer sand) and ∼ 3–4 cm (MOD2, coarser sand) below the surface of the exposed sandy bar. Samples were immediately transferred into black plastic bags to avoid sunlight exposure.
3.2 Sample preparation and luminescence measurements
Sand and matrix samples were processed for luminescence dating under subdued red-light illumination at the luminescence laboratory of the University of Freiburg. Grain fractions of 150–200 and 200–250 µm were separated from each sample and subsequently treated with HCl (20 %) and H2O2 (15 %) to remove carbonates and organic material, respectively. Subsequently, K-feldspar (ρ < 2.58 g cm−3) and quartz (2.58 g cm−3 < ρ < 2.70 g cm−3) fractions were separated through heavy liquid separation (lithium heteropolytungstate, LST). Only the quartz fraction was etched afterward in 40 % HF for 1 h to remove iron oxide or clay coatings present at the outer rim of the grains as well as dissolve any remaining feldspars. Etched quartz grains were finally treated with 30 % HCl for ∼ 1 h to eliminate fluoride precipitation.
Table 1SAR (Murray and Wintle, 2000) and MET-pIRIR (Li and Li, 2011) protocols used to date quartz and feldspar aliquots, respectively.
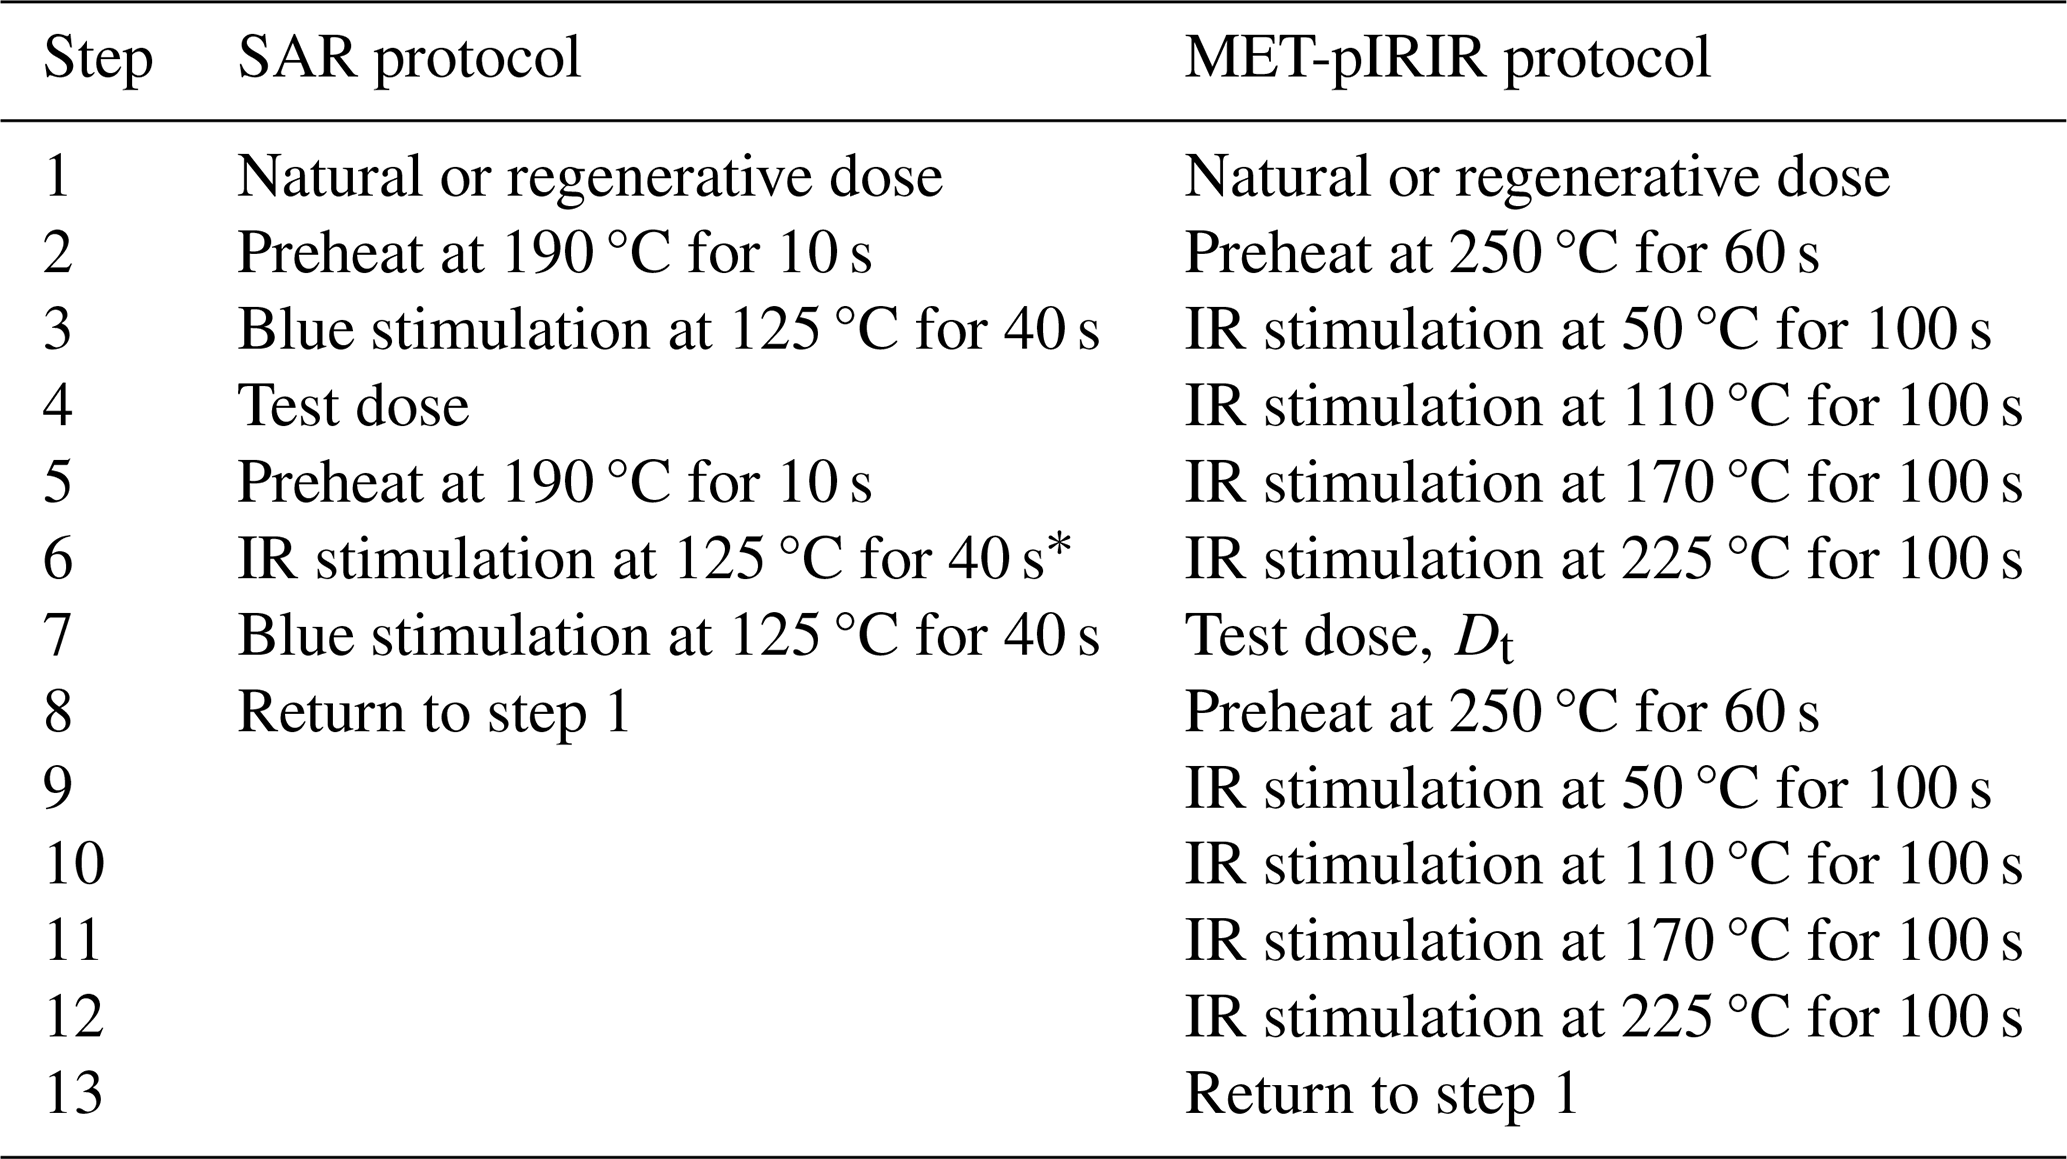
∗ IR stimulation was applied only in the last regenerative dose step following Duller (2003).
Multigrain-luminescence measurements were carried out using Risø TL/OSL readers (model DA-20; Bøtter-Jensen et al., 2010) equipped with LEDs with peak emission at 470 and 870 nm for quartz OSL (optically stimulated luminescence) and feldspar IRSL (infrared stimulated luminescence), respectively. Luminescence measurements were performed at the luminescence laboratories of the University of Freiburg (Germany) and University of Bern (Switzerland). All 90Sr 90Y beta sources mounted into the Risø reader were calibrated using 2 mm aliquots of LexCal calibration quartz of 90–160 µm (Lexcal 2014; Richter et al., 2020). Calibrated dose rates vary between 0.08–0.10 Gy s−1 for the different readers and were applied to all measured grain and aliquot sizes. Determination of equivalent doses (De) was performed following a single-aliquot regenerative dose (SAR) protocol (Murray and Wintle, 2000) for quartz (on 2 mm aliquot size and 200–250 µm grain size) and a multi-elevated temperature post-infrared IRSL (MET-pIRIR) protocol (Li and Li, 2011) for feldspar (on 1 mm aliquot size and 150–200 µm grain size) (Table 1). In the SAR protocol, a standard preheat instead of a cut-heat temperature is applied prior to test dose measurement, considering the absence of significant thermal transfer (Fig. 6a, b) and sensitivity changes within the quartz aliquots of investigated terraces. In the MET-pIRIR protocol, high-temperature pIRIR signals such as pIR110, pIR170, and pIR225 are measured with the aim of targeting stable IRSL signals with negligible fading (Fu and Li, 2013; Li and Li, 2011). Signals from test doses (∼ 10 Gy) were used for correcting the sensitivity changes in both the SAR and the MET-pIRIR protocols, and a low heating rate of 2 °C s−1 was maintained during the measurements in order to avoid any thermal offset (Elkadi et al., 2021; Jenkins et al., 2018). A small test dose was selected for feldspar De measurements, since no significant sensitivity change was observed during feldspar De measurement and, additionally, feldspar dose recovery tests showed no evidence of charge carryover within the test dose signals (Colarossi et al., 2018). For De determination, signals of the first 0.3 s (OSL) and 15 s (MET-pIRIR) of stimulation were integrated and a late background subtraction was applied using the last 8 s (OSL) and 30 s (MET-pIRIR). Dose response curves (DRCs) were fitted with a single saturation exponential and an exponential plus linear function for OSL and MET-pIRIR measurements, respectively. Routine rejection criteria were followed in order to accept De derived from both quartz and feldspar measurements, a recycling ratio of 10 % within unity was accepted, and recuperation < 10 % of the natural dose was considered. De distributions from quartz OSL and feldspar MET-pIRIR measurements of each sample were analysed using the central age model (CAM; Galbraith et al., 1999), based on the limited scatter of the De distribution (further discussion in Sect. 4).
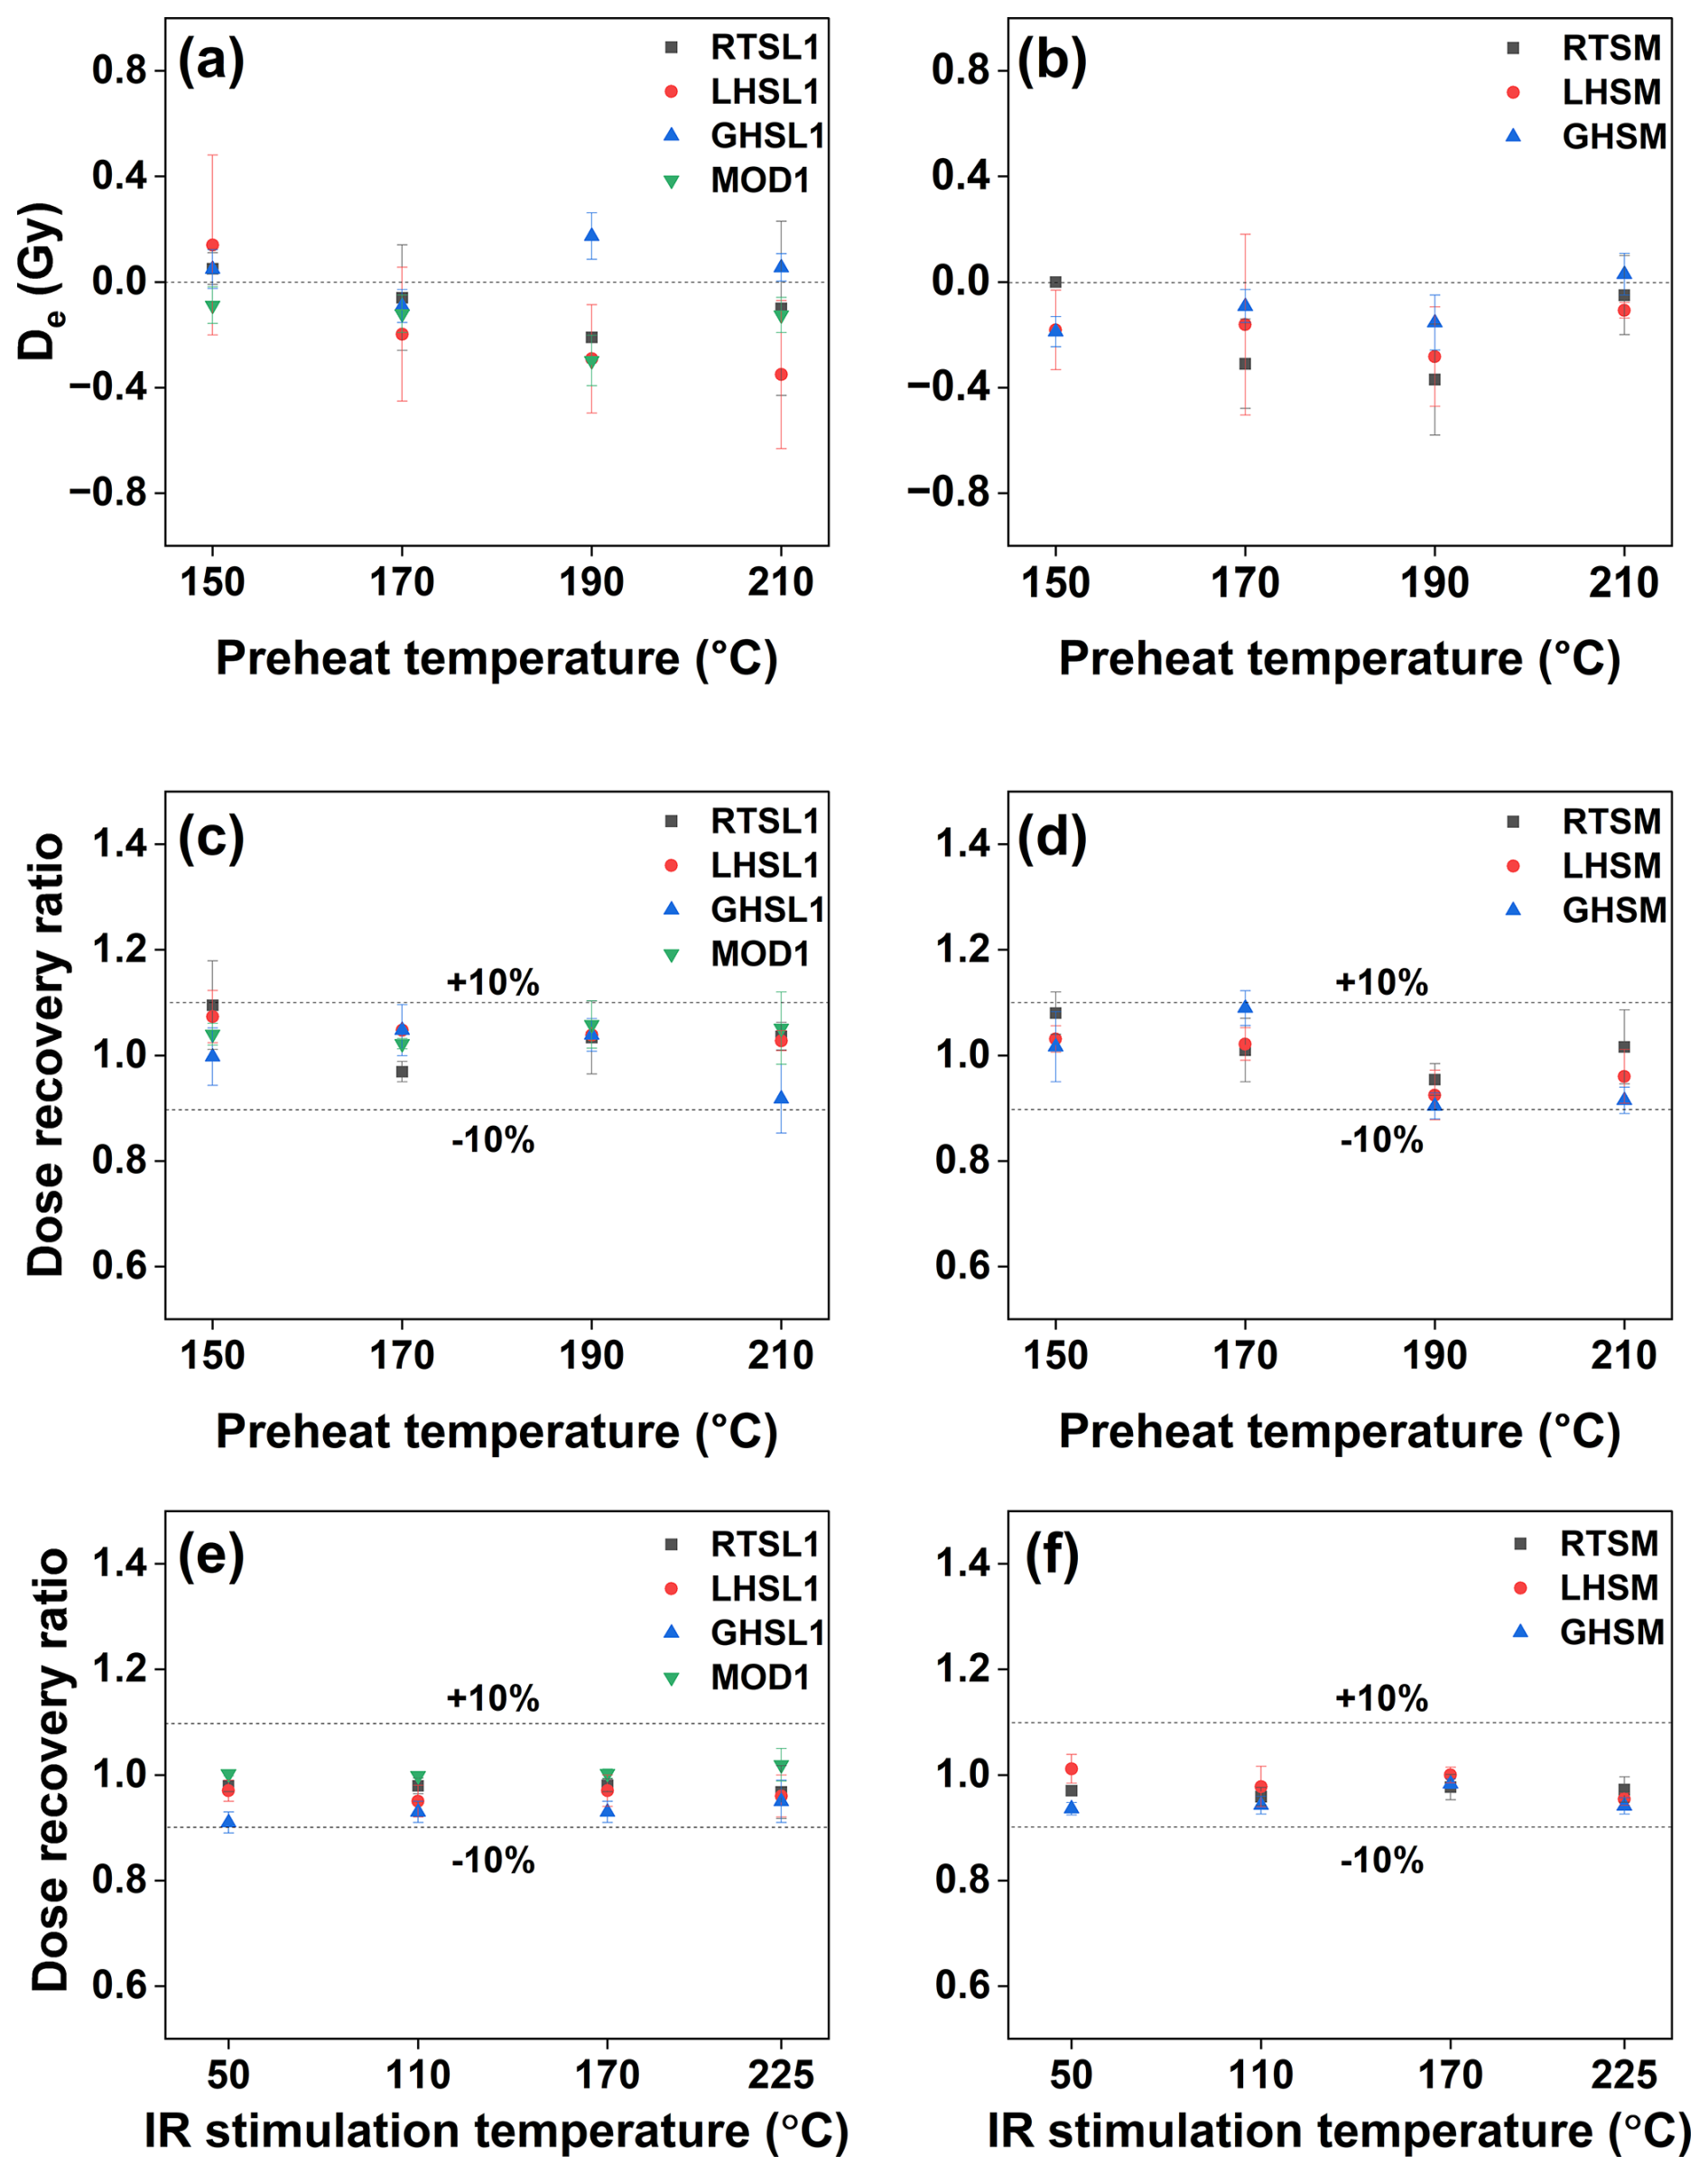
Figure 6Results of protocol performance tests performed on bleached quartz and feldspar aliquots from modern samples, as well as from sand and matrix samples from the three fluvial terraces. Panels (a) and (b) present the results from thermal transfer tests performed at different preheat temperatures on quartz grains of sand samples and modern sand (a) and of matrix samples (b). Dose recovery test results from quartz grains are shown by panels (c) and (d), derived from sand samples and modern sand (c) and from matrix samples (d), respectively. Results of dose recovery tests conducted on feldspar grains at different IR stimulation temperatures are shown for sand samples and modern sand (e) and for matrix samples (f). Individual data points of each panel represent the mean value obtained from three aliquots for each sample, and corresponding error bars indicate the standard deviation. Note that only representative performance test results of samples RTSL1, LHSL1, GHSL1, and MOD1 are shown in this figure; other sand samples (RTSL2, LHSL2, LHSL3, GHSL2, and GHSL3) as well as another modern sand sample (MOD2) produced similar results, which are not presented to improve readability of this figure.
3.3 Determination of dose rate
Approximately 200 g of bulk material was collected from the surroundings of each sand and matrix sample in order to estimate the environmental dose rate. The concentration of radioelements (K, Th, and U) was measured through high-resolution gamma spectrometry (Preusser et al., 2023). Clasts from the gravel horizons, where the matrix was retrieved, were crushed and milled into fine powder (< 2 mm) before gamma spectrometry analysis to account for potential dosimetry variability within heterogeneous gravel deposits. Gamma spectrometry was performed at the University of Freiburg after 1 month of storage of the samples to build up radioactive equilibrium between radon and its daughter isotopes; no evidence for radioactive disequilibrium was observed in the uranium decay chain. Infinite matrix dose rates were derived based on the concentration of radioelements using ADELEv2017 software (Degering and Degering, 2020) and applying the conversion factors of Guérin et al. (2011). For feldspars, an alpha efficiency value of 0.05 ± 0.01 and an internal K content of 12.5 ± 0.5 % (Huntley and Baril, 1997) were assumed. Water contents of 12 ± 5 % and 10 ± 5 % were measured for the sand and sandy matrix samples, respectively. Cosmic dose rate contribution was determined based on Prescott and Hutton (1994). Variation in sediment composition within sediment layers of < 30 cm thickness can often lead to uneven gamma radiation by adding uncertainty to dose rate measurement (Preusser et al., 2023). Such stratigraphic scenario was observed for the Roethig terrace samples, where the sand (RTSL1 and RTSL2) and matrix (RTSM) samples were collected from layers above and below a narrow oxidated horizon, respectively (Fig. 3c). The dose rates of these samples were calculated using a three-layer model in the ADELEv2017 software (Preusser and Degering, 2007; Preusser et al., 2023).
4.1 Performance test measurements
Routine performance tests were conducted on all the analysed samples to confirm the suitability of the applied SAR and MET-pIRIR protocols. Typically, three quartz and feldspar aliquots from each sample were bleached for 65 s at 40 °C and for 100 s at 225 °C, respectively, in three consecutive steps under blue LEDs within the Risø reader before performing the tests. Blue LED bleaching was split into three individual steps to minimise unnecessary sensitivity changes that could arise during a single, prolonged bleaching period (Choi et al., 2009).
Thermal transfer tests were carried out on bleached quartz aliquots at preheat temperatures ranging from 150 to 210 °C. Average De values close to zero were measured at each temperature (Fig. 6a and b), indicating neither thermal transfer nor dependence on the preheat temperatures. Dose recovery ratios measured on quartz and feldspar aliquots are within 10 % of unity for all the tested quartz OSL preheat temperatures (Fig. 6c and d) and feldspar IR stimulation temperatures (Fig. 6e and f), confirming the reliability of both the measurement protocols. A preheat temperature of 190 °C was employed for the quartz measurements (Table 1). In both the thermal transfer and dose recovery tests on quartz aliquots, the De values remained consistent and showed no dependency on preheat temperatures within the range of 190 to 210 °C; this thermal stability confirms the preheating temperature of 190 °C is sufficient to remove thermally unstable luminescence components, ensuring accurate and reliable estimation of OSL ages through the SAR protocol. The resulting overdispersion (OD) values for the dose recovery tests from all investigated samples are < 2 % (Table S3 in the Supplement), significantly lower than the OD values observed for their natural De distribution (Tables 3, 4, and 5). This discrepancy may have resulted from partial bleaching and/or dosimetric heterogeneities. However, the OD of all the sand samples remains lower than 24 % with the exception of samples GHSL-F3, MOD1, and MOD2 (Tables 3 and 5). Although these three samples exhibited relatively high OD values, they did not show noticeable skewness in their natural De distribution (Figs. 10a–e and 13a–d). For these reasons, it is deemed appropriate to apply CAM in order to decipher reliable depositional ages from the samples, as also suggested in previous studies (e.g. Mueller et al., 2020). In contrast, the high OD obtained for the matrix samples suggests pronounced dosimetric heterogeneities. The average dose model (ADM; Guérin et al., 2017) was applied to the matrix samples to explore whether the OD could be attributed to spatially non-uniform radiation. The ADM De results from the matrix samples show minimal differences (1 %–6 %) compared to their CAM De results (Table S4). Given this consistency between these two models and considering that the ADM is more suitable for single-grain data (Guérin et al., 2017; Riedesel et al., 2025), the CAM results based on the De values are considered reliable and are reported throughout the paper for all the investigated samples.
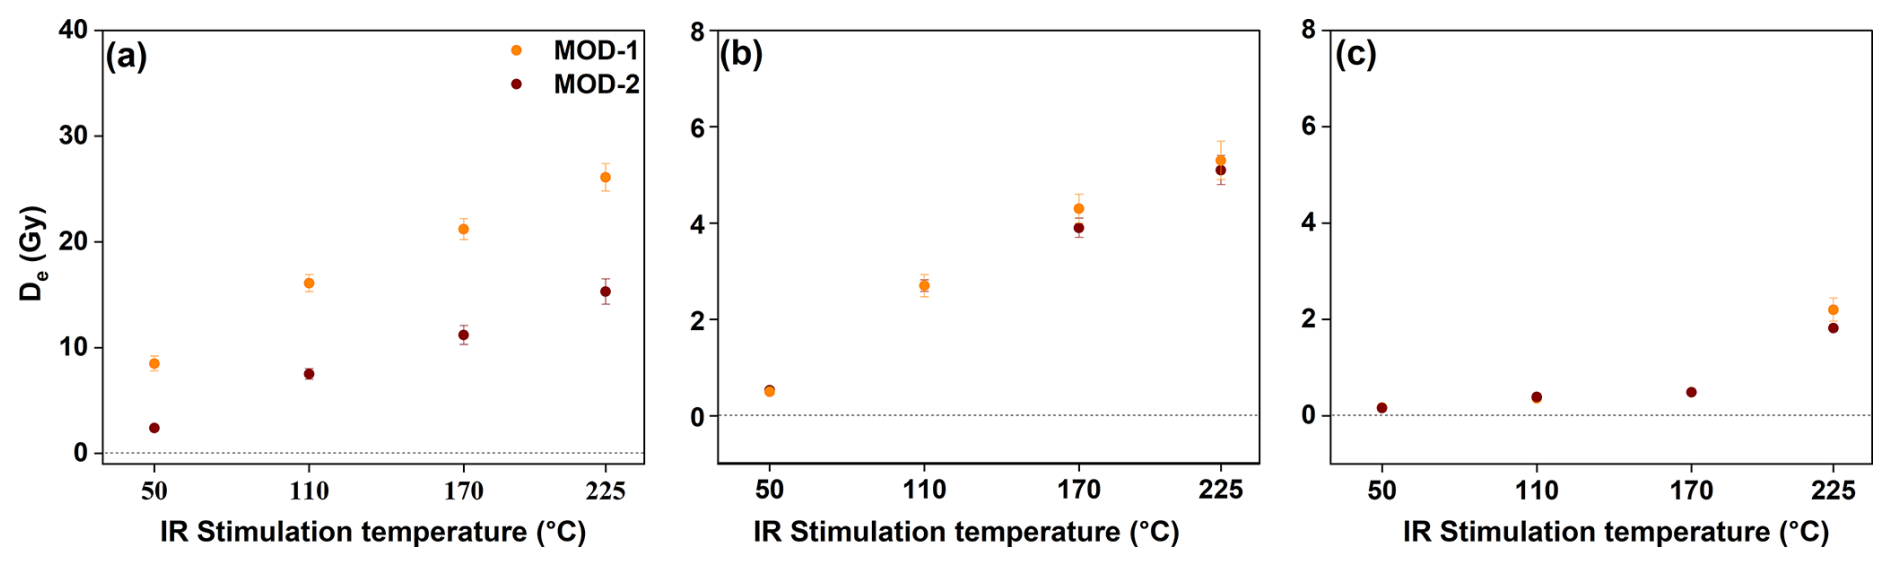
Figure 7Residual De values measured on non-bleached and bleached feldspar aliquots of modern sand samples at different IR stimulation temperatures. (a) Residual De values obtained on non-bleached feldspar aliquots, (b) residual De values obtained after bleaching under sunlight for ∼ 10 d, and (c) residual De values obtained after three consecutive steps of blue LED exposure within the Risø reader at 225 °C for 65 s. Each data point in panels (a), (b), and (c) represents a CAM De value.
4.2 Bleaching test on feldspar of modern sand samples
Modern analogues are typically used to assess the efficiency of pre-burial natural bleaching within sediments. In order to investigate the bleachability of the IRSL signals, residual De values were measured on natural (i.e. non-bleached) feldspar aliquots of modern sand samples (MOD1 and MOD2) as well as after artificially bleaching the two samples in two different ways (Fig. 7). Bleaching experiments over the modern samples were explicitly done in this study to gain further insights into unbleachable residual signals within the investigated older fluvial samples and to reveal the presence of substantial residual doses at high-temperature pIRIR signals (at 170 and 225 °C) obtained in the feldspar samples (detailed discussion in Sect. 5.1). To serve this purpose, from each modern sand sample, six feldspar aliquots were exposed and bleached under sunlight for ∼ 10 d (overcast weather in winter 2024 in Bern), while another six aliquots were bleached under blue LEDs within the Risø reader. The latter procedure involved three consecutive bleaching steps for each aliquot, with each step consisting of 100 s of blue LED stimulation at 225 °C. A CAM residual De was determined at different IR stimulation temperatures for the non-bleached MOD1 and MOD2 samples as well as following the two different bleaching procedures.
4.3 Fading estimation and fading correction
Anomalous fading measurements were conducted on three feldspar aliquots (previously used for natural De measurements or dose recovery tests) from each sand and matrix feldspar sample following Auclair et al. (2003). Aliquots were irradiated with a dose of ca. 80 Gy (RTSL1, RTSL2, RTSM), 240 Gy (LHSL1, LHSL2, LHSL3, LHSM), and 1040 Gy (GHSL1, GHSL2, GHSL3, GHSM), and storage periods of between 0 s and 3 h were applied. The fading rate for each sand and matrix samples was determined by assessing the percentage of signal loss with time relative to a 2 d reference period (g2 d as % per decade). Half of the irradiation time (∼ 1 h) was incorporated into the calculation of the delay time to determine the fading rate for the sand and matrix samples of Griesheim (Auclair et al., 2003; Polymeris et al., 2022; Tsukamoto and Duller, 2008). g2 d values were calculated for each IR stimulation temperature by fitting a regression line to the normalised signal intensities () over time since irradiation, using the analyse_FadingMeasurement function in the R package “Luminescence” version 0.9.23 (Kreutzer et al., 2012). At stimulation temperatures of 110, 170, and 225 °C, the normalised luminescence intensity from the first prompt IRSL readout (i.e. after zero delay time) was 5 %–10 % higher than the intensities of following prompt signal readouts (Fig. 8 and Figs. S1–S5 in the Supplement). These outliers resulted in a higher slope of the fading regression lines and consequently higher fading rates (red panels in Figs. 8, S1–S5) than the ones obtained when excluding the first prompt measurements (blue panels in Figs. 8, S1–S5). Therefore, the exclusion of the first prompt measurements resulted in a significant decrease in g values, especially for the higher temperatures (at 170 and 225 °C) for samples from the Lingolsheim (LHSL1, LHSL2, LHSL3, and LHSM) and Griesheim (GHSL1, GHSL2, GHSL3, and GHSM) terraces (Fig. 9). We interpret the elevated first IRSL measurement as a result of the recombination of unstable electrons within the most proximal recombination centres (Riedesel et al., 2021). Therefore, we chose to consider g values calculated without the first prompt measurements for fading correction (see Sect. 4.2, 4.3, and 4.4). Furthermore, it is important to note that the 2 d normalised g values are reported solely for comparative purposes, i.e. to illustrate the differences in fading rates among samples from different terraces and across different IR stimulation temperatures. However, all the fading-corrected ages presented in this study were calculated using the non-normalised g values. Fading correction was performed using two different approaches, depending on the samples analysed. For samples from the Roethig and Lingolsheim terraces, whose De values fall within the linear part of the dose response curve (DRC), fading correction followed the method of Huntley and Lamothe (2001) using the calc_ FadingCorr function from the R package “Luminescence” (Kreutzer, 2020). For samples from the Griesheim terrace, where De values extend beyond the linear part of the DRC, the approach of Kars et al. (2008) was applied using the calc_Huntley2006 function (King and Burow, 2019).
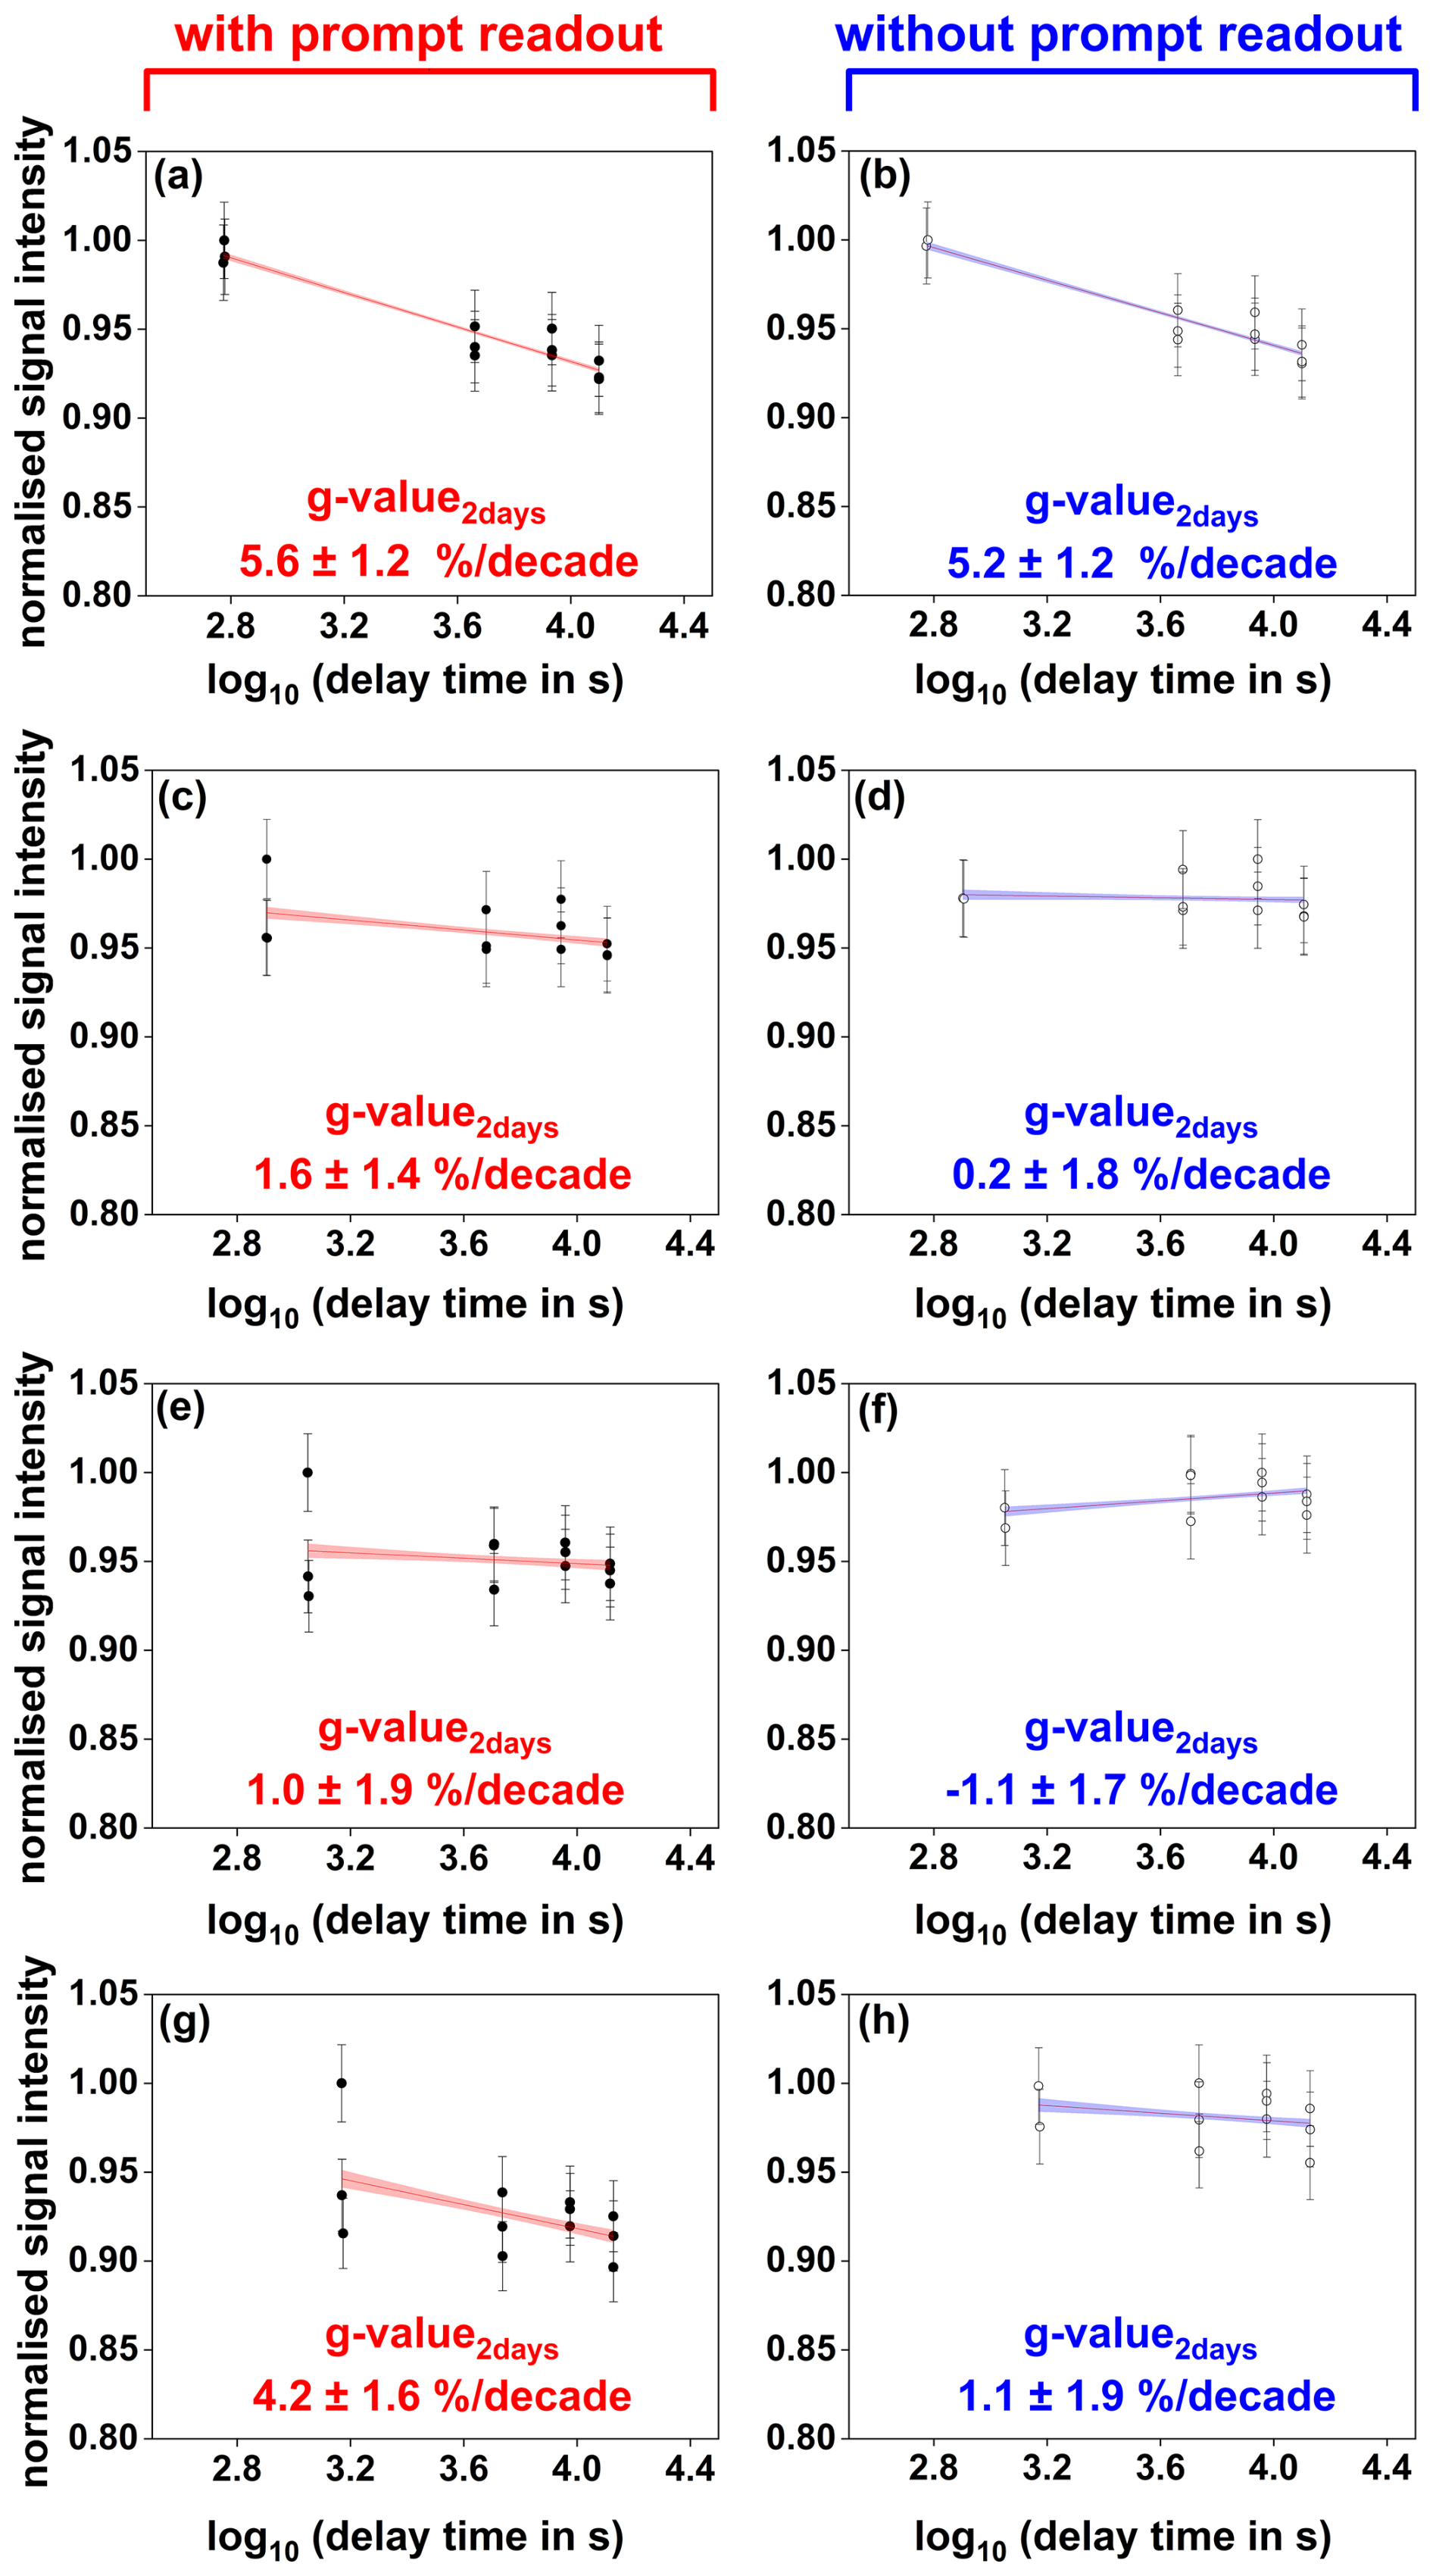
Figure 8Anomalous fading measurements obtained for different IR stimulation temperatures with or without including the first prompt measurement. Shown are the results of a representative aliquot of sample RTSL1. Normalised signal intensities are plotted as a function of time since irradiation for IR50 (a, b), pIR110 (c, d), pIR170 (e, f), and pIR225 (g, h) stimulations. Panels (a), (c), (e), and (g) show the linear regression and corresponding fading rates (g-value2 d) obtained including all signal readouts measured at different delay times, while panels (b), (d), (f), and (h) exclude the first prompt measurement. Fading rates were calculated using the analyse_FadingMeasurement function of the R package “Luminescence” version 0.9.23 (Kreutzer et al., 2012).
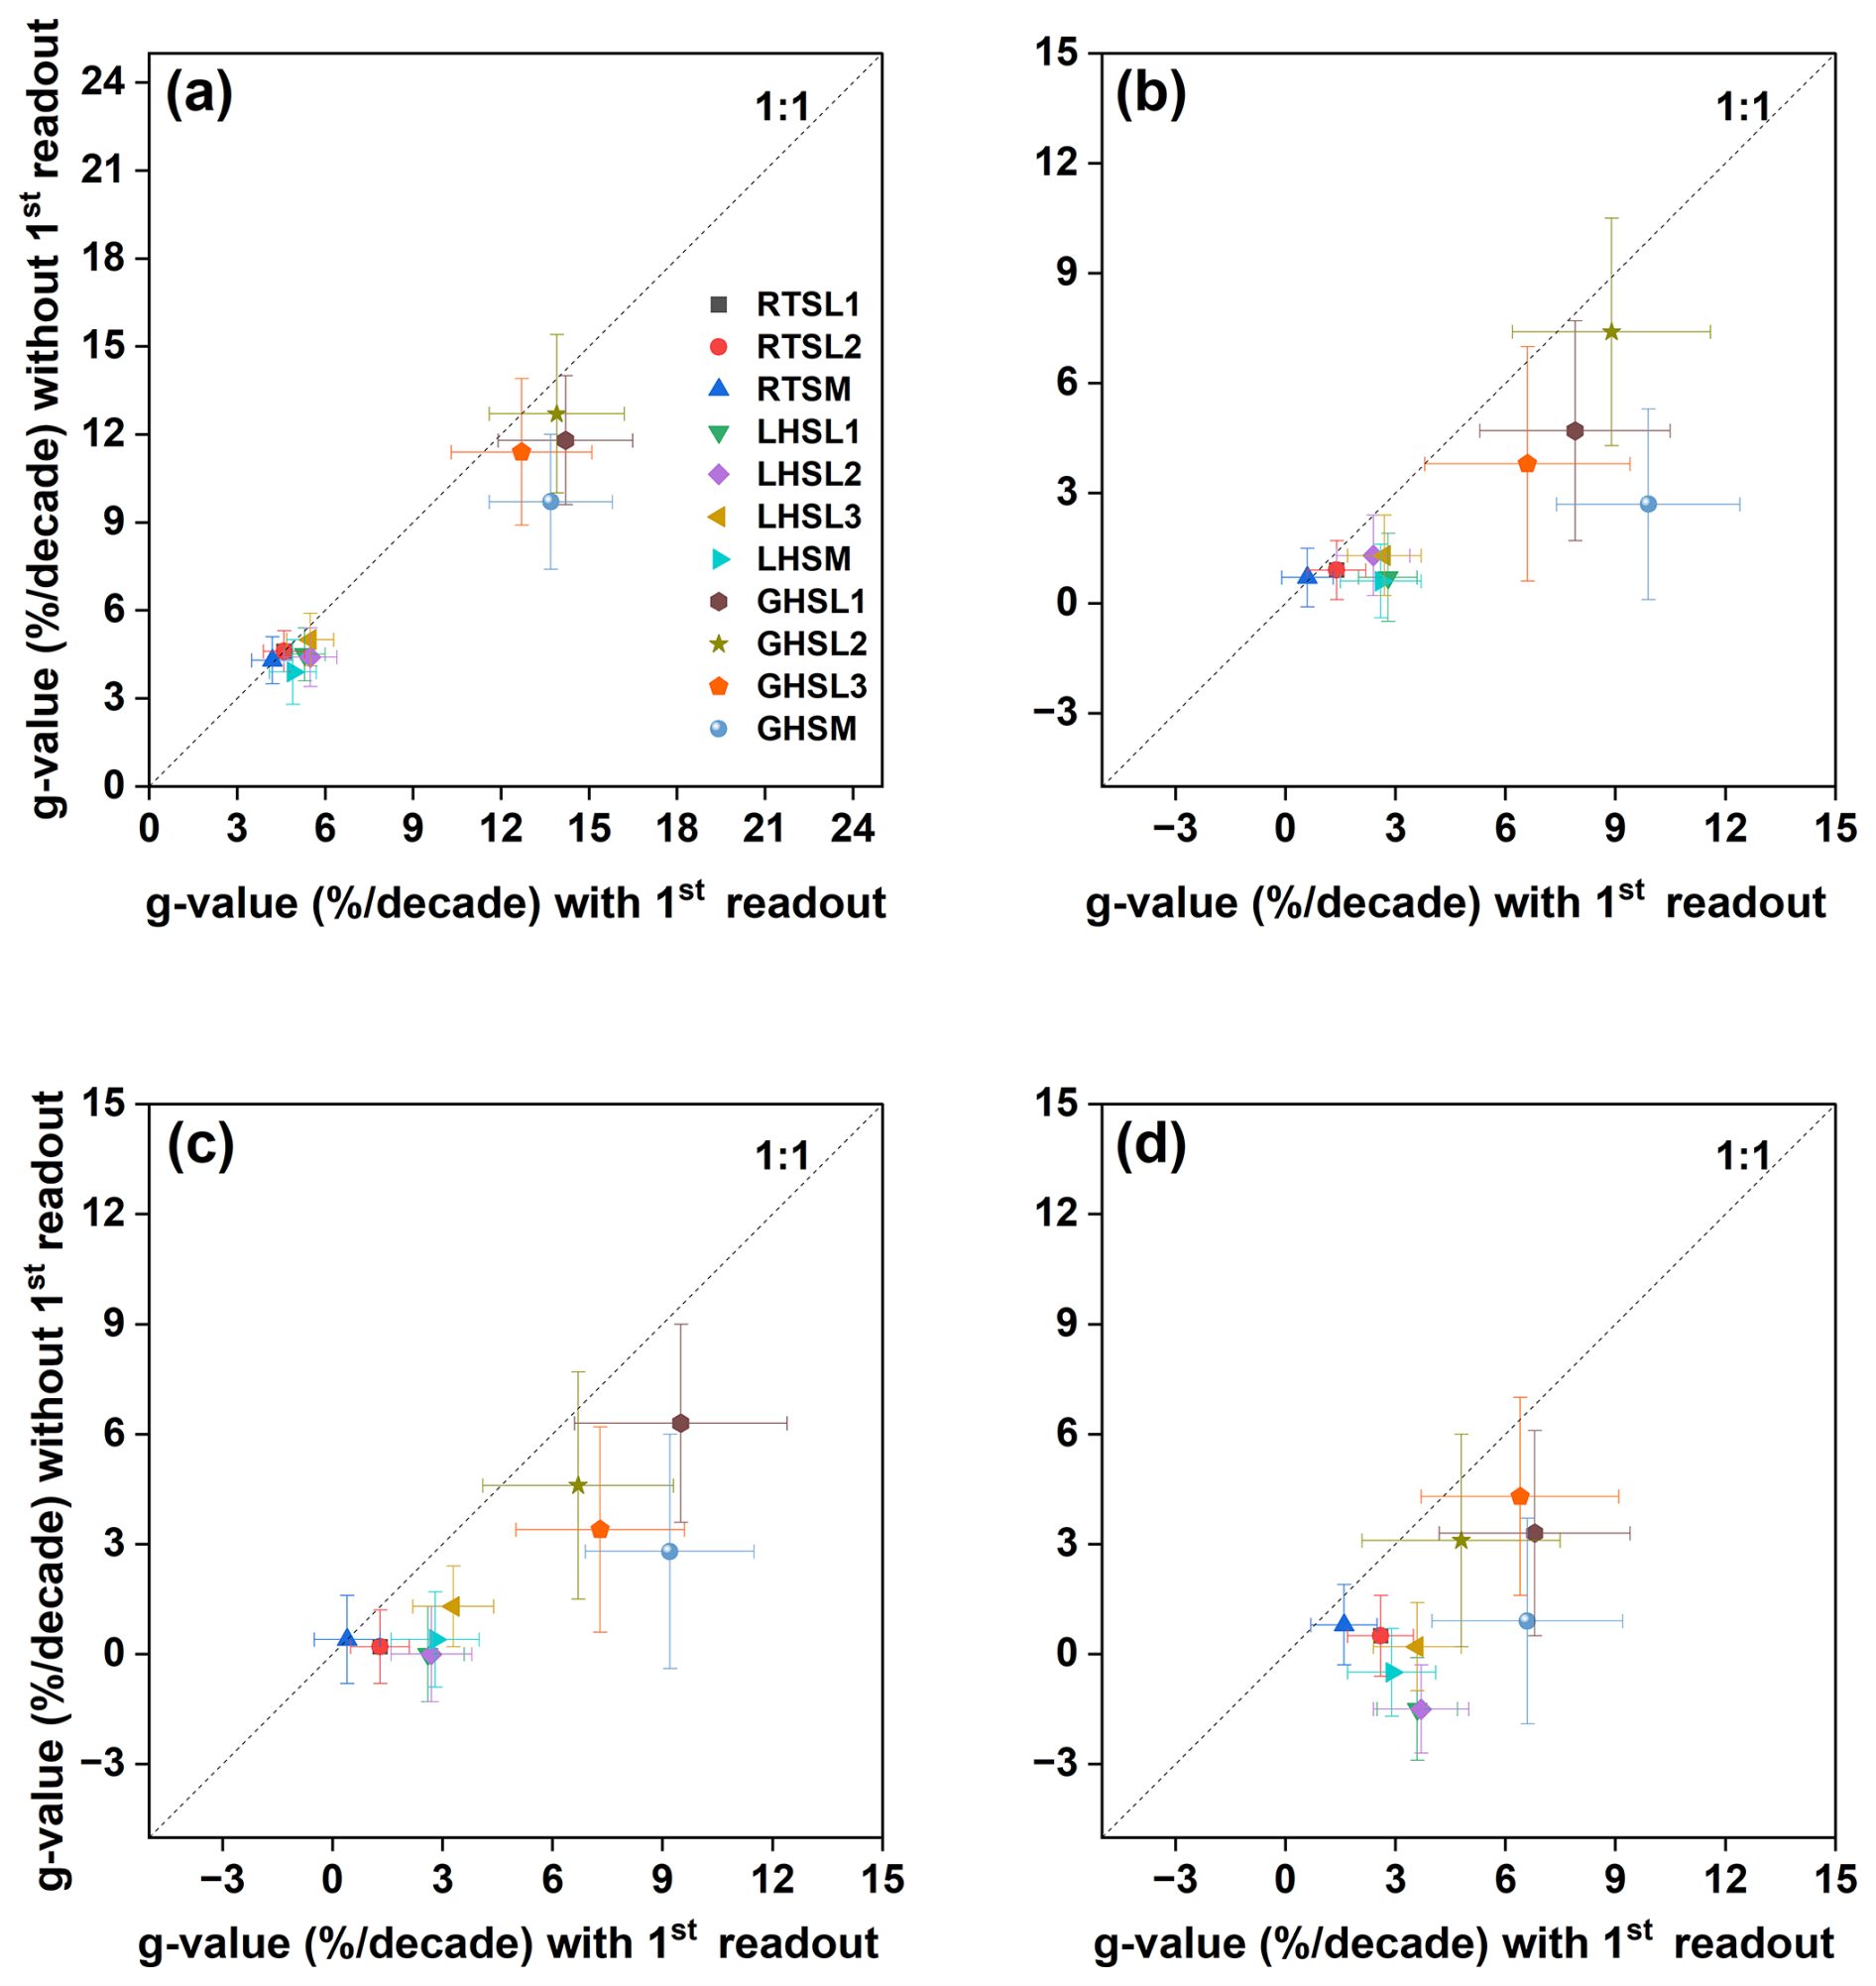
Figure 9Comparison of fading rates obtained with or without including the first prompt luminescence measurement. g-value2 d results calculated by combining the fading measurements of three aliquots per sample are shown for the different IR stimulation temperatures: (a) IR50, (b) pIR110, (c) pIR170, and (d) pIR225. For each sample, fading measurements from three aliquots were combined into a single dataset comprising delay time (s), normalised signal (), and signal-associated errors. The combined dataset was used to calculate a single g-value2 d using the R package “Luminescence” version 0.9.23. To assess the fading rate without prompt measurements, the prompt data points were manually removed from each aliquot's fading dataset, and based on the remaining data, g-value2 d was recalculated.
4.4 Luminescence results from modern sand
Luminescence results from modern riverbed sand samples (MOD1 and MOD2) are reported in Figs. 7 and 10 and Table 3. Results from the feldspar residual tests reveal two distinct patterns depending on the bleaching method used before measurement (Fig. 7). For both samples, residual De values after sunlight bleaching increase with IR stimulation temperature, ranging from ∼ 0.2 Gy for IR50 to ∼ 5 Gy for pIR225 (Fig. 7a). In contrast, lower residuals are measured after bleaching under blue LED, with residual De values of ∼ 0.2 Gy for IR50 to ∼ 2 Gy for the pIR225 signal (Fig. 7b).
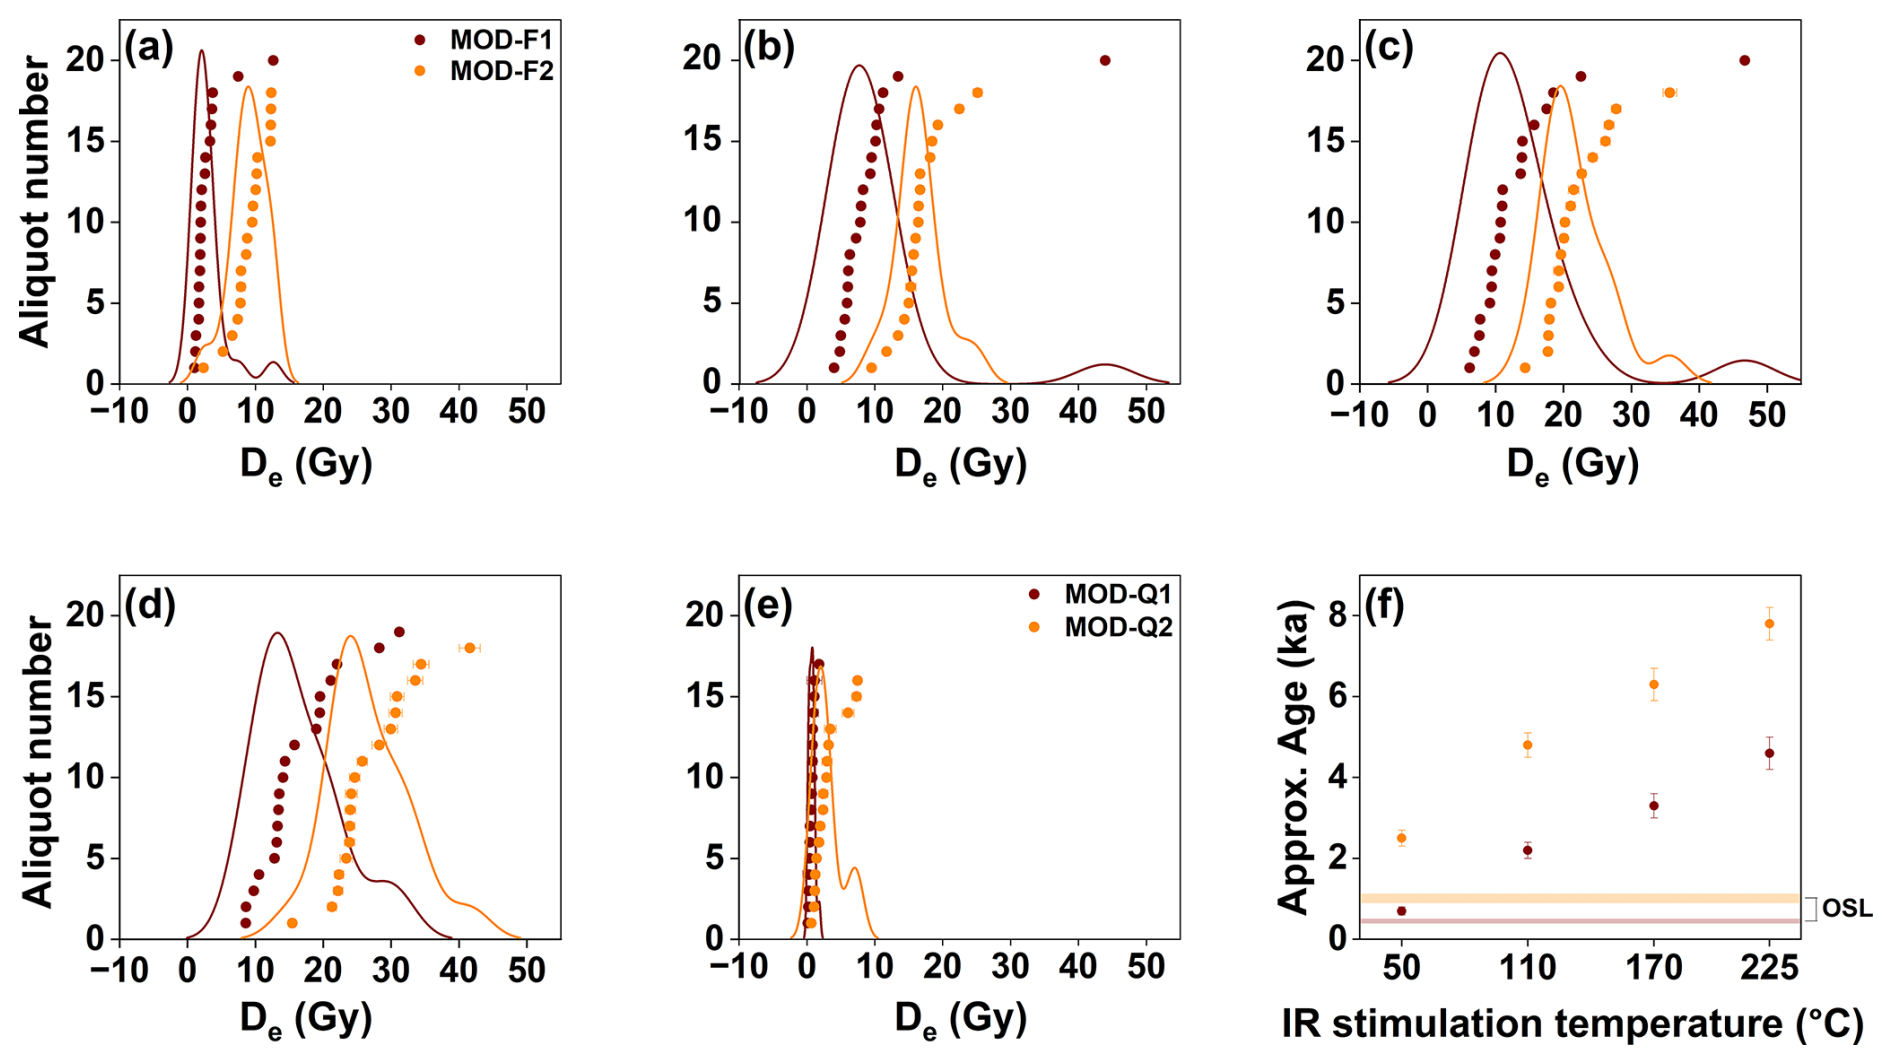
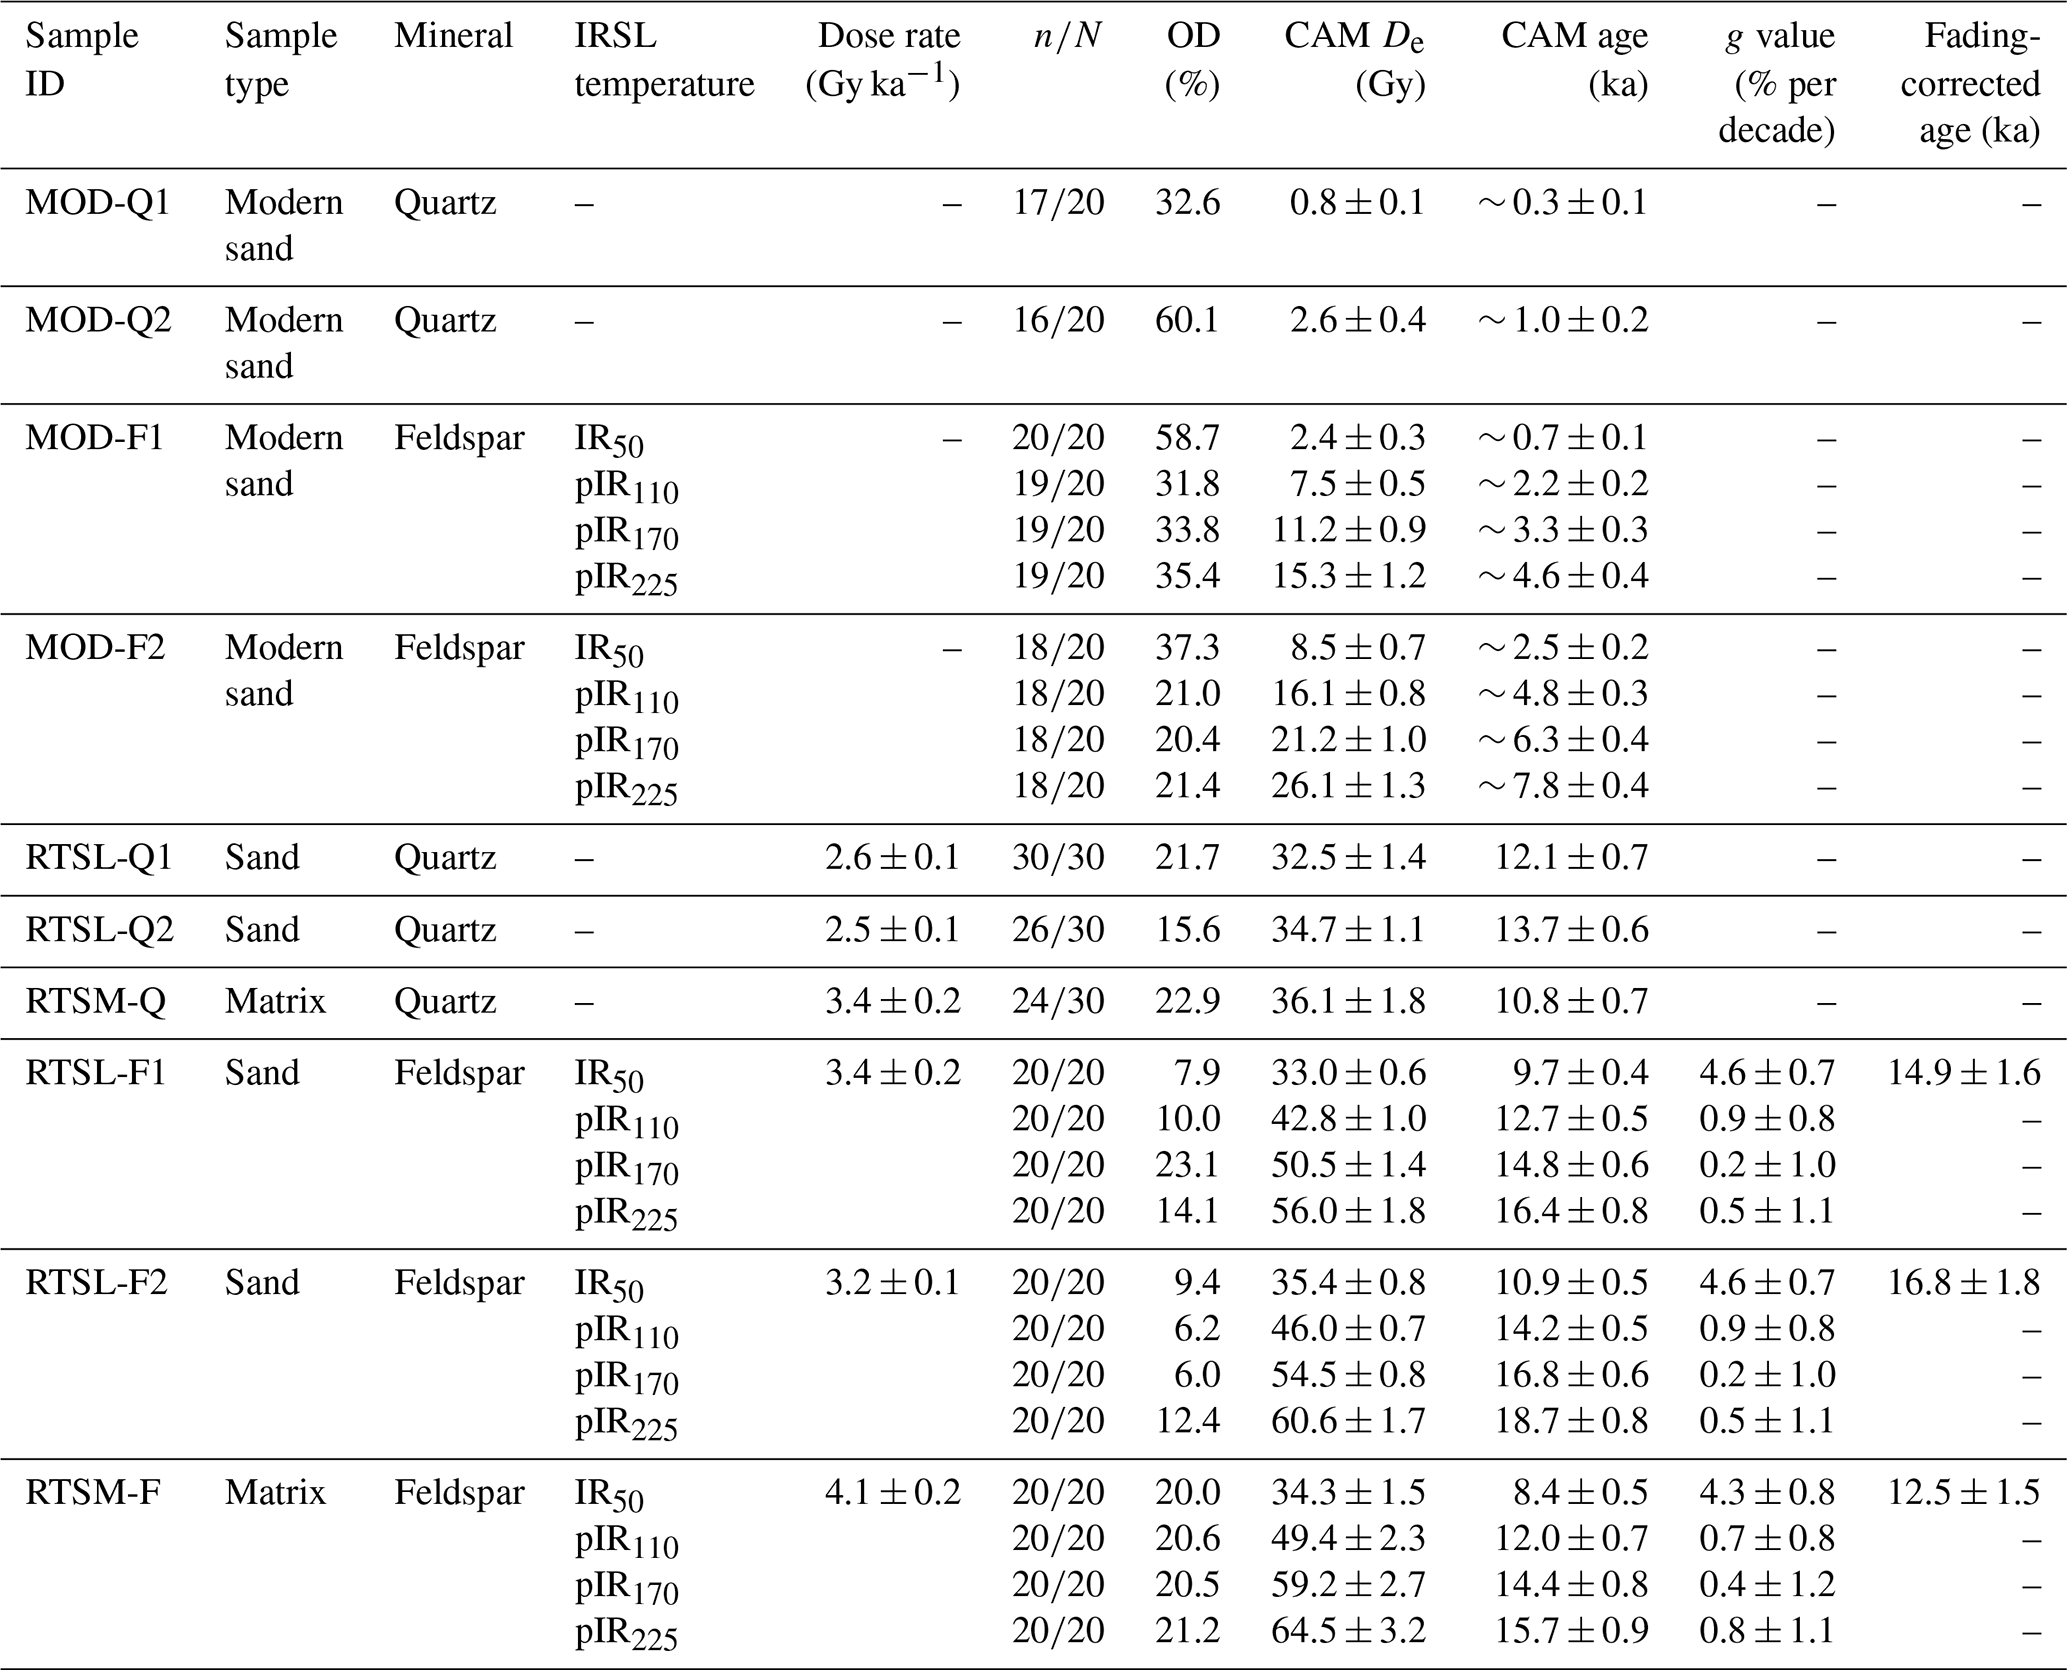
Figure 10Luminescence dating results for the two modern riverbed sand samples (MOD1, MOD2). (a–d) Feldspar MET-pIRIR De distributions for the IR50, pIR110, pIR170, and pIR225 signals. (e) Quartz OSL De distributions. (f) Comparison between quartz and feldspar approx. age estimates (i.e. calculated with dose rate from RTSL1). Each data point in panel (f) represents approx. IRSL and post-IRSL CAM ages from MOD1 and MOD2. Corresponding approx. OSL ages are shown by transparent colour bars with the same colour scheme; the height of each colour bar indicates the 1σ uncertainty associated with the corresponding OSL age.
Both OSL and MET-pIRIR De distributions of natural (i.e. unbleached) MOD1 (surface) and MOD2 (sub-surface) samples show significant overdispersion (30 %–60 %; Table 3). OSL measurements reveal relatively low De values, with slightly lower OSL CAM De for MOD1 (∼ 0.8 Gy) than for MOD2 (∼ 2.6 Gy; Fig. 10e and Table 3). Results from MET-pIRIR measurements show larger differences between the MOD1 and MOD2 samples, with MOD2 exhibiting higher De values than MOD1 (Fig. 10, Table 3). Moreover, an increase in De is observed for both samples for higher IR stimulation temperature. The IR50 CAM De values are ∼ 2.4 Gy for MOD1 and ∼ 8.5 Gy for MOD2, while the pIR225 CAM De values are ∼ 15.3 and ∼ 26.1 Gy, respectively.
Dose rates were not determined for sample MOD1 and MOD2 as the analysis of these modern riverbed samples was primarily focused on investigating the extent of signal resetting rather than on age estimation. Nevertheless, quartz and feldspar ages of MOD1 and MOD2 were estimated using the dose rate from one of the Roethig terrace samples (RTSL1; quartz dose rate: 2.6 ± 0.1 Gy ka−1; feldspar: 3.4 ± 0.1 Gy ka−1). Approximate OSL ages of ∼ 0.3 and ∼ 1.0 ka were inferred for MOD1 and MOD2, respectively (Table 3). With the exception of the IR50 age of MOD1, all other MET-pIRIR age estimates from both modern sand samples are significantly higher than the corresponding quartz ages (Fig. 10f). MOD1 yields approximate ages of ∼ 0.7 ka for IR50, ∼ 2.2 ka for pIR110, ∼ 3.3 ka for pIR170, and ∼ 4.6 ka for pIR225, while MOD2 shows considerably higher MET-pIRIR ages, ranging from ∼ 2.5 ka for IR50 to ∼ 4.8, ∼ 6.3, and ∼ 7.8 ka for pIR110, pIR170, and pIR225, respectively (Table 3).
4.5 Luminescence dating results from the Roethig terrace
OSL and MET-pIRIR luminescence dating results from the sand lens (RTSL1 and RTSL2) and sandy matrix (RTSM) samples obtained from the Roethig terrace are summarised in Table 3 and Fig. 11. Similar quartz OSL De distributions (with 16 %–23 % overdispersion) are observed across the three samples, resulting in comparable CAM De values of ∼ 32–36 Gy (Fig. 11e). Likewise, feldspar MET-pIRIR De distributions exhibit low overdispersion (OD: 6 %–23 %) and are consistent between the three samples at each stimulation temperature, with slightly higher De values for samples RTSL2 and RTSM compared to RTSL1 for the pIR170 and pIR225 signals (Fig. 11c and d). Feldspar CAM De values follow an increasing trend with stimulation temperature in the three samples. IR50 CAM De values range from ∼ 33–35 Gy, pIR110 values range from ∼ 43–49 Gy, pIR170 values range from ∼ 51–59 Gy, and pIR225 values range from ∼ 56–64 Gy.
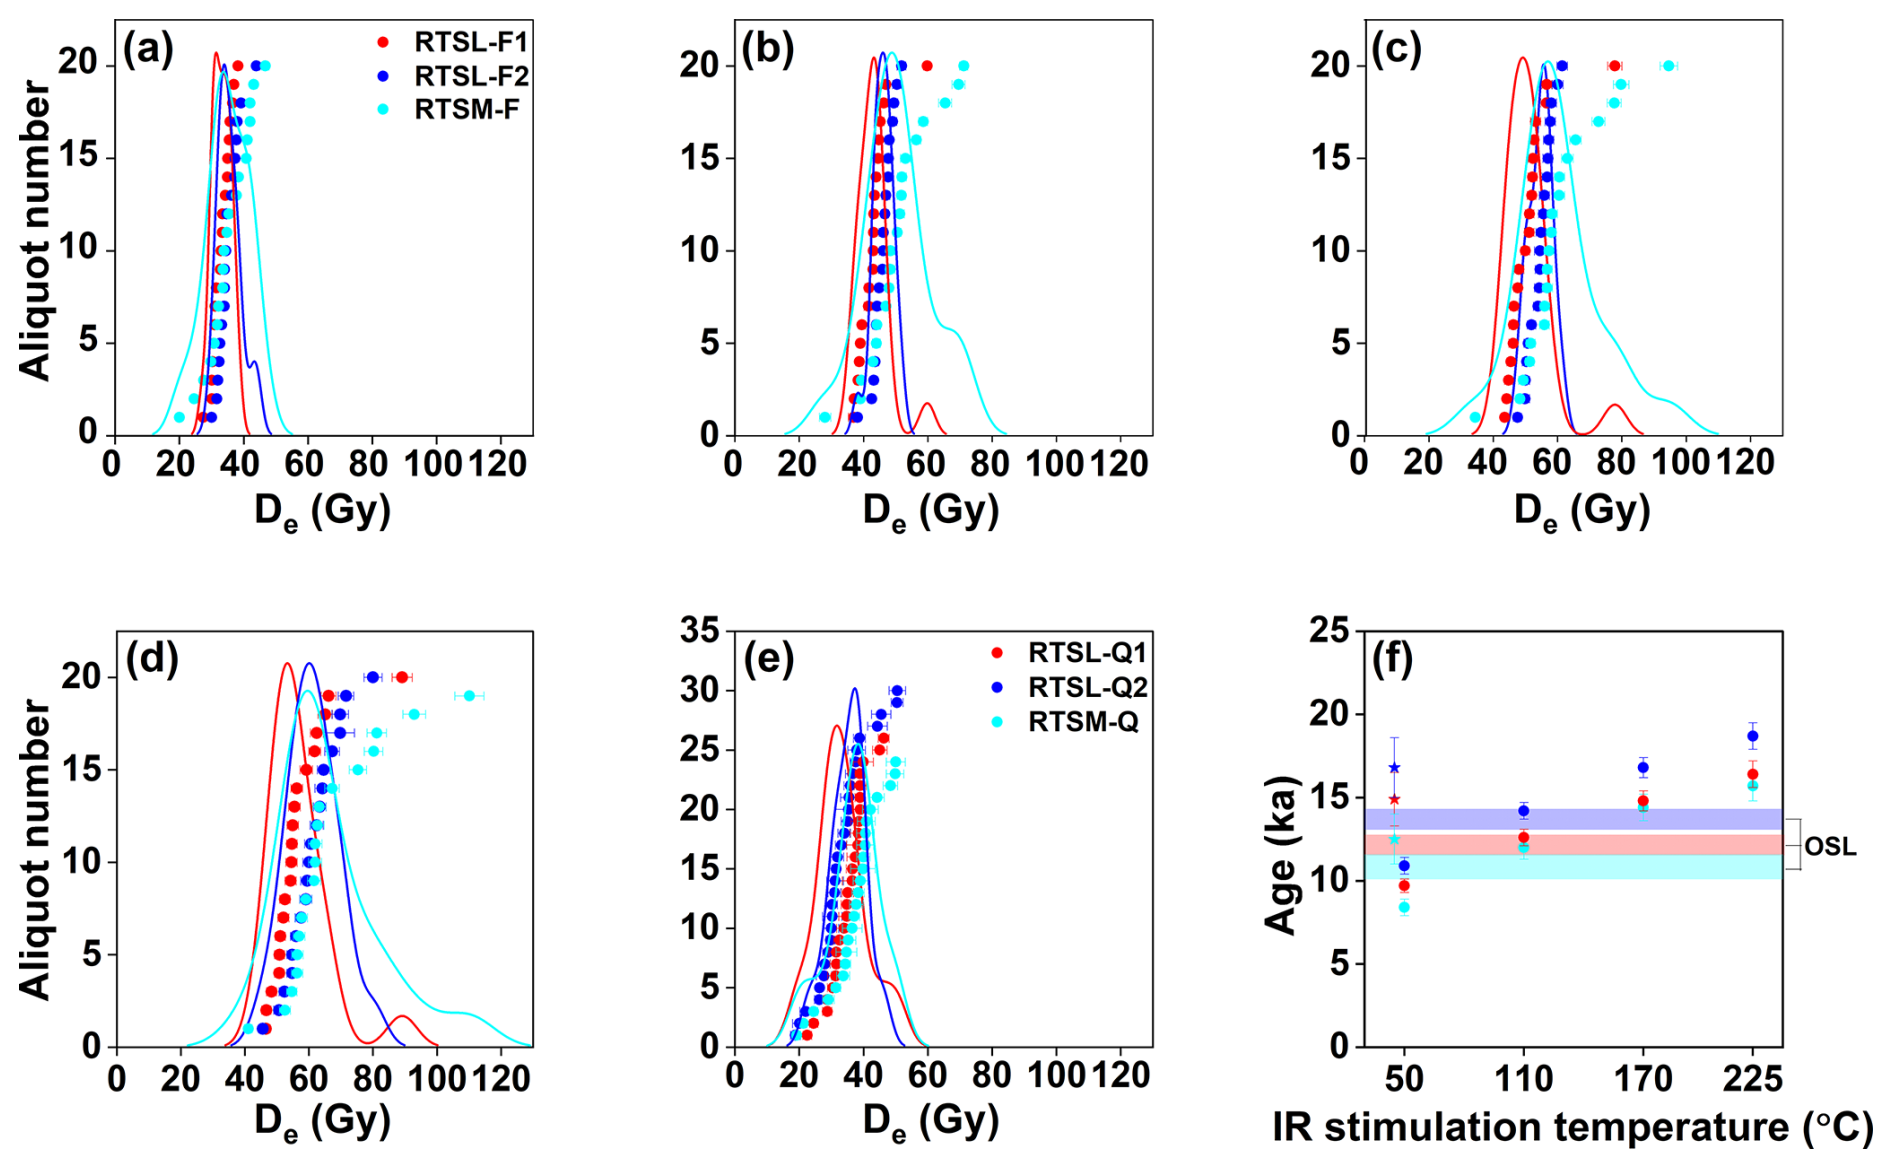
Figure 11Luminescence dating results for sand and matrix samples from the Roethig terrace (RTSL1, RTSL2, and RTSM). (a–d) MET-pIRIR De distributions for IR50, pIR110, pIR170, and pIR225 signals. (e) Quartz OSL De distributions. (f) Comparison between quartz and feldspar ages of samples RTSL1, RTSL2, and RTSM. Each data point represents the non-fading-corrected feldspar CAM age at different IR stimulation temperatures. Additionally, fading-corrected IR50 ages are shown with star symbols. OSL ages are shown as transparent colour bars with the same sample colour scheme; the height of each colour bar indicates the 1σ uncertainty associated with the corresponding OSL age.
Table 2Summary of radionuclide contents and total dose rates used for luminescence age determination of the sand and sandy matrix samples from three fluvial terraces. For feldspar dose rate calculation, an internal potassium content of 12.5 ± 0.5 % has been assumed following Huntley and Baril (1997).
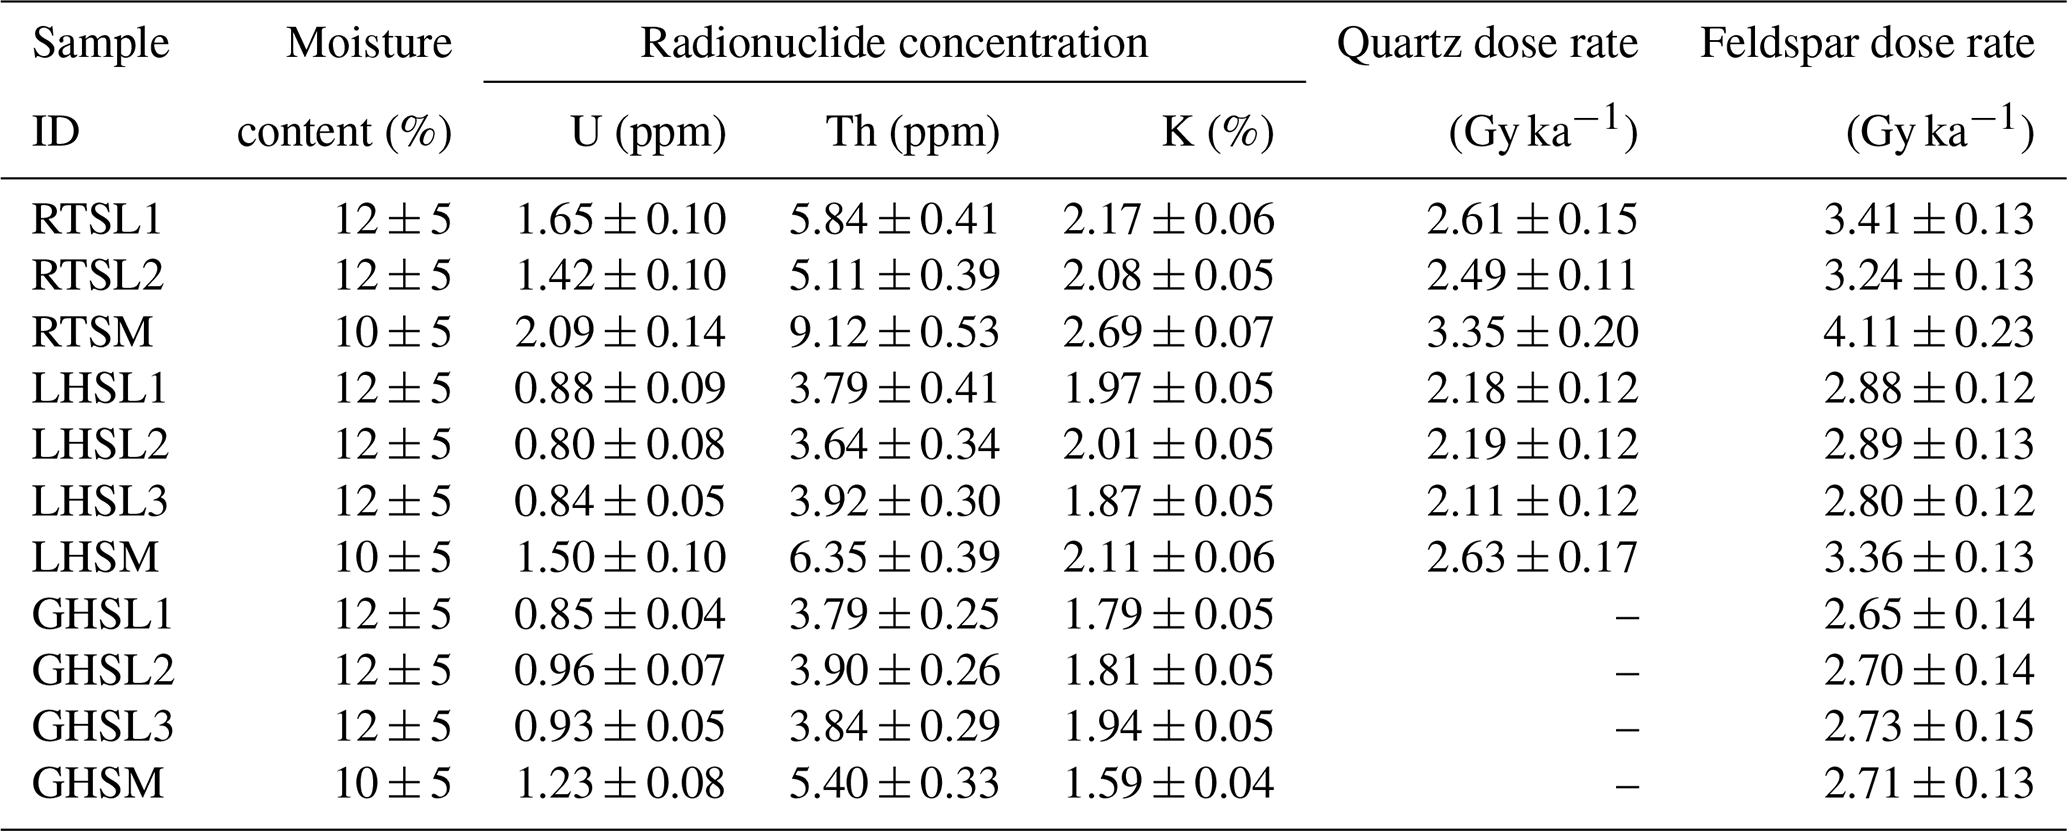
Radionuclide concentrations measured on the three samples are reported in Table 2. The matrix sample (RTSM) shows slightly higher radionuclide concentrations, resulting in quartz (3.4 ± 0.2 Gy ka−1) and feldspar (4.1 ± 0.2 Gy ka−1) dose rates that are approximately 25 % higher than those of the sand lens samples (quartz: ∼ 2.5–2.6 Gy ka−1; feldspar: ∼ 3.2–3.4 Gy ka−1).
Table 3Luminescence dating results for modern riverbed sand samples (MOD1 and MOD2) as well as sand and matrix samples from the Roethig terrace (RTSL1, RTSL2, and RTSM). = number of accepted over number of measured aliquots; OD = overdispersion; CAM = central age model (Galbraith et al., 1999). The reported g-value2 d results were estimated by excluding the first prompt measurement.
Feldspar fading rates (g2 d) estimated after excluding the first prompt measurement (see Sect. 3.4) are reported in Table 3. While significant fading rates were measured for the IR50 signal of all three samples (∼ 4.3 %–4.6 % per decade), the pIRIR signals exhibited much lower fading rates: ∼ 0.7 %–0.9 % per decade for pIR110, ∼ 0.2 %–0.5 % per decade for pIR170, and ∼ 0.5 %–0.8 % per decade for pIR225. According to earlier studies, a fading rate < 1.5 % per decade is considered negligible as it might result from measurement artefacts (e.g. Buylaert et al., 2012; Thomsen et al., 2008). Therefore, only the IR50 ages are corrected for fading (Thiel et al., 2011; Serra et al., 2025), while pIRIR fading-corrected ages (Table S1) are not considered further in the paper.
For the Roethig terrace (T4), quartz CAM ages range between ∼ 11–14 ka, while feldspar CAM ages vary between ∼ 8–11 ka for IR50, ∼ 12–14 ka for pIR110, ∼ 14–17 ka for pIR170, and ∼ 16–19 ka for pIR225. Fading-corrected IR50 ages range from ∼ 13–17 ka (Fig. 11f, Table 3).
4.6 Luminescence dating results from the Lingolsheim terrace
OSL and MET-pIRIR De distributions from sand (LHSL1, LHSL2, and LHSL3) and matrix (LHSM) samples from the Lingolsheim terrace are illustrated in Fig. 12 and Table 4. Moreover, a characteristic OSL decay curve and a DRC from a representative LHSL1 quartz aliquot are shown in Fig. 14a and b, respectively. Quartz OSL De distributions of samples LHSL1, LHSL2, and LHSM are similar, yielding comparable CAM De values of ∼ 80–86 Gy (Fig. 12e). In contrast, the De value of the LHSL3 sample, retrieved from a higher stratigraphic layer (Fig. 4b), is lower and therefore results in a CAM De of ∼ 60 Gy. Feldspar MET-pIRIR De distributions and corresponding CAM De values are consistent between LHSL1 and LHSL2 across all stimulation temperatures, while LHSL3 exhibits lower values and LHSM reveals higher values (Table 4). Moreover, feldspar CAM De values show an increasing trend with stimulation temperature across the four samples.
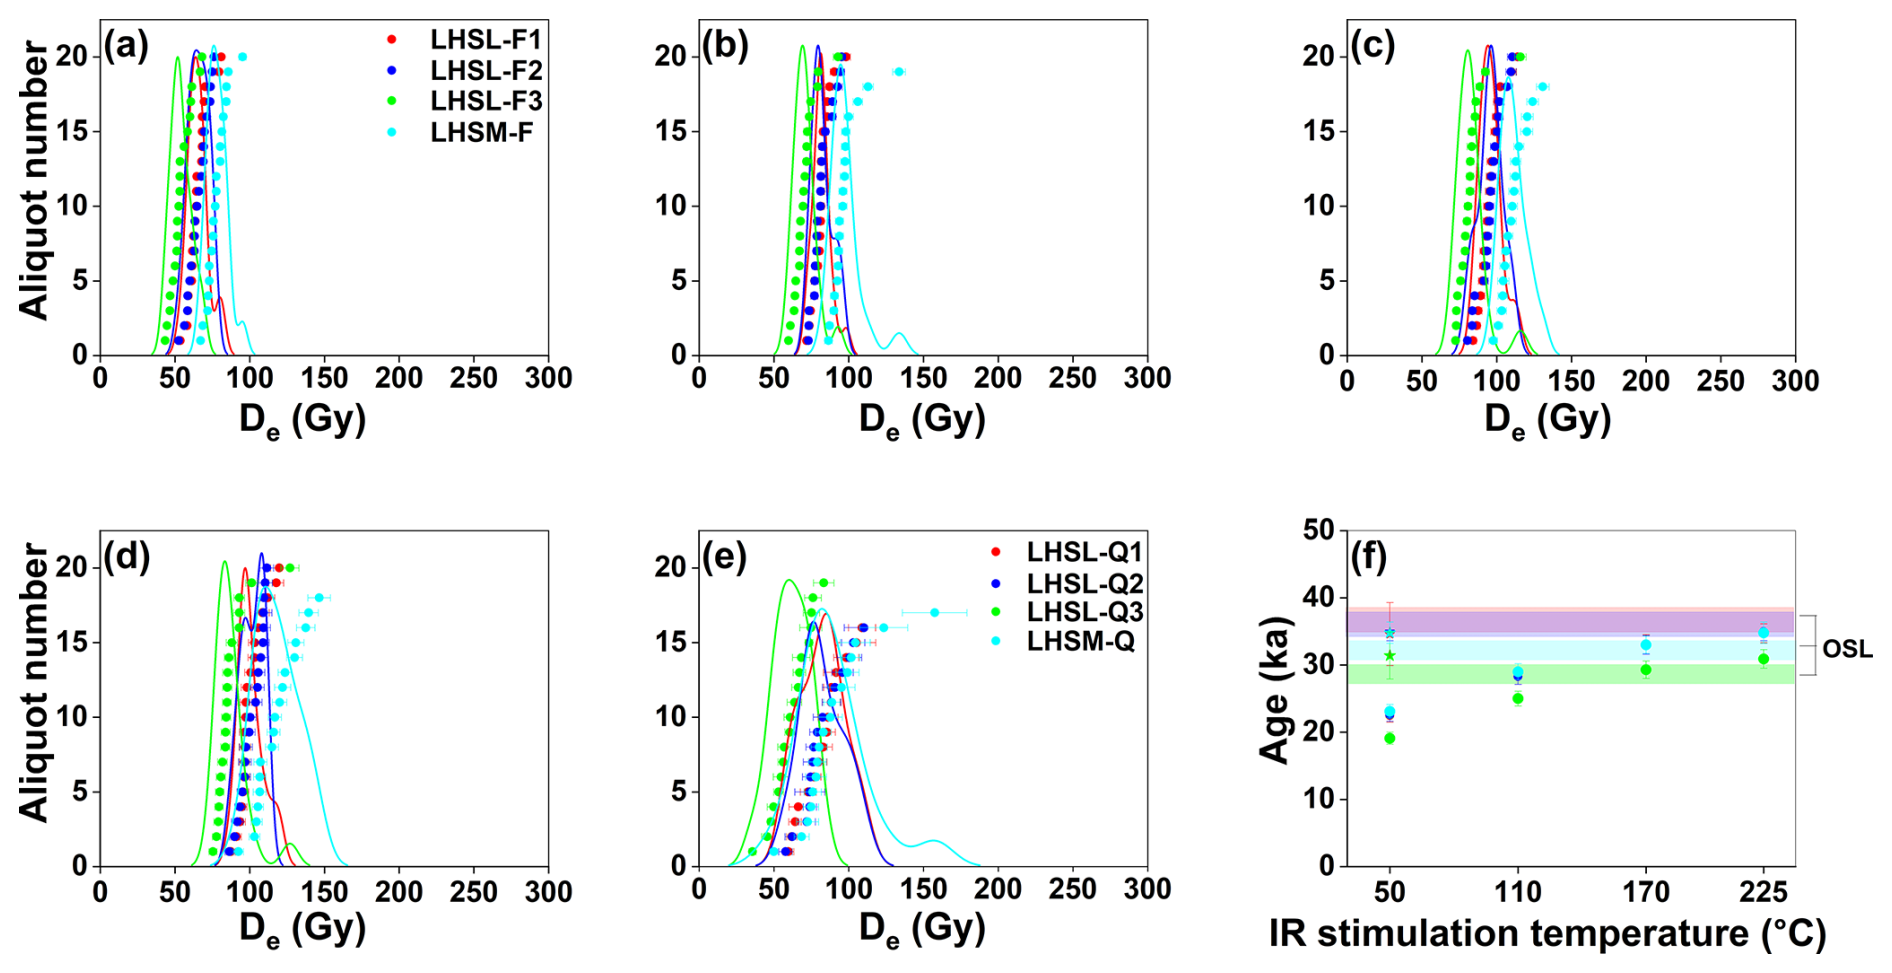
Figure 12Luminescence dating results for sand and matrix samples from the Lingolsheim terrace (LHSL1, LHSL2, LHSL3, and LHSM). (a–d) Feldspar MET-pIRIR De distributions for IR50, pIR110, pIR170, and pIR225 stimulations. (e) Quartz OSL De distributions. (f) Comparison between quartz and feldspar ages of samples LHSL1, LHSL2, LHSL3, and LHSM. Each data point represents the non-fading-corrected feldspar CAM age at different IR stimulation temperatures. Additionally, fading-corrected IR50 ages are indicated by star symbols. OSL ages are shown as transparent colour bars with the same sample colour scheme; each colour bar indicates the 1σ uncertainty associated with the corresponding OSL age.
Table 4Luminescence dating results from the sand and matrix samples from the Lingolsheim terrace (LHSL1, LHSL2, LHSL3, and LHSM). = number of accepted over number of measured aliquots; OD = overdispersion; CAM = central age model (Galbraith et al., 1999). The reported g-value2 d results were estimated by excluding the first prompt measurement.
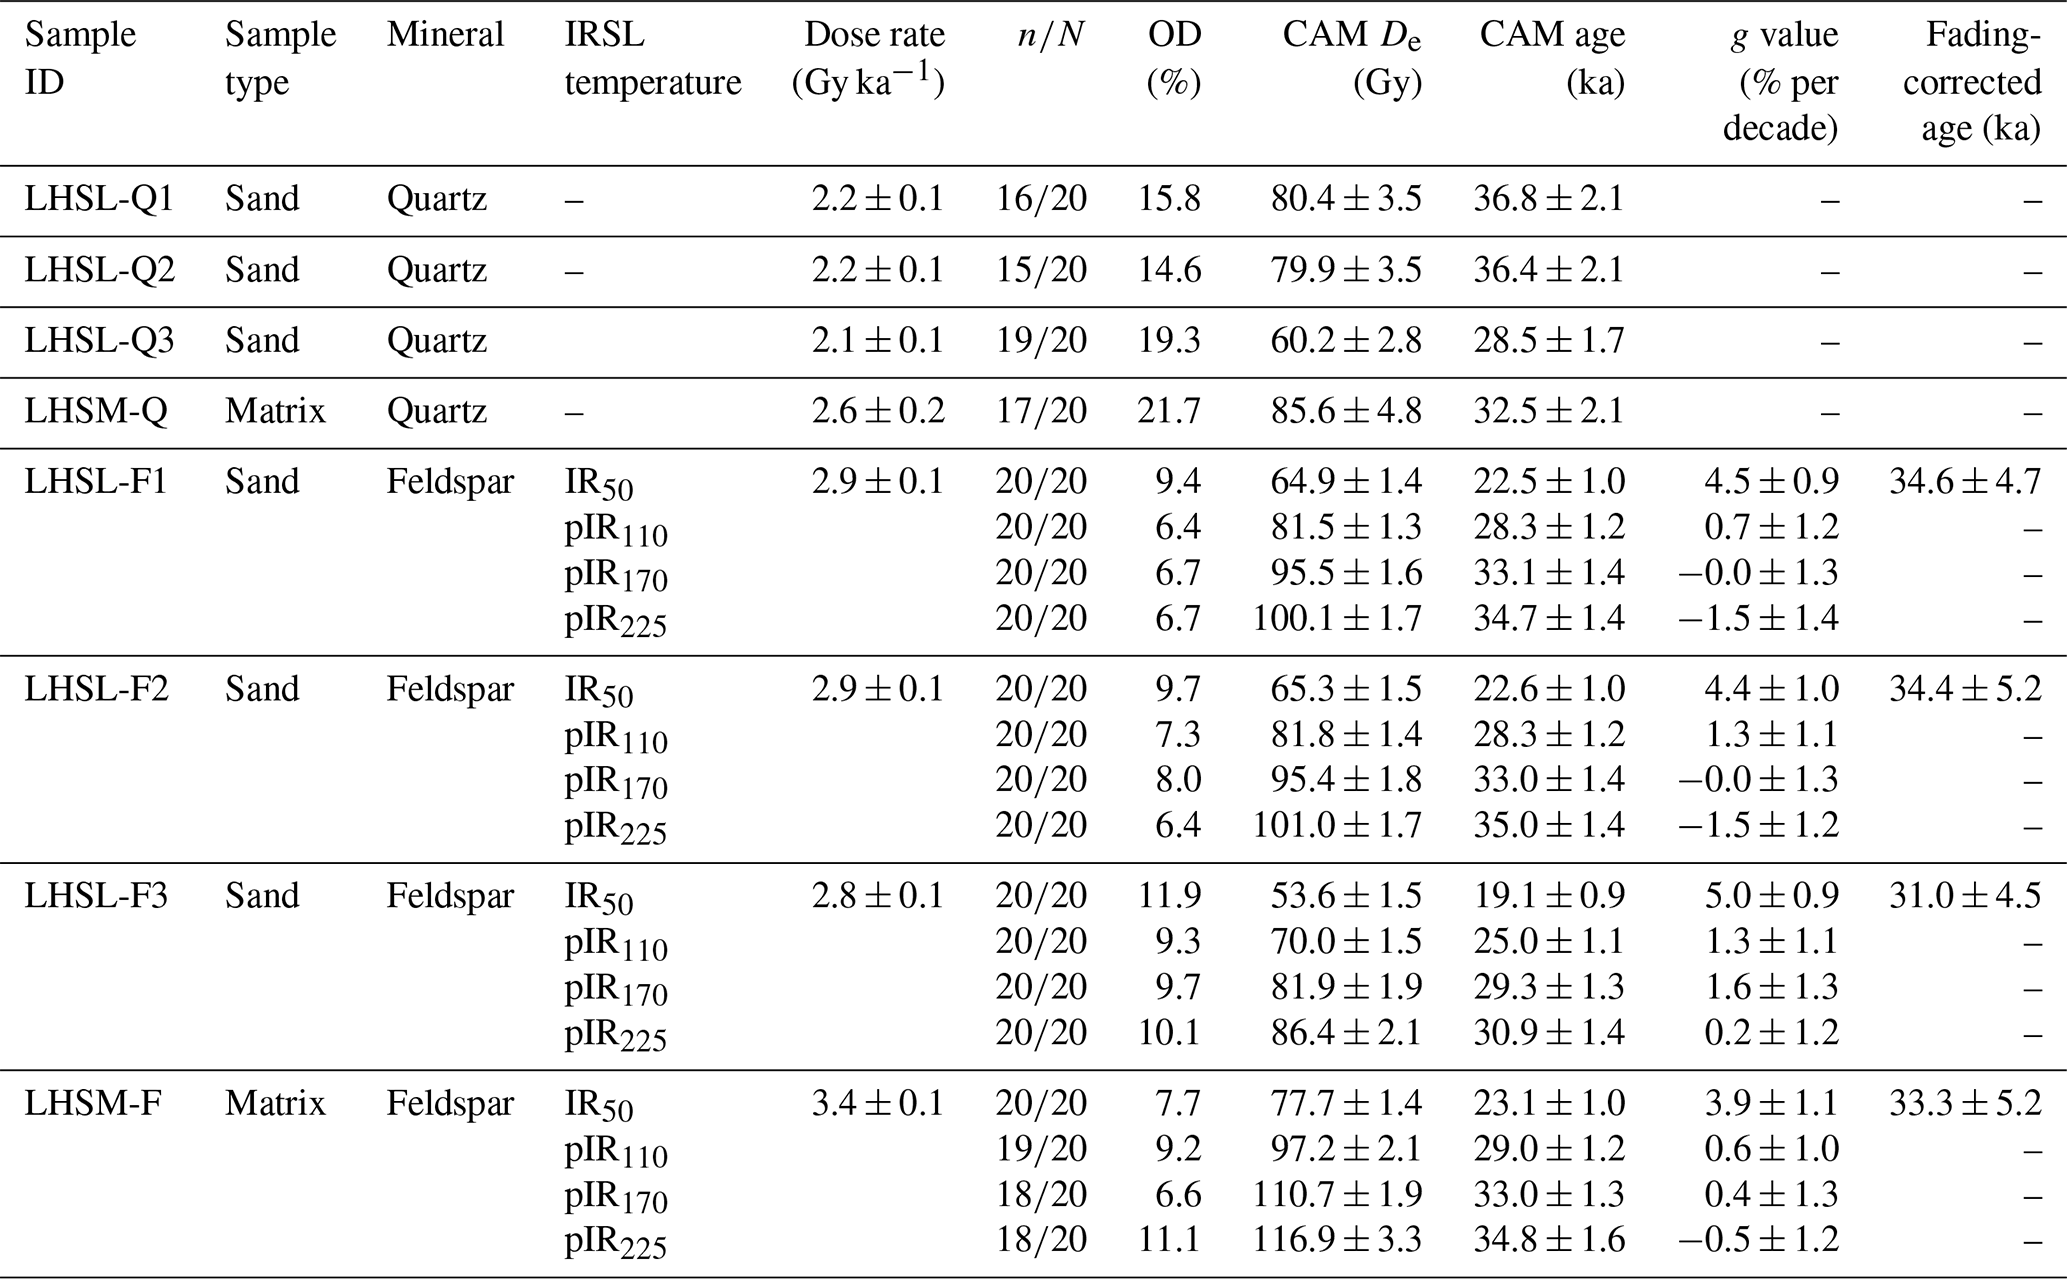
Radionuclide concentrations measured in the four samples are reported in Table 2. The three sandy samples exhibit similar radionuclide concentrations, leading to quartz and feldspar dose rates of approximately 2.2 and 2.8 Gy ka−1, respectively. In contrast, the matrix sample shows higher radionuclide concentrations, resulting in ∼ 18 %–20 % higher dose rates (2.6 ± 0.2 Gy ka−1 for quartz and 3.4 ± 0.1 Gy ka−1 for feldspar).
As observed for the Roethig terrace, significant fading rates were measured for the IR50 signal of all four samples from the Lingolsheim terrace (∼ 3.0 %–5.0 % per decade), whereas the pIRIR signals show much lower, and sometimes negative, fading rates: ∼ 0.6 %–1.3 % per decade for pIR110, ∼ 0 %–1.6 % per decade for pIR170, and ∼ −1.5 %–0.2 % per decade for pIR225 (Table 4). Negative fading rate values are likely due to signal recuperation during storage and are therefore not representative of a natural phenomenon (Starnberger et al., 2013; Thiel et al., 2011). Therefore, as for the Roethig samples, only the IR50 ages of Lingolsheim are corrected for fading, while the pIRIR fading-corrected ages (Table S2) are not considered further in the discussion.
CAM quartz ages of the Lingolsheim terrace (T3) range from ∼ 28 ka for LHSL3 to ∼ 33 ka for LHSM and ∼ 37 ka for LHSL1 and LHSL2 (Fig. 12f). CAM feldspar ages of samples LHSL1, LHSL2, and LHSM are comparable for all stimulation temperatures: ∼ 23 ka for the IR50 signal, ∼ 28 ka for pIR110, ∼ 33 ka for pIR170, and ∼ 35 ka for pIR225. CAM feldspar ages of LHSL3 are lower and range from ∼ 19 ka (IR50) to ∼ 31 ka (pIR225). After fading correction, IR50 ages range between 31.0 ± 4.5 ka (LHSL3) and ∼ 35 ka (LHSL1, LHSL2, and LHSM).
4.7 Luminescence dating results from the Griesheim terrace
MET-pIRIR De distributions from the sand (GHSL1, GHSL2, and GHSL3) and matrix (GHSM) samples of the Griesheim terrace and their corresponding luminescence ages are summarised in Fig. 13 and Table 5. No results were obtained from quartz OSL measurements due to saturation of the natural signal (De > 2D0; Fig. 14d). Some feldspar aliquots showed high-temperature pIRIR signals (i.e. pIR170, pIR225) approaching saturation (i.e. failing to intercept the DRC, resulting in an infinite De uncertainty) or failed to pass the SAR routine rejection criteria (i.e. recycling ratio ∼ 11 %–20 % and a recuperation > 10 % of the natural dose). Hence, a reduced number of aliquots were accepted for the pIR170 and pIR225 signals (Fig. 13c, d). IR50 De distributions exhibit low overdispersion (13 %–17 %) and are consistent across all four samples (Fig. 13a), yielding CAM De values of ∼ 516–575 Gy. De distributions from higher stimulation temperatures are more overdispersed (OD up to 40 %) and present a larger spread in CAM De values within samples. An increasing trend in CAM De values with stimulation temperature is observed for all samples except GHSL3.
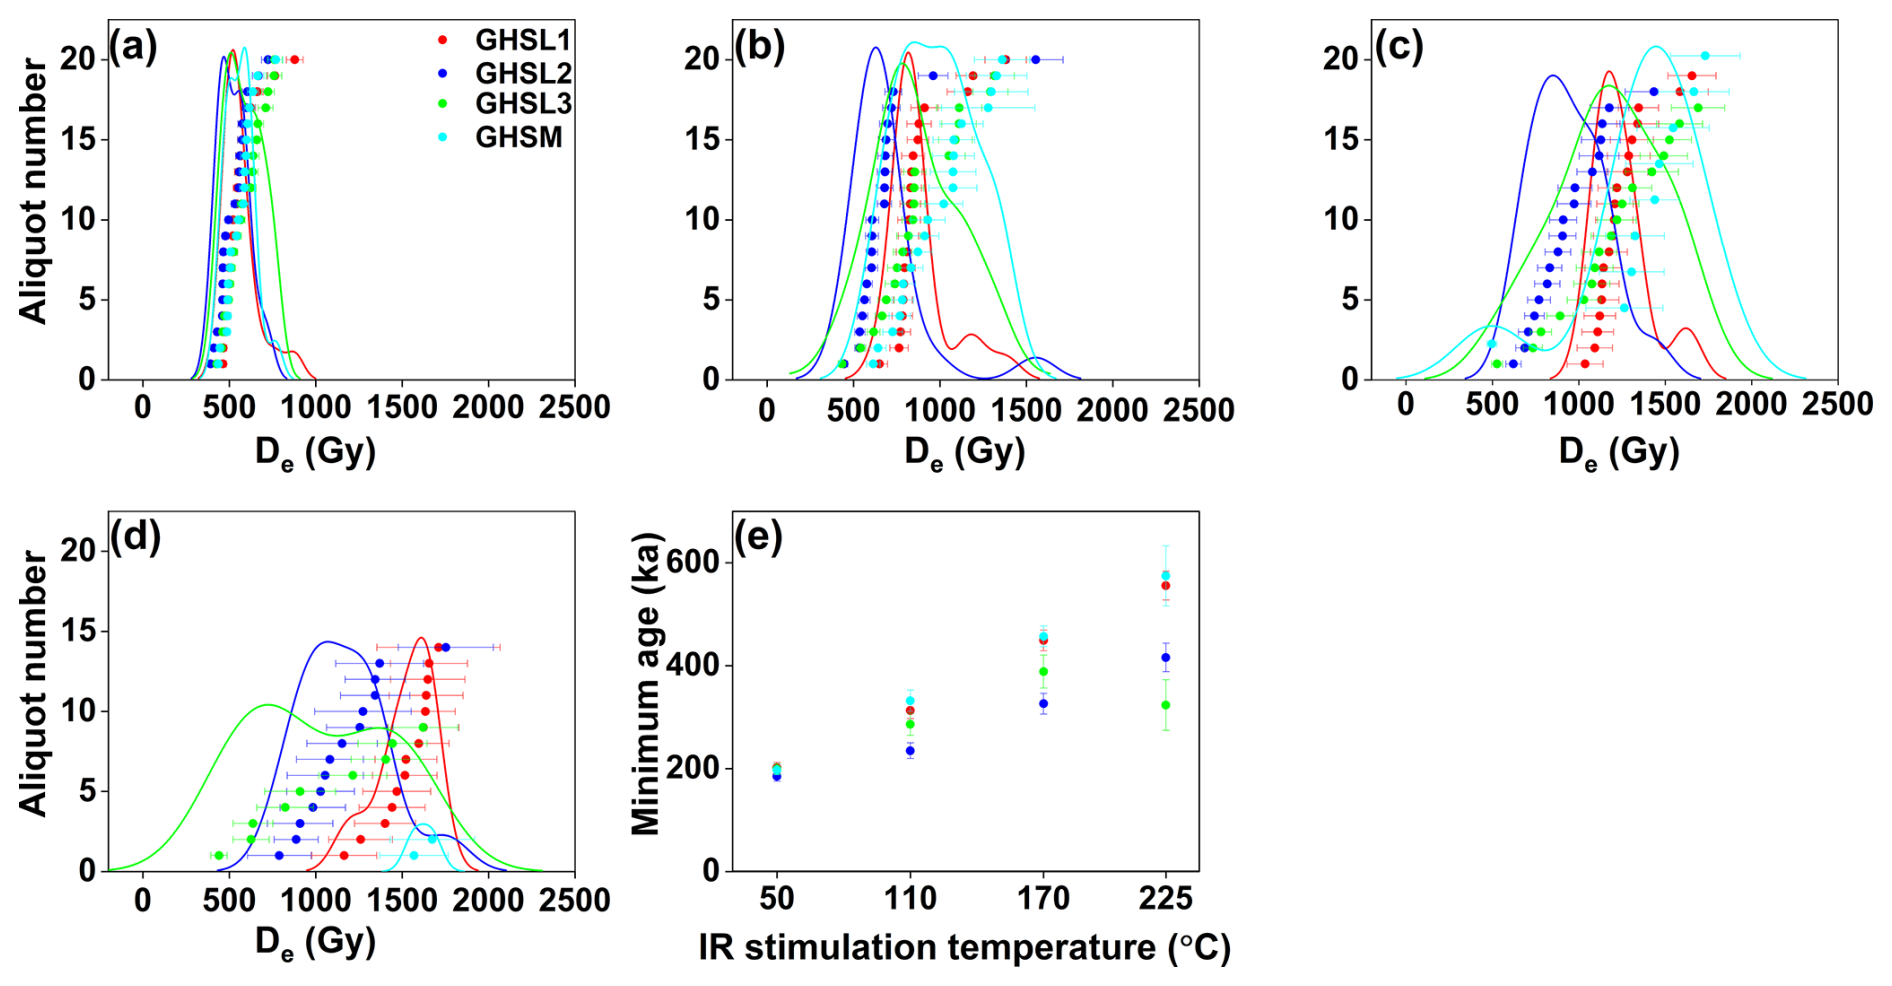
Figure 13Luminescence dating results for the sand and matrix samples from the Griesheim terrace (GHSL1, GHSL2, GHSL3, and GHSM). (a–d) Feldspar MET-pIRIR De distributions for IR50, pIR110, pIR170, and pIR225 stimulations. (e) Feldspar ages without fading correction at different IR stimulation temperatures. Each data point represents ages estimated using CAM, except for the pIR225 age of sample GHSM, for which an arithmetic mean was calculated from the only two aliquots that met the routine rejection criteria (d). OSL measurements on sand and matrix samples from Griesheim terrace showed significant signal saturation. Therefore, no reliable OSL age has been retrieved from this terrace.
Table 5Luminescence dating results from the feldspar sand and matrix samples from the Griesheim terrace (GHSL1, GHSL2, GHSL3, and GHSM). = number of accepted over number of measured aliquots; OD = overdispersion; CAM = central age model (Galbraith et al., 1999). The reported g-value2 d results were estimated by excluding the first prompt measurement. Note that fading correction was unsuccessful in producing a finite fading-corrected age following Kars et al. (2008), since the sensitivity-corrected natural signal () does not interpolate with the (simulated) dose response curve while correcting the ages for fading.
∗ An average pIR225 De value and age are calculated for GHSM instead of calculating a CAM since only two feldspar aliquots met the routine rejection criteria.
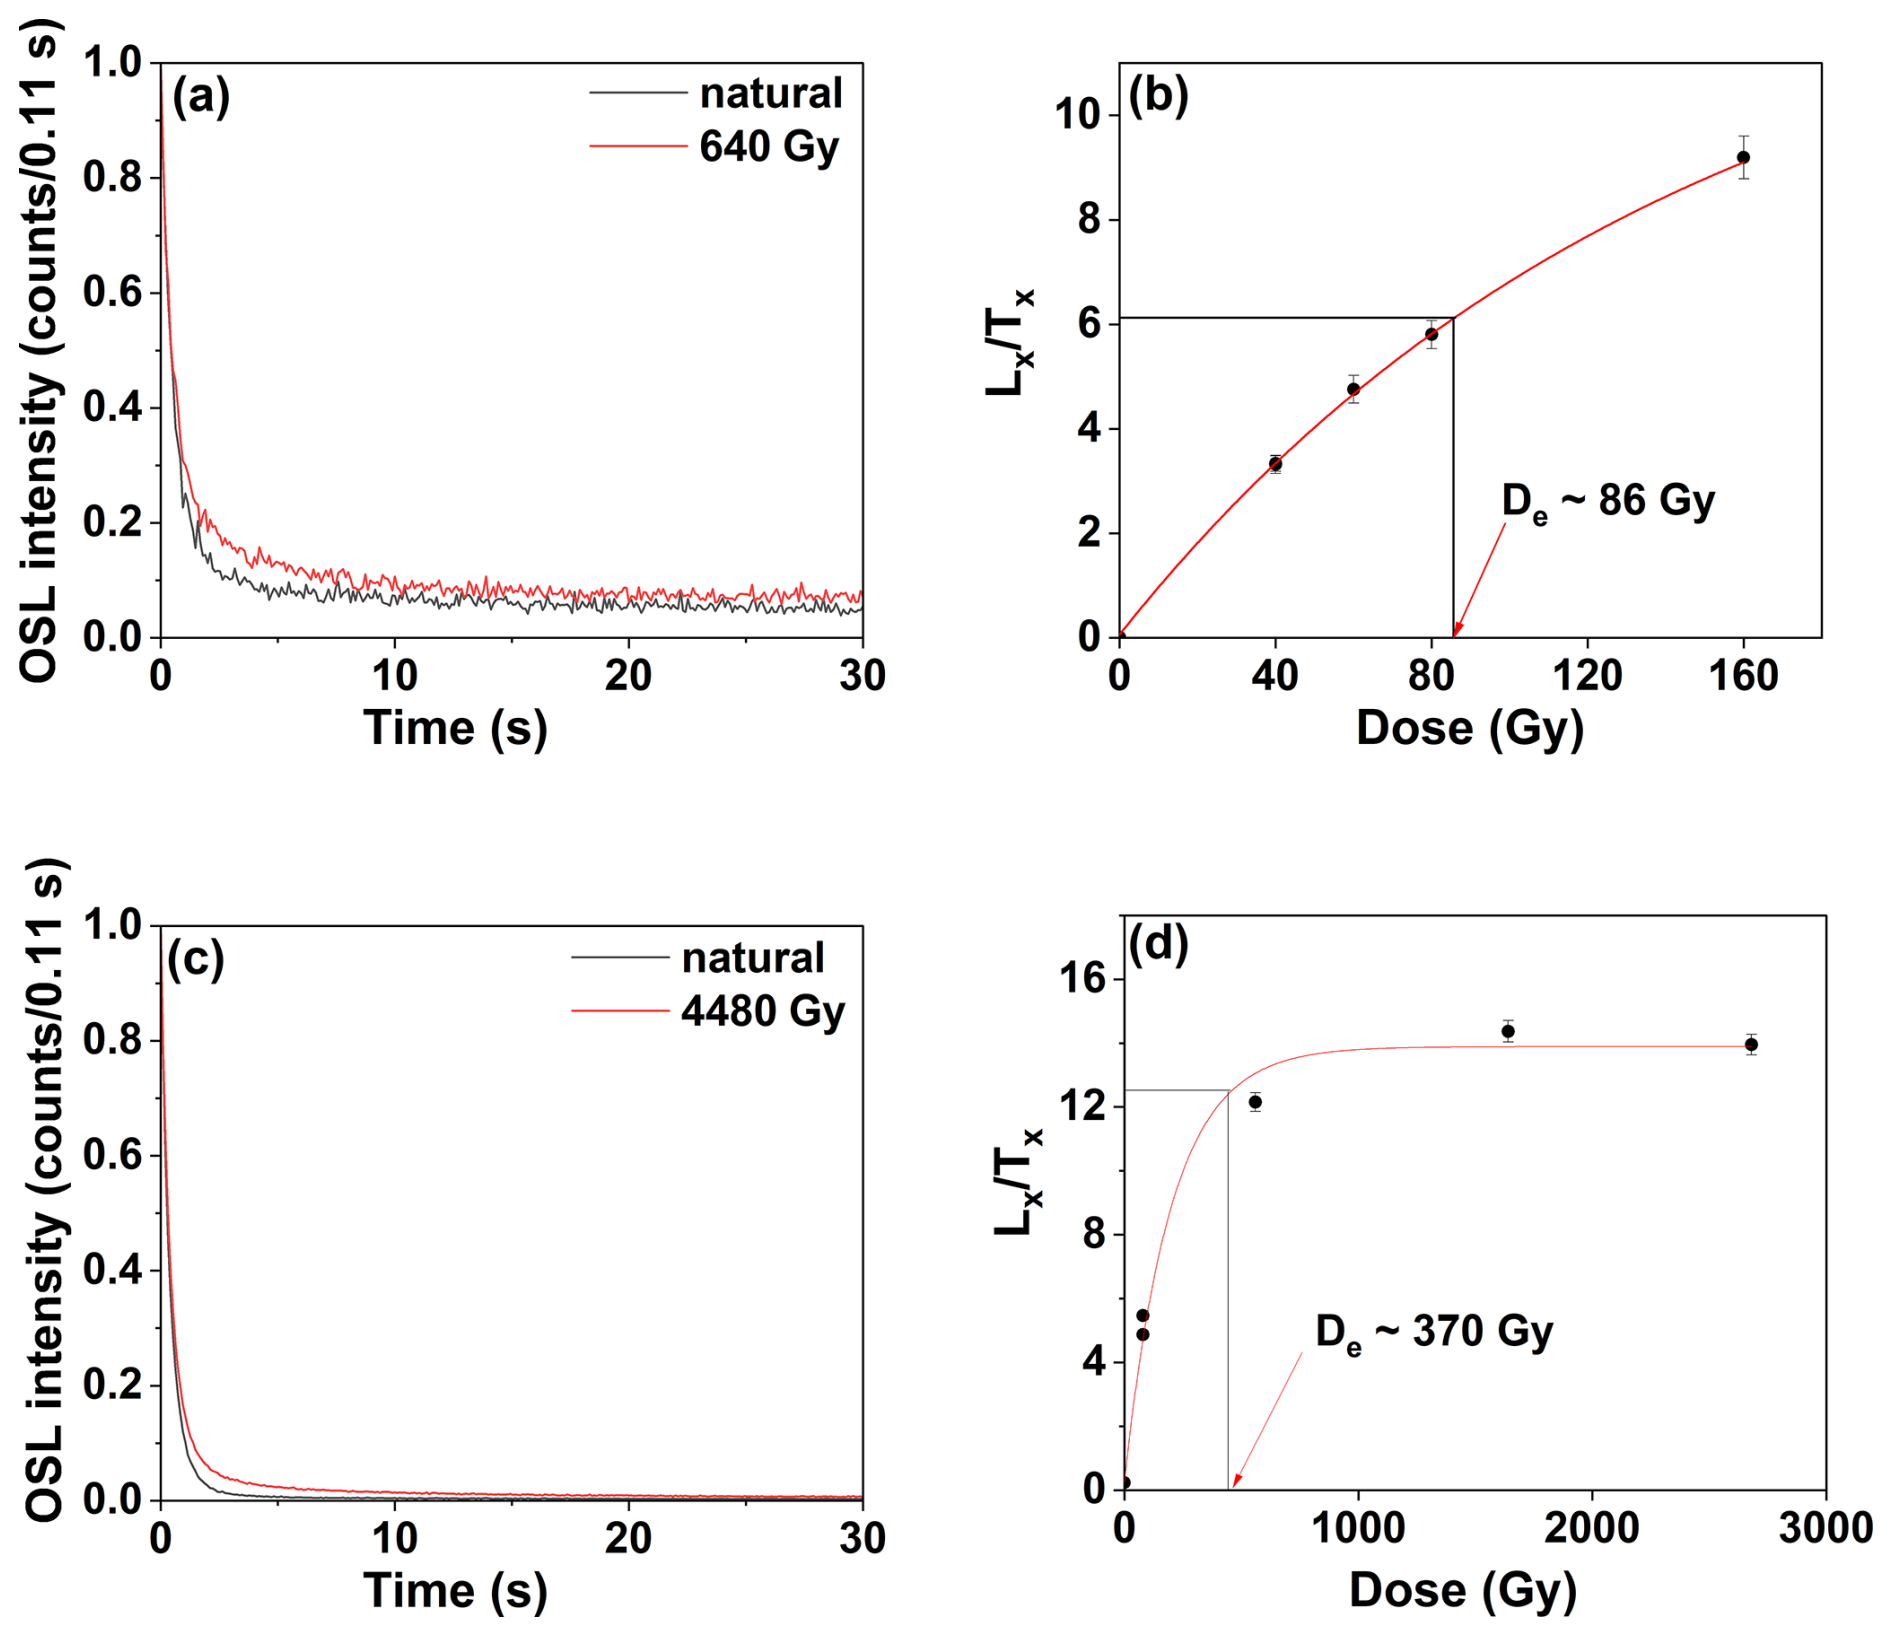
Figure 14Normalised quartz OSL decay curves and sensitivity-corrected dose response curves (DRCs). Examples of two representative aliquots from samples LHSL1 (a, b) and GHSL1 (c, d) are shown. DRCs in panels (b) and (d) are fitted with a single saturation exponential function. OSL measurements on sand and matrix samples from the Griesheim terrace show signal saturation.
Radionuclide concentrations are consistent across all four samples (Table 2) and result in a dose rate for feldspar of ∼ 2.7 Gy ka−1. High fading rates of ∼ 10 %–13 % per decade were estimated for the IR50 signal of all the four samples. Although fading rates decrease at higher stimulation temperatures, the estimated g values remain significant (∼ 2 %–4 % per decade) for the pIRIR signals (Table 5), calling for fading correction. Since the De values of the Griesheim samples extend beyond the linear part of the DRC, fading correction following Kars et al. (2008) was attempted. However, the correction failed to produce finite ages, as the sensitivity-corrected natural signal () did not intersect the fading-corrected DRC (Fig. 15). This is most likely caused by the field saturation of the feldspar signals (King et al., 2018). Furthermore, it is important to acknowledge that the DRCs could not be measured up to their saturation level due to the substantial amount of time required for the practical implementation of the De measurements. As a consequence, the lack of high-dose data may have introduced uncertainty into the fading correction procedure and the fading correction failure could be related to the incompletely recorded growth curves. Therefore, only the non-fading-corrected ages of the Griesheim samples are reported in Table 5 and considered further in the discussion as minimum estimates. Feldspar CAM ages vary between ∼ 191–209 ka for IR50, ∼ 243–343 ka for pIR110, ∼ 337–472 ka for pIR170, and ∼ 334–594 ka for pIR225.
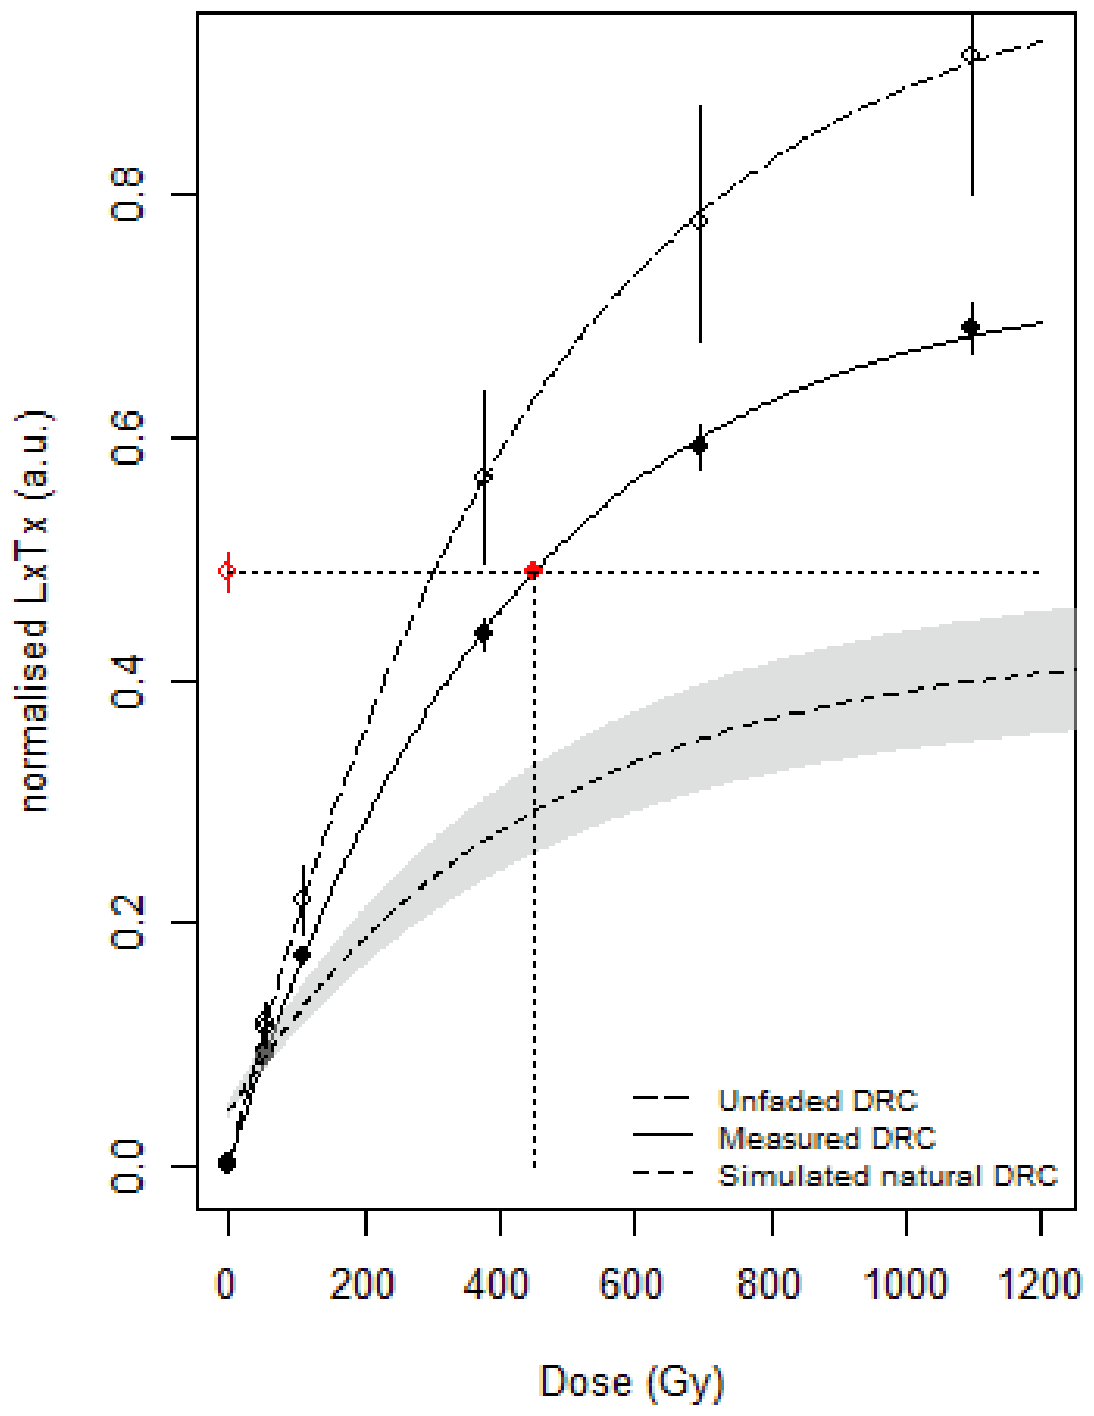
Figure 15Laboratory-measured, simulated unfaded and simulated natural dose response curves for the IR50 signal of one representative aliquot of sample GHSL1. The curves were obtained using the calc_Huntley2006 function of the R package “Luminescence” (King and Burow, 2019) fitted with a single saturation exponential following Kars et al. (2008). (sensitivity-corrected natural signal) does not interpolate the simulated natural DRC, highlighting that the fading correction is unable to produce a finite fading-corrected De value for the samples from the Griesheim terrace.
5.1 Resetting of the OSL and MET-pIRIR signals
The results for the modern river deposits indicate (1) that the OSL signals are better bleached than the MET-pIRIR signals (Fig. 10f) and (2) that the bleaching efficiency of the MET-pIRIR signals declines as the IR stimulation temperature increases (Figs. 7 and 10f). The low residual quartz OSL ages of the samples MOD1 and MOD2 (∼ 0.3–1 ka) confirm the high bleachability of the quartz OSL signal (Fiebig and Preusser, 2007; Murray et al., 2012; Wallinga, 2002). This suggests that the quartz ages obtained in the present study are unlikely to suffer from partial bleaching and therefore provide reliable age control for the chronology of the investigated fluvial terraces.
In contrast, measurements of residual doses in natural, unbleached as well as bleached modern samples (Fig. 7) show a trend of increasing feldspar residual De values with higher pIR stimulation temperatures. This is attributed to the presence of pIRIR signal components, which are more resistant to bleaching (Li and Li, 2011; Li et al., 2014; Thomsen et al., 2008). Non-negligible pIRIR residual doses (∼ 2–6 Gy) were measured after the sunlight bleaching experiment (Fig. 7a). Furthermore, pIRIR De values obtained from unbleached natural modern sand samples range from ∼ 3 to ∼ 26 Gy (Table 3), which corresponds to apparent pIRIR residual ages, varying between ∼ 0.7 and ∼ 8 ka (Fig. 10f). This highlights the importance of accounting for pIRIR residual doses when dating relatively young samples in the Bruche catchment (see Sect. 5.2).
Lastly, a discrepancy in De values and ages is observed between the two modern sand samples (Fig. 10 and Table 3). Both OSL and IRSL De values/ages obtained from the coarser sand sample collected deeper within the exposed sandy bar (MOD2, 3–4 cm below surface) are ∼ 50 % higher than those of the finer, more superficial sample (MOD1, ∼ 0.1 cm). Since these samples were collected from an active river bar of the Bruche River, the older ages of MOD2 (OSL ∼ 1 ka) are unlikely to represent true depositional ages and are instead most likely a result of partial bleaching. The observed age discrepancy could possibly be explained by grain-size-dependent bleaching, with coarser sand grains being less likely to be completely bleached due to their faster settling rate and reduced light exposure during transport (Chamberlain and Wallinga, 2019). Furthermore, two hypothetical scenarios may also contribute to the observed age offset. If both samples were deposited during the same event, the bleaching potential in the system may have increased over time due to decreasing sediment turbulence and water turbidity. Alternatively, the two samples may have been deposited during two separate events, one with higher turbidity and lower bleaching potential (MOD2) and the other with lower turbidity and higher bleaching potential (MOD1). Moreover, since MOD1 was sampled only ∼ 1 mm below the surface, post-depositional bleaching may have also contributed to its lower De values compared to MOD2. As the sediment dynamics explaining the differential bleaching of the modern samples remain uncertain, their residual De values were not subtracted from the De values of the investigated terraces.
5.2 Fading and bleaching: which luminescence signals seem to be the best trade-off?
Based on the analysis of residual doses in modern sand samples (Sect. 5.1) and the comparison of OSL and IRSL/pIRIR results from the three terraces, we evaluate hereafter which luminescence signals are least affected by both partial bleaching and anomalous fading and can therefore be reliably used to reconstruct the chronology of the Bruche terrace sequence (Sect. 5.3).
For the Roethig samples (terrace T4), quartz OSL De distributions with low overdispersion and comparable CAM De values (∼ 32–36 Gy) indicate no effect of partial bleaching (Fig. 11e). The slightly lower age of the matrix sample (RTSM) is attributed to the 25 % higher dose rate of the gravel layer (Table 2). This is likely caused by the heterogeneous lithology of the gravel-rich layer and the inaccuracies in dose rate assessment due to unintended preferential sampling of plutonic granitic clasts from the gravel layers, as the crystalline bedrock partly bears a high level of radioactive elements (K, U, Th; Pagel, 1982). Given these factors, the obtained CAM OSL ages provide a reliable OSL age control for terrace T4. A mean CAM OSL age of 12.3 ± 0.7 ka for T4 has been determined using the three CAM OSL ages of RTSL1, RTSL2, and RTSM. The best agreement of the OSL age control is found within the CAM pIR110 ages (Fig. 11f and Table 3). A single and composite CAM pIR110 age is defined as 13.1 ± 0.5 ka, obtained from the three CAM pIR110 ages of RTSL1, RTSL2, and RTSM. Considering 1σ uncertainties, both the CAM OSL and the pIR110 age estimates collectively define an age range of ∼ 12–14 ka for terrace T4. The IR50 fading-corrected ages (CAM: 14.8 ± 0.9 ka), as well as the pIR170 (CAM: 15.4 ± 0.6 ka) and pIR225 (CAM: 18.0 ± 0.8 ka) ages, are overestimated by ∼ 2–5.5 ka. The offset between the OSL ages and the pIR170 and pIR225 ages, correspond to the residual ages measured on the modern samples (3–6 ka for pIR170, 4.5–8 ka for pIR225; Table 3). This suggests that the discrepancy between the quartz ages and the pIR170 and pIR225 ages is due to the non-bleachable residual components present in the high-temperature pIRIR signals. The offset between OSL and fading-corrected IR50 ages might instead be related to an over-correction by the IR50 fading rates. This highlights the advantage of using a protocol which avoids fading correction (Li and Li, 2011).
OSL De distributions from sand (LHSL1, LHSL2, LHSL3) and matrix (LHSM) samples of the Lingolsheim terrace (T3) also show minimal De variability and overdispersion (Fig. 12a–e), excluding partial bleaching. LHSL1 and LHSL2 yield an OSL age of ∼ 36 ± 2 ka, while LHSM gives a slightly lower age of 32.5 ± 2.1 ka. This is potentially caused by a ∼ 20 % higher dose rate of the gravel layer, which may result from inaccuracies in dose rate estimation due to unintended preferential sampling of high-dose clasts from the gravel layer that shows a heterogeneous lithology. LHSL3, sampled from a higher stratigraphic horizon, shows a younger OSL age of 28.5 ± 1.7 ka. Overall, a mean CAM age has been calculated from the individual CAM OSL ages of the four Lingolsheim samples, which provide a collective OSL age of 33.4 ± 1.7 ka for terrace T3. When comparing the IRSL ages with the OSL age control (Fig. 12f and Table 4), the closest agreement is observed with the IR50 fading-corrected ages (CAM: 33.3 ± 2.4 ka), as well as with the pIR170 (CAM: 32.1 ± 0.8 ka) and pIR225 (CAM: 33.9 ± 0.8 ka) ages, where the residual dose might have played a smaller role than in the Roethig samples. The pIR110 age (CAM: 27.6 ± 0.8 ka) appears slightly underestimated compared to the OSL age control, which is difficult to explain as the fading rate is < 1.5 % per decade for pIR110, thus similar to those obtained for the other pIR stimulation temperatures (Table 4). Hence, the pIR110 fading rates are instead considered artefactual and not suitable for fading correction, as mentioned earlier in Sect. 4.5. Combining the OSL, pIR110, pIR170, pIR225, and fading-corrected IR50 results from four Lingolsheim samples, the collective age range for terrace T3 is defined by a 1σ uncertainty range across the corresponding CAM ages of four samples, with a lower bound of ∼ 27 ka (from the CAM pIR110 age) and an upper bound of ∼ 35 ka (from the CAM OSL age).
Unlike the Roethig and the Lingolsheim terrace, no finite depositional age could be determined for the sand (GHSL1, GHSL2, GHSL3) and matrix (GHSM) samples of the Griesheim terrace (T1) based on their luminescence results. Establishing age constraints was not possible because of (1) the saturation of the OSL signal for all four samples and (2) the failure of the fading correction on the IRSL and pIRIR signals in producing finite ages. Consequently, the non-fading-corrected ages of the Griesheim samples (Table 5) need to be considered minimum estimates, since the measured fading rates are not negligible (∼ 2 %–4 % per decade) even for the higher pIRIR stimulation temperatures. To establish a minimum age, we rely on the fading-uncorrected IR50 ages, which show good agreement among all the Griesheim sand and matrix samples, whereas the pIRIR signals (especially the pIR170 and pIR225) are highly overdispersed. Therefore, a minimum age of ∼ 200 ka can be assumed for the Griesheim terrace (T1).
On a related note, this study underscores the importance of reliable estimation of the fading rate and resulting fading-corrected ages. While the fading rates were derived using a maximum delay time of 3 h for all the fading measurements conducted within this study, it is acknowledged that shorter delay times (∼ 3 h) may potentially influence the fading rate estimation. To assess this, an additional fading test extending the maximum delay time to 24 h for one representative sample RTSL1 was conducted, and it showed minor differences in fading rates and had a negligible impact on the fading-corrected ages (Table S5 and Fig. S6). Despite this consistency, the limitations inherent to the use of a shorter delay time (≤ 3 h) are noted in this study, and it is recommended for future studies to systematically evaluate the impact of delay times to better constrain fading behaviour across a wider range of sample types and geological contexts.
5.3 First chronological framework for the Bruche terrace sequence and geomorphological implications
Only the numerical age estimates interpreted as being more reliable for each investigated terrace, i.e. quartz OSL ages and feldspar IRSL ages which showed the best agreement with quartz (see Sect. 5.2), are used here to build up a chronological framework for the Bruche terrace sequence and draw some preliminary implications about the landscape evolution of the Bruche catchment.
5.3.1 T4
Combined OSL and pIR110 luminescence ages obtained at the Roethig site converge to a ∼ 12–14 ka time range. This thus points to a Younger Dryas (i.e. 12.9–11.7 ka; Cheng et al., 2020) depositional phase for the uppermost part of T4. It should be noted that the sampled layer most probably represents the last episode of channel activity of the Bruche related to this topographic level and hence the final phase of T4 formation. Three geomorphological and palaeoenvironmental implications can be drawn from this. First, despite no in situ deformations being observed along the Roethig profile, Maire (1967) reported a sandy layer affected by cryoturbation in a natural exposure cut in the same terrace and located only ∼ 1 km upstream of our sampling site (Fig. 1c). This sandy layer directly overlies clast- and sand-supported layers that most probably match our sampled layers at Roethig. Whilst this observation led Maire (1967) to attribute this sedimentary sequence to the Late Glacial period with no further precision, cold conditions peculiar to the Younger Dryas, as suggested here for the uppermost channel aggradation in T4, are very well in line with this observation. Second, the ∼ 2 m thick sandy and loamy layers overlying the sampled layers at the base of the profile strikingly bear witness to pedogenetic processes (Fig. 3a). Soil formation must postdate the Younger Dryas so that it can be allocated to the Holocene in all likelihood. A primary identification in the field observed oxidated and reduced horizons along with clay-coating enrichments at the base of the soil. This last observation is corroborated by the observations of Wuscher (2021), who reported an up to 1 m thick Bt horizon in profiles located ∼ 2 km to the south-west cut in the same terrace (Fig. 1c). This feature thus seems widespread in the uppermost deposits of T4, and the soil nature could point to a (polygenetic?) Luvisol under hydromorphic influence. Note that a further chronological constraint exists: this Bt horizon is truncated at the top by a silty layer embedding ancient and protohistoric ceramics (Wuscher, 2021). In any case, a better understanding of these pedogenetic processes would require further analyses, in particular micromorphology, to allow the inferring of valuable insights into Holocene palaeoenvironmental conditions in this area. Third, according to elevation measurements by Wuscher (2023) and our profile, the uppermost channel deposits in T4 consistently lie at 143.5–144 m a.s.l. As they are perched ∼ 2 m above the coarse bedload of the current riverbed, average low incision rates around 0.15 m ka−1 can be inferred for the lowermost section of the Bruche over the whole Holocene time span. An in-depth discussion about this topic is beyond the scope of this study, but, given the spatial proximity with the Ill–Rhine system (Fig. 1c), base-level changes in the main hydrosystem could have strongly influenced the Holocene evolution of this river section. On that note, several metres of incision in the Rhine downstream of Strasbourg over this time span are reported based on the elevation of terraces attributed to the Last Glaciation Maximum (Carbiener, 1969). Whilst this could have easily triggered an erosional phase in the sub-tributary, it is unclear if this incision was partly caused by tectonic movement in the graben or was entirely controlled by changes in the sedimentary system, as reported for the southernmost part of the URG (Kock et al., 2009). There, an incision of the Rhine River into Pleistocene glaciofluvial deposits of up to 20–30 m is observed. This is explained by a debris-over-saturated glaciofluvial system causing massive fan-like aggradation during the Late Pleistocene at the southern end of the URG. With the decline in sediment supply, the river had enough transport capacity to remove part of these deposits. While the situation along the Bruche shares some similarities, this topic requires further investigation by looking more specifically at the evolution of the Ill during the Holocene in the vicinity of Strasbourg.
5.3.2 T3
Luminescence dating of two distinct stratigraphic horizons of the Lingolsheim terrace indicates depositional ages of ∼ 27–35 ka, pointing to the final period of MIS 3 for deposition of the uppermost part of T3. Similarly to the previous terrace, the sand lenses and clast-supported layer sampled at Lingolsheim most probably represent the last episode of channel activity of the Bruche related to this topographic level, hence the final phase of T3 formation. Wuscher (2021) studied deposits located ∼ 1 km to the north of the sampled gravel pit in the same terrace. There, alluvial sediments originating from the Vosges form the bulk of a ∼ 4 m thick sequence with a typical reddish colour. Cryoturbations also occur in this sandy material at the very base of the profile and closely resemble those observed in the Lingolsheim gravel pit (Fig. 4c). However, a greyish–beige (i.e. carbonate-rich), 0.6–0.7 m thick, clayey silt layer, which was not observed in the Lingolsheim gravel pit, is embedded at the base of the profile. It is interpreted as overbank fines deposited by the Rhine. The twofold sampling of this unit for luminescence dating yielded post-IR IR225 ages (not MET) of 46.4 ± 3.5 and 52.6 ± 3.9 ka (Wuscher, 2021). These ages are approximately 10–20 ka older than those reported in the current study and could constrain a previous phase of sediment aggradation.
Two conclusions can be drawn from the luminescence results in T3. First, the occurrence of overbank fines from the Rhine in Bruche-dominated deposits points to complex depositional interplay between the main stem and its sub-tributary during the formation of T3 in this area. Note also that decametre-thick Rhine sediments seem to be documented at greater depths in the neighbouring drilling performed in the same terrace (Fig. 2b). Second, the post-IR IR225 ages (∼ 46–53 ka) by Wuscher (2021) and the ages (∼ 27–35 ka) obtained in this study strongly point to enhanced fluvial aggradation occurring during MIS 3. This agrees well with cryoturbations observed in Bruche deposits at both sites since colder climatic conditions recorded at the end of MIS 3 had already begun before 40 ka in this part of western Europe (Peral et al., 2024). Importantly, the spatial extension of T3 is, by far, the largest among the Bruche fan–terrace sequence (Fig. 1c), and it would have therefore implied a massive sediment production in the Vosges Mountains and efficient sediment transfer at that time. Given the likely absence of glaciers in the Bruche catchment at the end of MIS 3 (Flageollet, 2002; Jautzy et al., 2024), enhanced periglacial denudation could have been the main control on this sediment production. Again, this assumption would require further investigations by looking at the erodibility of the different quartz- and feldspar-bearing rocks forming the Vosges Mountains during the Quaternary cold periods (see e.g. Jautzy et al., 2024).
5.3.3 T1
Although no finite depositional age could be inferred from sand and matrix deposits of the Griesheim gravel pit, the fading-uncorrected IR50 ages indicate a minimum age estimation of ∼ 200 ka. The cryoturbations observed at the base of the gravel pit (Fig. 5c) (roughly matching the elevation of the sampled layers) suggest that the sediments were affected by post-depositional freeze–thaw processes. Although this indicates that fluvial aggradation in the sampled layers might have occurred during a cold period, the cryoturbations themselves do not directly confirm the timing of deposition. On that note, Théobald (1955) correlates sandy layers occurring at greater depths in a neighbouring sand pit from the same terrace (∼ 170 m a.s.l.) with a cold period of the “ancient” Quaternary (i.e. early Pleistocene) but rejects any correlation with the Pliocene. In any case, the very existence of this > 200 ka old fan–terrace remnant perched 25 m above the present-day valley floor leaves some interesting questions open, notably in terms of chronological constraint and Quaternary tectonic activity in this part of the URG. Given the age and the nature of the deposits, isochron burial dating based on 10Be and 26Al concentrations would constitute the next step to obtaining further insights into long-term landscape evolution in this area.
Finally, the relatively high fading rates observed for the feldspar grains of the Griesheim deposits compared to the Roethig and Lingolsheim terraces might be attributed to the lithological characteristics of terrace T1. Feldspar of volcanic origin generally exhibits higher degrees of fading due to its disordered crystal structure formed by rapid cooling (Bösken and Schmidt, 2020). On that note, Permian rhyolites occurring in the catchment are largely dissected by the hydrographic network (Fig. 1b). Enhanced denudation of this lithology during the aggradation of terrace T1 further downstream would have resulted in a higher input of volcanic feldspar into those fluvial deposits. While this assumption would explain the observed differences in the fading behaviour, more investigations are required to confirm – or deny – it (e.g. mineralogical analyses of a larger number of grains and determining individual fading rates for bedrock samples). Furthermore, it should be noted that, although lithological variation presents a possible explanation for the observed differences in the fading rate among the investigated terraces, this discrepancy could alternatively be influenced by the dose used during the fading experiment (Li and Li, 2008). In the current study, the dose applied to monitor fading was similar to the De value of the corresponding sample. However, it is beyond the scope of this study to investigate whether the observed fading rate variability among the terraces is dose-dependent, which would require tedious experimentation.
The current study establishes a comprehensive luminescence chronology for the singular fluvial terrace sequence across the lower reach of the Bruche River in the Upper Rhine Graben. The methodological focus of the study highlights the effect of partial bleaching and fading on age estimation. Results from modern riverbed sand samples, combined with a systematic comparison of OSL and MET-pIRIR dating results, reveal the presence of residual doses resistant to bleaching in the high-temperature pIRIR signal, which are not affected by fading.
The most reliable numerical age estimates for each investigated terrace – quartz OSL ages and feldspar IRSL ages that best agreed with OSL ages – provide new insights into the depositional history of the Bruche terrace sequence and its geomorphological controls. Dating results from the Roethig (T4; ∼ 12–14 ka) and Lingolsheim (T3; ∼ 27–35 ka) terraces indicate enhanced fluvial aggradation during the Younger Dryas and MIS 3, respectively. For the oldest alluvial terrace (Griesheim, T1), no finite depositional age could be determined, but a minimum age of ∼ 200 ka is estimated.
Overall, this study contributes to understanding the interplay between climate, sediment transport, and terrace formation within the lower Bruche valley. Future research involving additional geochronological approaches (e.g. isochron burial dating based on 10Be and 26Al concentrations) and detailed stratigraphic analysis may help further refine the chronology and overcome the methodological challenges discussed in this study.
All data supporting the findings of this study are available within the article and its Supplement.
The supplement related to this article is available online at https://doi.org/10.5194/egqsj-74-169-2025-supplement.
FP and GR conceptualised and designed the project, which developed further under the supervision of FP. GR carried out the logging and provided detailed lithological stratigraphy of the investigated terraces. Data interpretation and formal analysis were done jointly by MM, FP and ES. MM designed and carried out the experiments and wrote the initial draft of the manuscript. Figures were prepared by MM and GR. Reviews of and edits to the manuscript were performed cumulatively by all the co-authors.
At least one of the (co-)authors is a member of the editorial board of E&G Quaternary Science Journal. The peer-review process was guided by an independent editor, and the authors also have no other competing interests to declare.
Publisher's note: Copernicus Publications remains neutral with regard to jurisdictional claims made in the text, published maps, institutional affiliations, or any other geographical representation in this paper. While Copernicus Publications makes every effort to include appropriate place names, the final responsibility lies with the authors. Views expressed in the text are those of the authors and do not necessarily reflect the views of the publisher.
The authors are grateful to Lukas Gegg and Patrice Wuscher for actively helping in the fieldwork and in the sample collection process. The quarry managers of our studied areas are acknowledged for kindly providing us with access for sample collection.
This research has been supported by a scholarship from the Deutscher Akademischer Austauschdienst, or German Academic Exchange Service (grant no. 2100390601), granted to Madhurima Marik, and a stipend by the Swiss National Science Foundation granted to Elena Serra.
This open-access publication was funded by the University of Freiburg.
This paper was edited by Markus Fuchs and reviewed by two anonymous referees.
Abdulkarim, M., Chapkanski, S., Ertlen, D., Mahmood, H., Obioha, E., Preusser, F., Rambeau, C., Salomon, F., Schiemann, M., and Schmitt, L.: Morpho-sedimentary characteristics of Holocene paleochannels in the Upper Rhine alluvial plain, France, E&G Quaternary Sci. J., 71, 191–212, https://doi.org/10.5194/egqsj-71-191-2022, 2022.
Abdulkarim, M., Schmitt, L., Fülling, A., Rambeau, C., Ertlen, D., Mueller, D., Chapkanski, S., and Preusser, F.: Late glacial to Holocene fluvial dynamics in the Upper Rhine alluvial plain, France, Quat. Res., 121, 109–131, https://doi.org/10.1017/qua.2024.22, 2024.
Antoine, P., Lautridou, J. P., and Laurent, M.: Long-term fluvial archives in NW France: response of the Seine and Somme rivers to tectonic movements, climatic variations and sea-level changes, Geomorphology, 33, 183–207, https://doi.org/10.1016/S0169-555X(99)00122-1, 2000.
Auclair, M., Lamothe, M., and Huot, S.: Measurement of anomalous fading for feldspar IRSL using SAR, Radiat. Meas., 37, 487–492, https://doi.org/10.1016/S1350-4487(03)00018-0, 2003.
Bailey, R. M., Smith, B. W., and Rhodes, E. J.: Partial bleaching and the decay form characteristics of quartz OSL, Radiat. Meas., 27, 123–136, https://doi.org/10.1016/S1350-4487(96)00157-6, 1997.
Baulig, H.: Questions de morphologie vosgienne et rhénane (Premier article), in: Annales de géographie, Armand Colin, Vol. 31, 132–154, https://doi.org/10.3406/geo.1922.10257, 1922.
Bösken, J. J. and Schmidt, C.: Direct and indirect luminescence dating of tephra: A review, J. Quat. Sci., 35, 39–53, https://doi.org/10.1002/jqs.3160, 2020.
Bøtter-Jensen, L., Thomsen, K. J., and Jain, M.: Review of optically stimulated luminescence (OSL) instrumental developments for retrospective dosimetry, Radiat. Meas., 45, 253–257, https://doi.org/10.1016/j.radmeas.2009.11.030, 2010.
Bridgland, D. R. and Westaway, R.: Climatically controlled river terrace staircases: a worldwide Quaternary phenomenon, Geomorphology, 98, 285–315, https://doi.org/10.1016/j.geomorph.2006.12.032, 2008.
Buraczynski, J. and Butrym, J.: La datation des loess du profil d'Achenheim (Alsace) à l'aide de la méthode de thermoluminescence, Quaternaire, 21, 201–209, https://doi.org/10.3406/quate.1984.1514, 1984.
Buylaert, J. P., Murray, A. S., Thomsen, K. J., and Jain, M.: Testing the potential of an elevated temperature IRSL signal from K-feldspar, Radiat. Meas., 44, 560–565, https://doi.org/10.1016/j.radmeas.2009.02.007, 2009.
Buylaert, J. P., Jain, M., Murray, A. S., Thomsen, K. J., Thiel, C., and Sohbati, R.: A robust feldspar luminescence dating method for Middle and Late Pleistocene sediments, Boreas, 41, 435–451, https://doi.org/10.1111/j.1502-3885.2012.00248.x, 2012.
Carbiener, R.: Le grand Ried d'Alsace. Ecologie d'un paysage, Bulletin de la Société Industrielle de Mulhouse, 734, 15–44, 1969.
Castela, P. and Tricart, J.: Une coupe typique du cône de déjections nivo-périglaciaire de la Bruche: La carrière Zimmer à Lingolsheim, Sciences Géologiques, bulletins et mémoires, 11, 3–14, https://doi.org/10.3406/sgeol.1958.1178, 1958.
Chamberlain, E. L. and Wallinga, J.: Seeking enlightenment of fluvial sediment pathways by optically stimulated luminescence signal bleaching of river sediments and deltaic deposits, Earth Surf. Dynam., 7, 723–736, https://doi.org/10.5194/esurf-7-723-2019, 2019.
Cheng, H., Zhang, H., Spötl, C., Baker, J., Sinha, A., Li, H., and Edwards, R. L.: Timing and structure of the Younger Dryas event and its underlying climate dynamics, P. Natl. A. Sci., 117, 23408–23417, https://doi.org/10.1073/pnas.2007869117, 2020.
Choi, J. H., Murray, A. S., Cheong, C. S., and Hong, S. C.: The dependence of dose recovery experiments on the bleaching of natural quartz OSL using different light sources, Radiat. Meas., 44, 600–605, https://doi.org/10.1016/j.radmeas.2009.02.018, 2009.
Colarossi, D., Duller, G. A., and Roberts, H. M.: Exploring the behaviour of luminescence signals from feldspars: implications for the single aliquot regenerative dose protocol, Radiat. Meas., 109, 35–44, https://doi.org/10.1016/j.radmeas.2017.07.005, 2018.
Cunningham, A. C., Wallinga, J., Hobo, N., Versendaal, A. J., Makaske, B., and Middelkoop, H.: Re-evaluating luminescence burial doses and bleaching of fluvial deposits using Bayesian computational statistics, Earth Surf. Dynam., 3, 55–65, https://doi.org/10.5194/esurf-3-55-2015, 2015.
Degering, D. and Degering, A.: Change is the only constant – Time-dependent dose rates in luminescence dating, Quat. Geochronol., 58, 101074, https://doi.org/10.1016/j.quageo.2020.101074, 2020.
Duller, G. A. T.: Distinguishing quartz and feldspar in single grain luminescence measurements, Radiat. Meas., 37, 161–165, https://doi.org/10.1016/S1350-4487(02)00170-1, 2003.
Duller, G. A. T.: Luminescence Dating: Guidelines on using luminescence dating in archaeology, English Heritage Trust, 45, http://hdl.handle.net/2160/39553 (last access: 24 February 2025), 2008.
Elkadi, J., King, G. E., Lehmann, B., and Herman, F.: Reducing variability in OSL rock surface dating profiles, Quat. Geochronol., 64, 101169, https://doi.org/10.1016/j.quageo.2021.101169, 2021.
Erkens, G., Dambeck, R., Volleberg, K. P., Bouman, M. T. I. J., Bos, J. A. A., Cohen, K. M., Wallinga, J., and Hoek, W. Z.: Fluvial terrace formation in the northern Upper Rhine Graben during the last 20000 years as a result of allogenic controls and autogenic evolution, Geomorphology, 103, 476–495, https://doi.org/10.1016/j.geomorph.2008.07.021, 2009.
Euzen, C., Chabaux, F., Rixhon, G., Preusser, F., Eyrolle, F., Chardon, V., Zander, A. M., Badariotti, D., and Schmitt, L.: Multi-method geochronological approach to reconstruct post-1800 floodplain sedimentation in the upper Rhine plain, France, Quat. Geochronol., 83, 101561, https://doi.org/10.1016/j.quageo.2024.101561, 2024.
Fiebig, M. and Preusser, F.: Investigating the amount of zeroing in modern sediments of River Danube, Austria, Quat. Geochronol., 2, 143–149, https://doi.org/10.1016/j.quageo.2006.09.001, 2007.
Flageollet, J. C.: Sur Les Traces Des Glaciers Vosgiens, CNRS éditions, Paris, 212, ISBN 2-271-05960-7, 2002.
Fu, X. and Li, S. H.: A modified multi-elevated-temperature post-IR IRSL protocol for dating Holocene sediments using K-feldspar, Quat. Geochronol., 17, 44–54, https://doi.org/10.1016/j.quageo.2013.02.004, 2013.
Fuchs, M. C., Gloaguen, R., Krbetschek, M., and Szulc, A.: Rates of river incision across the main tectonic units of the Pamir identified using optically stimulated luminescence dating of fluvial terraces, Geomorphology, 216, 79–92, https://doi.org/10.1016/j.geomorph.2014.03.027, 2014.
Galbraith, R. F., Roberts, R. G., Laslett, G. M., Yoshida, H., and Olley, J. M.: Optical dating of single and multiple grains of quartz from Jinmium rock shelter, northern Australia: Part I, experimental design and statistical models, Archaeometry, 41, 339–364, https://doi.org/10.1111/j.1475-4754.1999.tb00987.x,1999.
Gegg, L., Jacob, L., Moine, O., Nelson, E., Penkman, K. E., Schwahn, F., Stojakowits P., White. D., Wielandt-Schuster U., and Preusser, F.: Climatic and tectonic controls on deposition in the Heidelberg Basin, Upper Rhine Graben, Germany, Quat. Sci. Rev., 345, 109018, https://doi.org/10.1016/j.quascirev.2024.109018, 2024.
Gegg, L., Moine, O., Stojakowits, P., and Preusser, F.: Sediment dynamics, neotectonic activity and palaeoenvironments recorded in the Quaternary infill of the central Upper Rhine Graben, Quat. Sci. Adv., 18, 100284, https://doi.org/10.1016/j.qsa.2025.100284, 2025.
Godfrey-Smith, D. I., Huntley, D. J., and Chen, W. H.: Optical dating studies of quartz and feldspar sediment extracts, Quat. Sci. Rev., 7, 373–380, https://doi.org/10.1016/0277-3791(88)90032-7, 1988.
Guérin, G., Mercier, N., and Adamiec, G.: Dose-rate conversion factors: update, Ancient Tl, 29, 5–8, https://doi.org/10.26034/la.atl.2011.443, 2011.
Guérin, G., Christophe, C., Philippe, A., Murray, A. S., Thomsen, K. J., Tribolo, C., Urbanova, P., Jain, M., Guibert, P., Mercier, N., Kreutzer, S., and Lahaye, C.: Absorbed dose, equivalent dose, measured dose rates, and implications for OSL age estimates: Introducing the Average Dose Model, Quat. Geochronol., 41, 163–173, https://doi.org/10.1016/j.quageo.2017.04.002, 2017.
Guo, Y. J., Zhang, J. F., Qiu, W. L., Hu, G., Zhuang, M. G., and Zhou, L. P.: Luminescence dating of the Yellow River terraces in the Hukou area, China, Quat. Geochronol., 10, 129–135, https://doi.org/10.1016/j.quageo.2012.03.002, 2012.
Houben, P.: Spatio-temporally variable response of fluvial systems to Late Pleistocene climate change: a case study from central Germany, Quat. Sci. Rev., 22, 2125–2140, https://doi.org/10.1016/S0277-3791(03)00181-1, 2003.
Huntley, D. J. and Baril, M. R.: The K content of the K-feldspars being measured in optical dating or in thermoluminescence dating, Ancient TL, 15, 11–13, https://doi.org/10.26034/la.atl.1997.271, 1997.
Huntley, D. J. and Lamothe, M.: Ubiquity of anomalous fading in K-feldspars and the measurement and correction for it in optical dating, Can. J. Earth Sci., 38, 1093–1106, https://doi.org/10.1139/e01-013, 2001.
Ishii, Y.: Luminescence dating reveals a rapid response to climate change of fluvial terrace formation along the Ani River, northeastern Japan, during the last glacial period, Quat. Geochronol., 70, 101307, https://doi.org/10.1016/j.quageo.2022.101307, 2022.
Ishii, Y. and Ito, K.: Luminescence dating of sand matrices within gravelly fluvial deposits: Assessing the plausibility of beta dose rate calculation, Quat. Sci. Adv., 13, 100160, https://doi.org/10.1016/j.qsa.2023.100160, 2024.
Jautzy, T., Herrault, P.-A., Chardon, V., Schmitt, L., and Rixhon, G.: Measuring river planform changes from remotely sensed data – a Monte Carlo approach to assessing the impact of spatially variable error, Earth Surf. Dynam., 8, 471–484, https://doi.org/10.5194/esurf-8-471-2020, 2020.
Jautzy, T., Schmitt, L., and Rixhon, G.: Historical geomorphological adjustments of an Upper Rhine sub-tributary over the two last centuries (Bruche River, France), Géomorphologie: relief, processus, environnement, 28, 53–72, https://doi.org/10.4000/geomorphologie.16661, 2022.
Jautzy, T., Rixhon, G., Braucher, R., Delunel, R., Valla, P. G., Schmitt, L., and Team, A.: Cosmogenic (un-)steadiness revealed by paired-nuclide catchment-wide denudation rates in the formerly half-glaciated Vosges Mountains (NE France), Earth Planet. Sc. Lett., 625, 118490, https://doi.org/10.1016/j.epsl.2023.118490, 2024.
Jenkins, G. T. H., Duller, G. A. T., Roberts, H. M., Chiverrell, R. C., and Glasser, N. F.: A new approach for luminescence dating glaciofluvial deposits – High precision optical dating of cobbles, Quat. Sci. Rev., 192, 263–273, https://doi.org/10.1016/j.quascirev.2018.05.036, 2018.
Kars, R. H., Wallinga, J., and Cohen, K. M.: A new approach towards anomalous fading correction for feldspar IRSL dating – Tests on samples in field saturation, Radiat. Meas., 43, 786–790, https://doi.org/10.1016/j.radmeas.2008.01.021, 2008.
Kenworthy, M. K., Rittenour, T. M., Pierce, J. L., Sutfin, N. A., and Sharp, W. D.: Luminescence dating without sand lenses: An application of OSL to coarse-grained alluvial fan deposits of the Lost River Range, Idaho, USA, Quat. Geochronol., 23, 9–25, https://doi.org/10.1016/j.quageo.2014.03.004, 2014.
King, G. E. and Burow, C.: Calc_Huntley2006: Apply the Huntley (2006) model, Function version 0.4.1, Luminescence: Comprehensive Luminescence Dating Data Analysis, edited by: Kreutzer, S., Burow, C., Dietz, M., Fuchs, MC, Schmidt, C., Fischer, M., and Friedrich, J., R package version 0.9.0.109, https://CRAN.R-project.org/package=Luminescence (last access: 14 January 2025), 2019.
King, G. E., Burow, C., Roberts, H. M., and Pearce, N. J.: Age determination using feldspar: evaluating fading-correction model performance, Radiat. Meas., 119, 58–73, https://doi.org/10.1016/j.radmeas.2018.07.013, 2018.
Kock, S., Huggenberger, P., Preusser, F., Rentzel, P., and Wetzel, A.: Formation and evolution of the Lower Terrace of the Rhine River in the area of Basel, Swiss J. Geosci., 102, 307–321, https://doi.org/10.1007/s00015-009-1325-1, 2009.
Kolb, T., Fuchs, M., and Zöller, L.: Deciphering fluvial landscape evolution by luminescence dating of river terrace formation: A case study from Northern Bavaria, Germany, Zeitschrift Für Geomorphologie, Supplementary Issue, 60, 29-48, https://doi.org/10.1127/zfg_suppl/2015/S-00193, 2016.
Kreutzer, S.: calc_FadingCorr: apply a fading correction according to Huntley and Lamothe (2001) for a given g-value and a given tc. Function version 0.4. 2, edited by: Kreutzer, S., Burow, C., Dietze, M., Fuchs, M. C., Schmidt, C., Fischer, M., and Friedrich, J.: Luminescence: Comprehensive Luminescence Dating Data Analysis, R package version 0.9, 8-9000, https://CRAN.R-project.org/package=Luminescence (last access: 10 February 2025), 2020.
Kreutzer, S., Schmidt, C., Fuchs, M. C., Dietze, M., Fischer, M., and Fuchs, M.: Introducing an R package for luminescence dating analysis, Ancient TL, 30, 1–8, https://doi.org/10.26034/la.atl.2012.457, 2012.
Lautridou, J. P., Sommé, J., Heim, J., Puisségur, J. J., and Rousseau, D. D.: La stratigraphie des loess et formations fluviatiles d'Achenheim (Alsace): Nouvelles données bioclimatiques et corrélations avec les séquences pléistocènes de la France du Nord-Ouest, Quaternaire, 22, 125–132, https://doi.org/10.3406/quate.1985.1536, 1985.
Li, B. and Li, S. H.: Investigations of the dose-dependent anomalous fading rate of feldspar from sediments, J. Phys. D: Appl. Phys., 41, 225502, https://doi.org/10.1088/0022-3727/41/22/225502, 2008.
Li, B. and Li, S. H.: Luminescence dating of K-feldspar from sediments: A protocol without anomalous fading correction, Quat. Geochronol., 6, 468–479, https://doi.org/10.1016/j.quageo.2011.05.001, 2011.
Li, B. and Li, S. H.: Luminescence dating of Chinese loess beyond 130 ka using the non-fading signal from K-feldspar, Quat. Geochronol., 10, 24–31, https://doi.org/10.1016/j.quageo.2011.12.005, 2012.
Li, B., Jacobs, Z., Roberts, R., and Li, S. H.: Review and assessment of the potential of post-IR IRSL dating methods to circumvent the problem of anomalous fading in feldspar luminescence, Geochronometria, 41, 178–201, https://doi.org/10.2478/s13386-013-0160-3, 2014.
Macklin, M. G., Benito, G., Gregory, K. J., Johnstone, E., Lewin, J., Michczyñska, D. J., Soja, R. Starkel, L., and Thorndycraft, V. R.: Past hydrological events reflected in the Holocene fluvial record of Europe, Catena, 66, 145–154, https://doi.org/10.1016/j.catena.2005.07.015, 2006.
Mahadev, R., Singh, A. K., and Jaiswal, M. K.: Application of luminescence age models to heterogeneously bleached quartz grains from flood deposits in Tamilnadu, southern India: Reconstruction of past flooding, Quatern. Int., 513, 95–106, https://doi.org/10.1016/j.quaint.2019.02.037, 2019.
Maire, G.: La Basse-Bruche: cône de piedmont et dynamique actuelle, PhD Thesis, Université de Strasbourg, Faculté de géographie et d'aménagement, 138 pp., https://doi.org/10.3406/sgeol.1967.1320, 1966.
Maire, G.: Aspects de l'évolution quaternaire de la vallée inférieure de la Bruche, Sciences Géologiques, Bulletins et Mémoires, 20, 175–184, https://doi.org/10.3406/sgeol.1967.1320, 1967.
Marik, M., Serra, E., Gegg, L., Wölki, D., and Preusser, F.: Combined different luminescence dating approaches on fluvial gravel deposits from the southern upper Rhine graben, Quat. Geochronol., 82, 101536, https://doi.org/10.1016/j.quageo.2024.101536, 2024.
Millot, G., Camez, T., and Wernert, P.: Evolution des Minéraux argileux dans les Loess et les Lehms d'Achenheim (Alsace), Sciences Géologiques, Bulletins et Mémoires, 10, 17–19, https://doi.org/10.3406/sgeol.1957.1163, 1957.
Mueller, D., Preusser, F., Buechi, M. W., Gegg, L., and Deplazes, G.: Luminescence properties and dating of glacial to periglacial sediments from northern Switzerland, Geochronology, 2, 305–323, https://doi.org/10.5194/gchron-2-305-2020, 2020.
Murray, A. S. and Wintle, A. G.: Luminescence dating of quartz using an improved single-aliquot regenerative-dose protocol, Radiat. Meas., 32, 57–73, https://doi.org/10.1016/S1350-4487(99)00253-X, 2000.
Murray, A. S., Thomsen, K. J., Masuda, N., Buylaert, J. P., and Jain, M.: Identifying well-bleached quartz using the different bleaching rates of quartz and feldspar luminescence signals, Radiat. Meas., 47, 688–695, https://doi.org/10.1016/j.radmeas.2012.05.006, 2012.
Nivière, B., Bruestle, A., Bertrand, G., Carretier, S., Behrmann, J., and Gourry, J. C.: Active tectonics of the southeastern Upper Rhine Graben, Freiburg area (Germany), Quat. Sci. Rev., 27, 541–555, https://doi.org/10.1016/j.quascirev.2007.11.018, 2008.
Notebaert, B. and Verstraeten, G.: Sensitivity of West and Central European river systems to environmental changes during the Holocene: A review, Earth-Sci. Rev., 103, 163–182, https://doi.org/10.1016/j.earscirev.2010.09.009, 2010.
Olley, J. M., Caitcheon, G. G., and Roberts, R. G.: The origin of dose distributions in fluvial sediments, and the prospect of dating single grains from fluvial deposits using optically stimulated luminescence, Radiat. Meas., 30, 207–217, https://doi.org/10.1016/S1350-4487(99)00040-2, 1999.
Pagel, M.: The mineralogy and geochemistry of uranium, thorium, and rare-earth elements in two radioactive granites of the Vosges, France, Mineral. Mag., 46, 149–161, https://doi.org/10.1180/minmag.1982.046.339.01, 1982.
Peral, M., Marchegiano, M., Verheyden, S., Goderis, S., Van Helden, T., Vanhaecke, F., Van Acker, T., Jia, X., Cheng, H, Fiebig, J., Fourcade, T., Snoeck, C., and Claeys, P.: A new insight of the MIS 3 Dansgaard-Oeschger climate oscillations in western Europe from the study of a Belgium isotopically equilibrated speleothem, Quat. Sci. Rev., 329, 108564, https://doi.org/10.1016/j.quascirev.2024.108564, 2024.
Polymeris, G. S., Giannoulatou, V., Paraskevopoulos, K. M., Pagonis, V., and Kitis, G.: Anomalous fading in thermoluminescence signal of ten different K-feldspar samples and correlation to structural state characteristics, Radiat. Meas., 155, 106789, https://doi.org/10.1016/j.radmeas.2022.106789, 2022.
Prescott, J. R. and Hutton, J. T.: Cosmic ray contributions to dose rates for luminescence and ESR dating: Large depths and long-term time variations, Radiat. Meas., 23, 497–500, https://doi.org/10.1016/1350-4487(94)90086-8, 1994.
Preusser, F. and Degering, D.: Luminescence dating of the Niederweningen mammoth site, Switzerland, Quat. Int., 164, 106–112, https://doi.org/10.1016/j.quaint.2006.12.002, 2007.
Preusser, F., Blei, A., Graf, H., and Schlüchter, C.: Luminescence dating of Würmian (Weichselian) proglacial sediments from Switzerland: Methodological aspects and stratigraphical conclusions, Boreas, 36, 130–142, https://doi.org/10.1111/j.1502-3885.2007.tb01187.x, 2007.
Preusser, F., Degering, D., Fuchs, M., Hilgers, A., Kadereit, A., Klasen, N., Krbetschek, M., Richter, D., and Spencer, J. Q. G.: Luminescence dating: basics, methods and applications, E&G Quaternary Sci. J., 57, 95–149, https://doi.org/10.3285/eg.57.1-2.5, 2008.
Preusser, F., May, J. H., Eschbach, D., Trauerstein, M., and Schmitt, L.: Infrared stimulated luminescence dating of 19th century fluvial deposits from the upper Rhine River, Geochronometria, 43, 131–142, https://doi.org/10.1515/geochr-2015-0045, 2016.
Preusser, F., Büschelberger, M., Kemna, H. A., Miocic, J., Mueller, D., and May, J. H.: Exploring possible links between Quaternary aggradation in the Upper Rhine Graben and the glaciation history of northern Switzerland, Int. J. Earth Sci., 110, 1827–1846, https://doi.org/10.1007/s00531-021-02043-7, 2021.
Preusser, F., Degering, D., Fülling, A., and Miocic, J.: Complex Dose Rate Calculations in Luminescence Dating of Lacustrine and Palustrine Sediments from Niederweningen, Northern Switzerland, Geochronometria, 50, 28–49, https://doi.org/10.2478/geochr-2023-0003, 2023.
Reimann, T., Thomsen, K. J., Jain, M., Murray, A. S., and Frechen, M.: Single-grain dating of young sediments using the pIRIR signal from feldspar, Quat. Geochronol., 11, 28–41, https://doi.org/10.1016/j.quageo.2012.04.016, 2012.
Richter, D., Woda, C., and Dornich, K.: A new quartz for γ-transfer calibration of radiation sources, Geochronometria, 47, 23–34, https://doi.org/10.2478/geochr-2020-0020, 2020.
Riedesel, S., Bell, A. M. T., Duller, G. A. T., Finch, A. A., Jain, M., King, G. E., Pearce, N. J., and Roberts, H. M.: Exploring sources of variation in thermoluminescence emissions and anomalous fading in alkali feldspars, Radiat. Meas., 141, 106541, https://doi.org/10.1016/j.radmeas.2021.106541, 2021.
Riedesel, S., Guérin, G., Thomsen, K. J., Sontag-González, M., Blessing, M., Botha, G. A., Hellers, M., Möller, G., Peffeköver, A., Sommer, C., Zander, A., and Will, M.: A direct comparison of single-grain and multi-grain aliquot luminescence dating of feldspars from colluvial deposits in KwaZulu-Natal, South Africa, Geochronology, 7, 59–81, https://doi.org/10.5194/gchron-7-59-2025, 2025.
Rittenour, T. M.: Luminescence dating of fluvial deposits: Applications to geomorphic, palaeoseismic and archaeological research, Boreas, 37, 613–635, https://doi.org/10.1111/j.1502-3885.2008.00056.x, 2008.
Rixhon, G., Braucher, R., Bourles, D., Siame, L., Bovy, B., and Demoulin, A.: Quaternary river incision in NE Ardennes (Belgium) – Insights from 10Be 26Al dating of river terraces, Quat. Geochronol., 6, 273–284, https://doi.org/10.1016/j.quageo.2010.11.001, 2011.
Serra, E., Mueller, D., Gegg, L., Firla, G., Piccoli, F., Hergarten, S., Margirier, A., and Preusser, F.: Combined single grain and cobble luminescence dating of poorly bleached glaciofluvial deposits from the Swiss Alpine foreland, Quat. Geochronol., 87, 101650, https://doi.org/10.1016/j.quageo.2025.101650, 2025.
Smedley, R. K., Buylaert, J. P., and Újvári, G.: Comparing the accuracy and precision of luminescence ages for partially-bleached sediments using single grains of K-feldspar and quartz, Quat. Geochronol., 53, 101007, https://doi.org/10.1016/j.quageo.2019.101007, 2019.
Spooner, N. A.: The anomalous fading of infrared-stimulated luminescence from feldspars, Radiat. Meas., 23, 625–632, https://doi.org/10.1016/1350-4487(94)90111-2, 1994.
Starnberger, R., Rodnight, H., and Spötl, C.: Luminescence dating of fine-grain lacustrine sediments from the Late Pleistocene Unterangerberg site (Tyrol, Austria), Austrian J. Earth Sc., 106, 4–15, https://doi.org/10.26034/la.atl.2013.476, 2013.
Théobald, N.: Les alluvions anciennes au sud de la Bruche et aux environs d'Obernai (Bas-Rhin), Sciences Géologiques, Bulletins et Mémoires, 8, 83–104, https://doi.org/10.3406/sgeol.1955.1148, 1955.
Thiel, C., Buylaert, J. P., Murray, A., Terhorst, B., Hofer, I., Tsukamoto, S., and Frechen, M.: Luminescence dating of the Stratzing loess profile (Austria) – Testing the potential of an elevated temperature post-IR IRSL protocol, Quat. Int., 234, 23–31, https://doi.org/10.1016/j.quaint.2010.05.018, 2011.
Thomsen, K. J., Murray, A. S., Jain, M., and Bøtter-Jensen, L.: Laboratory fading rates of various luminescence signals from feldspar-rich sediment extracts, Radiat. Meas., 43, 1474–1486, https://doi.org/10.1016/j.radmeas.2008.06.002, 2008.
Tsukamoto, S. and Duller, G. A. T.: Anomalous fading of various luminescence signals from terrestrial basaltic samples as Martian analogues, Radiat. Meas., 43, 721–725, https://doi.org/10.1016/j.radmeas.2007.10.025, 2008.
Wallinga, J.: Optically stimulated luminescence dating of fluvial deposits: A review, Boreas, 31, 303–322, https://doi.org/10.1111/j.1502-3885.2002.tb01076.x, 2002.
Wintle, A. G.: Anomalous fading of thermo-luminescence in mineral samples, Nature, 245, 143–144, https://doi.org/10.1038/245143a0, 1973.
Wuscher, P.: Loess, alluvions et dépôts de pente du Fossé rhénan en Alsace de l'Eemien à l'Anthropocène: Approche pédosédimentaire, géomorphologie et chronostratigraphie, PhD thesis, Université de Strasbourg, 599, https://theses.hal.science/tel-03986431 (last access: 20 January 2025), 2021.
Wuscher, P.: Loess, alluvions et dépôts de pente du Fossé rhénan en Alsace de l'Eemien à l'Anthropocène: Approche pédosédimentaire, géomorphologie et chronostratigraphie. Résumé de thèse, Quaternaire, 34, 135–138, https://doi.org/10.4000/quaternaire.17113, 2023.
Zhang, J. F., Qiu, W. L., Hu, G., and Zhou, L. P.: Determining the age of terrace formation using luminescence dating – A Case of the Yellow River terraces in the Baode area, China, Methods and Protocols, 3, 17, https://doi.org/10.3390/mps3010017, 2020.