the Creative Commons Attribution 4.0 License.
the Creative Commons Attribution 4.0 License.
 | 08 Feb 2021
A comparison of polymineral and K-feldspar post-infrared infrared stimulated luminescence ages of loess from Franconia, southern Germany
Neda Rahimzadeh
Tobias Sprafke
Christine Thiel
Birgit Terhorst
Manfred Frechen
Rahimzadeh, N., Sprafke, T., Thiel, C., Terhorst, B., and Frechen, M.: A comparison of polymineral and K-feldspar post-infrared infrared stimulated luminescence ages of loess from Franconia, southern Germany, E&G Quaternary Sci. J., 70, 53–71, https://doi.org/10.5194/egqsj-70-53-2021, 2021.
Loess-paleosol sequences (LPSs) are essential records for reconstructing Quaternary paleoenvironments. No previous study has provided numerical chronologies of loess in Lower Franconia, southern Germany; their chronostratigraphic assumptions have relied mainly on German (pedo)stratigraphic schemes. In this study, we provide for the first time a chronology for LPSs in Lower Franconia based on optically stimulated luminescence (OSL) dating using quartz and a comparison of K-feldspar (63–100 µm) and the polymineral fraction (4–11 µm). Our results show that all obtained ages are in stratigraphic order, ranging from Holocene to late Pleistocene, and in general confirm the former stratigraphical interpretations. A good agreement of the obtained ages is observed between both feldspar grain size fractions; they also agree well with the quartz OSL ages up to ∼50 ka. However, a marked difference between the growth pattern of the dose response curves and consequently different saturation characteristics of fine and coarse grains is found. Even though in our samples the discrepancy in ages is not very significant, we suggest the use of coarse-grained K-feldspar whenever possible in order to not be confronted with unknowns such as the mineral composition of the polymineral fraction.
Löss-Paläoboden-Sequenzen sind wichtige Archive zur Rekonstruktion der quartären Umwelt. Bisher hat sich noch keine Arbeit mit der numerischen Chronologie mainfränkischer Lösse befasst; die bisherigen chronostratigraphischen Einordnungen haben ihren Ursprung in deutschen (pedo)stratigraphischen Schemata. In der vorliegenden Arbeit stellen wir erstmals eine auf optisch stimulierter Lumineszenz (OSL) basierende Chronologie für Löss-Paläoboden-Sequenzen in Mainfranken vor. Hierzu wurden Quarz und in vergleichender Weise sowohl K-Feldspat (63–100 µm) als auch die polymineralische Feinkornfraktion (4–11 µm) verwendet. Unsere Ergebnisse zeigen, dass alle gewonnenen Alter in stratigraphischer Reihenfolge sind, vom Holozän bis zum Spätpleistozän, und generell die früher angenommenen stratigraphischen Interpretationen stützen. Eine gute Altersübereinstimmung liegt für die beiden Feldspatfraktionen vor; die Alter stimmen weiterhin mit den Quarz-OSL-Altern bis 50 ka überein. Im Vergleich von Feldspat-Grobkorn und Feinkorn (polymineralische Fraktion) zeigt sich bei jedoch ein stark voneinander abweichendes Verhalten in den Wachstumsverläufen der Dose Response Curves und ein sich daraus ergebendes unterschiedliches Sättigungsverhalten. Auch wenn die Unterschiede für die hier vorliegenden Proben nicht übermäßig groß sind, so empfehlen wir, wenn immer möglich, die Verwendung von grobkörnigem K-Feldspat für die Datierung, um nicht mit möglichen Unbekannten, wie der Mineralzusammensetzung von polymineralischen Extrakten konfrontiert zu sein.
- Article
(7036 KB) - Full-text XML
-
Supplement
(314 KB) - BibTeX
- EndNote


Loess-paleosol sequences (LPSs) are complex terrestrial archives of Quaternary landscape evolution that are widely distributed in the temperate zone, allowing for regionalization of past climatic changes and providing information of paleo-geoecological responses to paleoclimatic shifts (Sprafke, 2016). Despite its wide distribution and well-differentiated profiles, loess in Lower Franconia (Germany; Fig. 1) remains poorly studied (Brunnacker, 1956; Semmel and Stäblein, 1971; Skowronek, 1982; Rösner, 1990). Accessible LPSs have been untouched from systematic investigation for 3 decades, and numerical ages are lacking. Current chronological assumptions are only possible by correlating previously identified pedostratigraphic units with the German loess (pedo)stratigraphic scheme (Schönhals et al., 1964; Semmel, 1968) and related chronostratigraphies recently updated by Lehmkuhl et al. (2016); the first well-developed Bt horizon below the present day soil is supposed to represent the Eemian (128–115 ka) paleosol affected by periglacial reworking. One to three early glacial (EG; 115–72 ka) humic horizons (Mosbach Humuszones, MHZs) are superimposed by lower Pleniglacial (LPG; 60–72 ka) colluvial deposits (Niedereschbach Zone, NEZ) and loess. The middle Pleniglacial (MPG; 60–32 ka) is mainly represented by weak to moderate paleosols (Lohne soil, LS, on the top) alternating with loess. The upper Pleniglacial (UPG; 32–15 ka), sometimes characterized by reworked horizons at the base, contains the thickest loess deposits with intercalated tundra gley soils (Erbenheim soils, En), in which the late glacial (LG; 15–11 ka) to Holocene (<11 ka) pedogenesis took place.
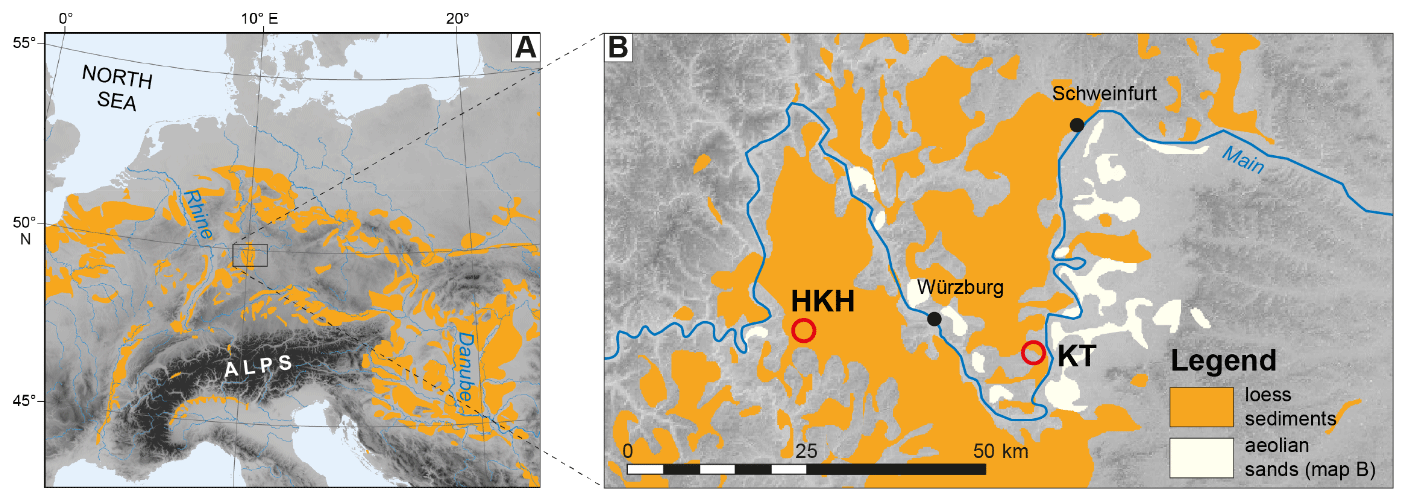
Figure 1(a) Distribution of loess and loess derivates (loess sediments) in Central Europe modified according to Haase et al. (2007) and Sprafke (2016); (b) studied sections (red circles) of Holzkirchhausen (HKH) and Kitzingen (KT) in the Lower Franconian loess region. Loess sediments and eolian sands distribution modified from Lehmkuhl et al. (2018).
To test the validity of pedostratigraphic and thus the preliminary chronostratigraphic assumptions in the area of investigation from the 1970s to late 1980s (e.g., Semmel and Stäblein, 1971; Rösner, 1990), numerical geochronological methods are crucial. Our study provides the first optically stimulated luminescence (OSL) ages of loess from Lower Franconia (NW Bavaria, Germany). OSL dating enables the determination of the time elapsed since the last exposure of sediment to sunlight (Aitken, 1998), and it has been successfully applied for determining the depositional age of eolian deposits, such as loess (e.g., Roberts, 2008). However, in the case of (paleo)soils, OSL dating helps us to understand the timing and rates of soil mixing. Quartz and potassium feldspar are the two most widely used minerals in OSL dating. Although quartz has been found to be a robust and accurate dosimeter (Murray and Olley, 2002), its application is commonly limited to the last 100–150 kyr (Wintle and Murray, 2006). In the quest for extending this limitation, feldspar infrared stimulated luminescence (IRSL) has been suggested. However, the use of feldspar as a dosimeter has major drawbacks including signal loss of IRSL during burial, known as anomalous fading (Spooner, 1994), which can lead to age underestimation. This problem can be accounted for by using IR signals less affected by fading, the so-called post-IR IRSL (hereafter pIRIR) (Thomsen et al., 2008), and post-measurement fading correction models (Huntley and Lamothe, 2001; Kars et al., 2008).
The majority of luminescence dating studies on loess deposition in Europe is based on quartz OSL signals and different IRSL signals from fine-grained (4–11 µm) samples (e.g., Austria: Thiel et al., 2011a, b; Hungary: Novothny et al., 2011; Croatia: Wacha et al., 2011; Germany: Schmidt et al., 2011; Zens et al., 2018; Poland: Moska et al., 2018; Serbia: Fuchs et al., 2008; Schmidt et al., 2010; Romania: Vasiliniuc et al., 2012, 2013; Belgium: Frechen et al., 2001). In contrast, many OSL dating studies of Chinese loess deposits have focused on sand-sized K-rich feldspar extracts (Li and Li, 2012; Buylaert et al., 2015; Yi et al., 2015, 2016; Stevens et al., 2018). Recent comparative studies on the quartz OSL signal from different grain size fractions indicate different saturation characteristics and subsequently different growth pattern of the dose response curve for different fractions and consequently age discrepancies (Timar-Gabor et al., 2011, 2015; Timar-Gabor and Wintle, 2013; Constantin et al., 2015). Using the multi-elevated temperature post-IR IRSL (MET-pIRIR) protocol, Fu et al. (2012) showed consistent results between polymineral fine-grain (FG) and K-feldspar coarse-grain (CG) MET-pIRIR ages for Chinese loess samples. However, there is a lack of direct comparison of obtained IRSL ages for two different grain size fractions extracted from Central European loess. There are few comparative studies about the characteristics of the IRSL signal from polymineral FGs and polymineral, K-feldspar and Na-feldspar CGs (Tsukamoto et al., 2012; Zhang and Li, 2019). Tsukamoto et al. (2012) demonstrate that in both blue and UV detection windows, IRSL and pIRIR signals in polymineral FGs mainly originate from Na-feldspar grains when a lower preheat temperature (260–300 ∘C) is being used. However, Zhang and Li (2019) showed that the standardized growth curves (SGCs) of the K-feldspar, plagioclase and polymineral CGs are very similar in shape and are distinctly different in shape from the polymineral FG SGCs.
In this paper, we aim to present a robust luminescence chronology of Lower Franconian LPSs using pIRIR stimulated at 225 ∘C (hereafter pIRIR225) for different grain size fractions and test the reliability of both FG and CG pIRIR225 ages. When possible, the fast component quartz OSL ages were determined to assess which pIRIR225 ages from different grain size fractions are more accurate. Based on our results of luminescence dating, we then investigate the validity of chronostratigraphic assumptions based on the use of German loess (pedo)stratigraphic schemes.
The studied sections are located on the Mainfranken plateau, an undulating to hilly plain 220 to 400 m a.s.l. (above sea level) made up of Middle Triassic limestones, marls and claystones with a few intercalated sandstone layers. The plateau is incised by the Main river and its tributaries flowing with large deviations in its course from E to W (220 m to 140 m a.s.l., respectively; Fig. 1). Shielded from Atlantic moisture by the highland chain of Odenwald, Spessart and Rhön (400–900 m a.s.l.), annual precipitation is <600 mm. Loess sediments of a few decimeters to more than 10 m thickness cover the plateau. Only a very few profiles investigated during the last century (Rösner, 1990) are accessible; among these, we studied the well-resolved, presumably Late Pleistocene profiles of Kitzingen (KT; ca. 20 km SE of Würzburg) and Holzkirchhausen (HKH; ca. 20 km W of Würzburg) (Fig. 2). Our reconnaissance surveys revealed the presence of most of the stratigraphic units previously reported in the literature.
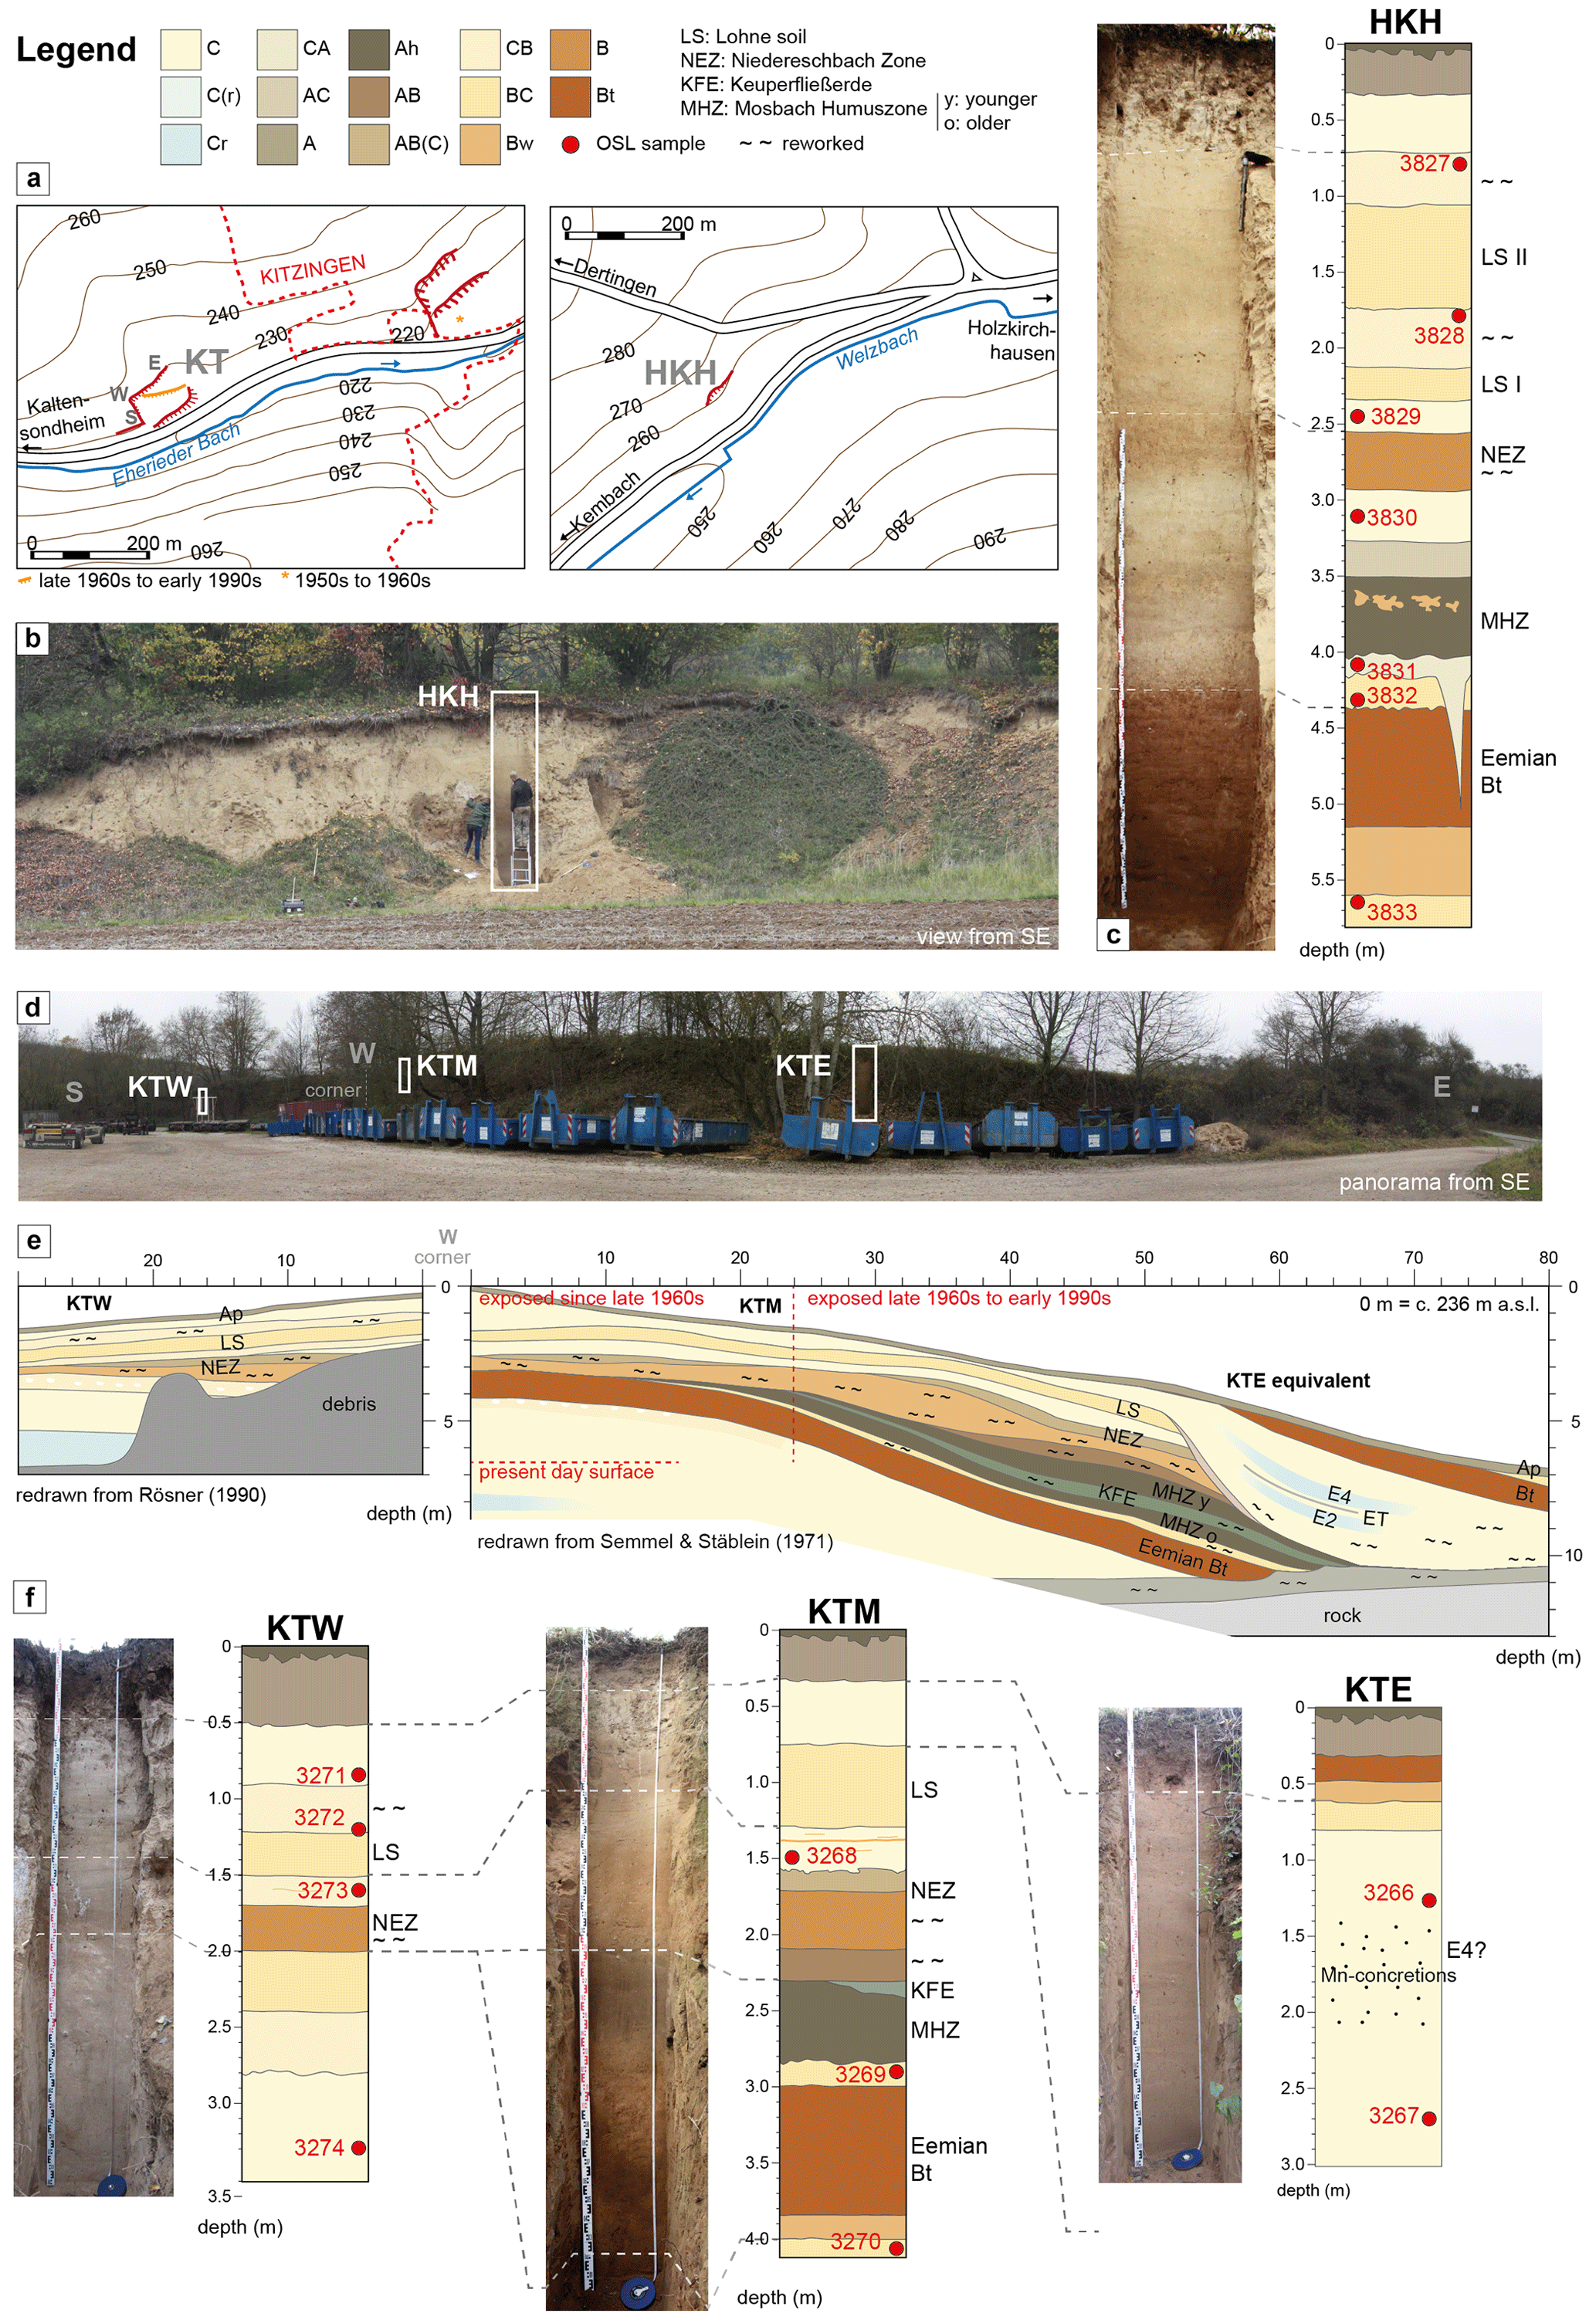
Figure 2Profiles and sample locations. (a) Local topography of KT and HKH. Note for KT the location of the old brickyard studied by Brunnacker (1959) and the location of the outcrop wall studied by Semmel and Stäblein (1971). (b) Overview photo of HKH outcrop. (c) Photo and HKH profile sketch with position of OSL samples and laboratory codes. (d) KT today with the locations of three studied profiles: KTE, -M and -W. (e) Outcrop sketches of the exposed E wall (Rösner, 1990) and the exposed S wall (Semmel and Stäblein, 1971); the latter shifted further north in the 1990s (Fig. 2a). (f) Photos and sketches of the studied KT profiles with the position of OSL samples with laboratory codes.
The LPS KT (Fig. 2a, d, e and f) is exposed at the former Pavel and Becker loam pit 2.5 km west of Kitzingen city on the northern side of the road to Kaltensondheim (236 m a.s.l.; profile KTM, 49∘44′7.98′′ N, 10∘7′43.51′′ E). The road follows the bottom of the asymmetric valley of the Eherieder Bach, a small tributary to the Main river (Fig. 2a). The valley cuts Middle Triassic claystones, marls (lower Keuper) and limestone (Muschelkalk). Old maps show that the loam extraction has advanced since the investigations of Semmel and Stäblein (1971) and Rösner (1990). Only the upper 4 to 5 m of the up to 12 m thick LPS are available due to the partial filling of the pit (Fig. 2d and e). Sketches of the former outcrop by Semmel and Stäblein (1971) and Rösner (1990) testify to the large lateral variability of stratigraphic units (Fig. 2d). The presumably Eemian paleosol formed in over 5 m thick, weakly differentiated penultimate glacial loess. Up to two MHZs separated by a clayey, greenish colluvial layer of local material (Keuperfliesserde; KFE) are present in the central part of the SW-facing outcrop. An erosive colluvial phase led to the erosion of a major part of the MHZs and even the last interglacial Bt horizon in the W part of the outcrop, leaving a reddish-brown colluvial layer (NEZ) there. A few decimeters of loess and a moderately developed paleosol, referred to as LS, are superimposed (Rösner, 1990; Semmel and Stäblein, 1971). Thick UPG loess is found in a paleo-depression which is incised into the early glacial sequence in the E part of the outcrop. In total, three profiles were excavated in the outcrop (Fig. 2d and f). KTE (3 m thick) exposes the youngest loess deposits in the paleo-depression of the eastern part of the outcrop, whereas KTM ca. 35 m further west (4.2 m thick) allows access to all major units of the standard stratigraphy (i.e., LS, NEZ, MHZs, Eemian Bt) down to the penultimate glacial loess. KTW (3.5 m thick) is situated in the exposed E outcrop wall with a major hiatus between the NEZ and the penultimate glacial loess according to Rösner (1990).
The LPS HKH (Fig. 2a–c; Holzkirchhausen II according to Rösner, 1990) is located in a small former loam pit 1.5 km west of the village of Holzkirchhausen at 265 m a.s.l. (49∘45′31.89′′ N, 9∘38′50.01′′ E). It is situated on a SE-facing smooth slope ca. 70 m north of the road to Kembach, which is located downstream of the Kembach valley (Fig. 2a). The local geology is made up of Lower Triassic red claystone covered by loess sediments of varying thickness. The outcrop is ca. 10 m wide and shows little lateral variation, with the lower horizons dipping slightly towards the west (Fig. 2b). According to Skowronek (1982), the strongly developed basal paleosol of HKH overlies the local claystone, but in our profile, this paleosol developed in loess sediments. Rösner (1990) provides a detailed description of the profile (her Holzkirchhausen II profile). The pedostratigraphic designations follow the standard nomenclature of SW and central Germany (Schönhals et al., 1964; Semmel, 1968) outlined above and marked in Fig. 2c. The main features of the HKH profile are the Eemian Bt horizon at the bottom, one MHZ separated from the NEZ by loess and a twofold LS. There is no indication of thick upper Pleniglacial loess at this location.
All four profiles were thoroughly cleaned and described in the field based on color, grain size and structural properties using pedological horizon designations by the FAO (2006) in the way suggested by Sprafke (2016). At both sites, the previously defined pedostratigraphic units could be unambiguously traced except for the Erbenheim soils in the paleo-depression in the E part of the KT outcrop. Pedostratigraphic units by Semmel and Stäblein (1971) and Rösner (1990), as well as sample locations including laboratory codes, are shown in Fig. 2f.
3.1 Sampling, sample preparation and analytical facilities
Luminescence samples were taken from selected stratigraphic units (Fig. 2c and f) by hammering 15–20 cm long steel tubes into freshly cleaned outcrop walls. For paleosol horizons, samples were taken from loess units above and below the well-developed soil horizon (Bt horizon), providing an upper and lower age limit of the soil formation.
Sample preparation for luminescence measurements was carried out under subdued red light at the Leibniz Institute for Applied Geophysics (LIAG), Hannover. The outer ∼2 cm at the ends of the tubes was removed, and the inner material was treated with hydrochloric acid (HCl; 10 %) to remove carbonate, with sodium oxalate (0.1 N) to dissolve aggregates and with hydrogen peroxide (H2O2, 30 %) to remove organic matter. It should be noted that the chemical treatment was done for each grain size fraction separately, i.e., two sediment subsamples were prepared. For the polymineral FG fractions, the 4–11 µm grain size fraction was separated by repeated settling and washing using a centrifuge (cf. Frechen et al., 1996). For the coarse-grain fractions, the 63–100 µm grain size fraction was isolated by wet sieving. Quartz and potassium-rich feldspar grains were then separated using a heavy liquid solution (sodium polytungstate; quartz: ρ≥2.62 g cm−3; K-feldspar: ρ≤2.58 g cm−3). The quartz fraction was further treated with concentrated hydrofluoric acid (40 %) for 1 h to remove any remaining feldspar and the alpha-irradiated outer layer. Subsequently, the purified quartz was treated with HCl (20 %) for about 1 h to dissolve any fluorides which might have built up during HF etching.
For luminescence measurements, the quartz and K-feldspar extracts were mounted as aliquots 2.5 mm in diameter on stainless steel disks using silicone spray as adhesive. The polymineral fraction was settled from deionized water to aluminum disks. All equivalent dose (De) measurements and relevant tests were performed on automated luminescence readers (Risø TL/OSL DA-20; Thomsen et al., 2006) equipped with arrays of blue (470±30 nm) and infrared (870±40 nm) LEDs and calibrated beta sources. The beta sources of the readers were calibrated for both coarse and fine grains. The luminescence signal from quartz grains was detected through a 7.5 mm Hoya U-340 filter and the K-feldspar and polymineral (post-IR) IRSL signals through a combination of Schott BG-39/Corning 7-59 filters (blue-violet light spectrum between 320 and 450 nm).
3.2 Dose rate determination
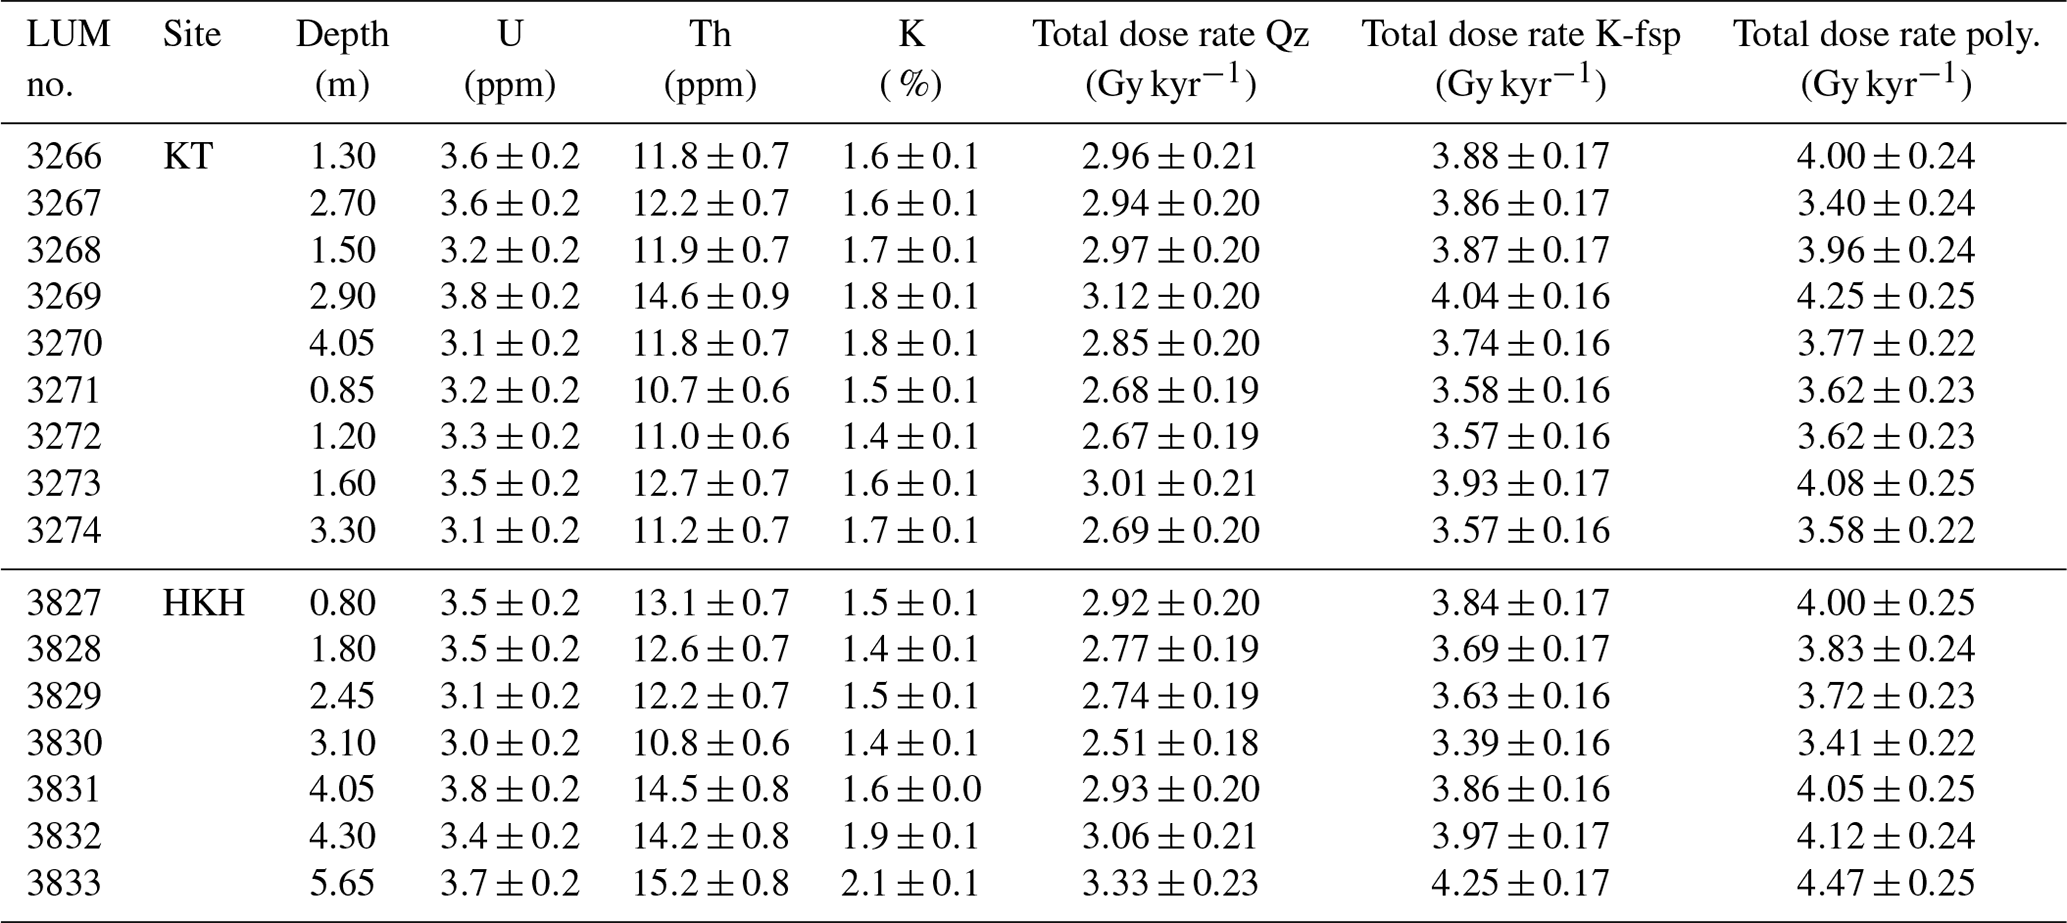
The supplementary material taken from the direct surrounding of each sample was dried, crushed for homogenization, filled into 50 g N-type beakers, sealed and stored for at least 4 weeks to ensure equilibrium between radon and its daughter nuclides. The radionuclide concentrations (238U, 232Th and 40K) were subsequently measured by high-resolution gamma spectrometry; the results are summarized in Table 1. The dose rate conversion factors of Guerin et al. (2011) and beta attenuation factors of Mejdahl (1979) were used for dose rate calculation. A small cosmic dose rate of ∼0.1–0.2 Gy kyr−1 was calculated based on Prescott and Hutton (1994) and Prescott and Stephan (1982). Water content was assumed to be 20±5 % for samples collected from the well-developed pedocomplexes and loess below (i.e., LUM 3269, 3270, 3274, 3831, 3832 and 3833) and 15±5 % for all other samples. These values are in accordance with loess studies from the Neckar region ca. 100 km southwest of our study area with comparable physicogeographical conditions (e.g., Zens et al., 2018). The large error in this estimate is used to account for the possible alterations in water content over geological time. It should also be noted that some of the dose rate uncertainties originate from the difficulty in cosmic dose rate and water content estimation due to variable thickness of overburden sediments over burial time and climatic conditions over that period, respectively. For the coarse-grained feldspar extracts, an additional internal beta dose rate was calculated based on an internal potassium content of 12.5±0.5 % (Huntley and Baril, 1997) and a rubidium content of 400±100 ppm (parts per million; Huntley and Hancock, 2001). As the outer layer of the coarse-grained quartz was removed by HF etching, the contribution of alpha radiation was not taken into account. An a value of 0.08±0.02 (Rees-Jones, 1995) and 0.11±0.02 (Kreutzer et al., 2014) was applied for FG polymineral and CG K-feldspar grains, respectively.
Table 1Summary of the present burial depths, radionuclide concentrations, and calculated quartz (Qz), K-feldspar CGs (K-fsp) and polymineral FGs (poly.) dose rates.
3.3 Equivalent dose measurement
3.3.1 Post-IR IRSL measurements
A single aliquot regenerative (SAR) post-IR IRSL measurement procedure was employed for the De determination of K-feldspar CG and polymineral FG samples. The procedure uses a preheat of 250 ∘C for 60 s and a first IR stimulation at 50 ∘C for 100 s (IR50 signal), followed by a second IR stimulation at 225 ∘C for 100 s (pIRIR225 signal; Buylaert et al., 2009). The test dose was ∼50 and ∼250 Gy for young and old samples, respectively. In order to reduce the effect of recuperation, an IR illumination at 290 ∘C for 40 s was applied at the end of each measurement cycle. The first ∼3 s of stimulation minus a background from the last ∼10 s was used to construct the dose response curves (DRCs). Dose response curves were fitted using a single exponential function. Full DRCs were obtained from one aliquot per sample (Fig. 3). The dose response and decay curves of the pIRIR225 signals of both the CG K-feldspar and FG polymineral for two representative samples (LUM 3266 and LUM 3270; uppermost and lowermost sample) are shown in Fig. 3.
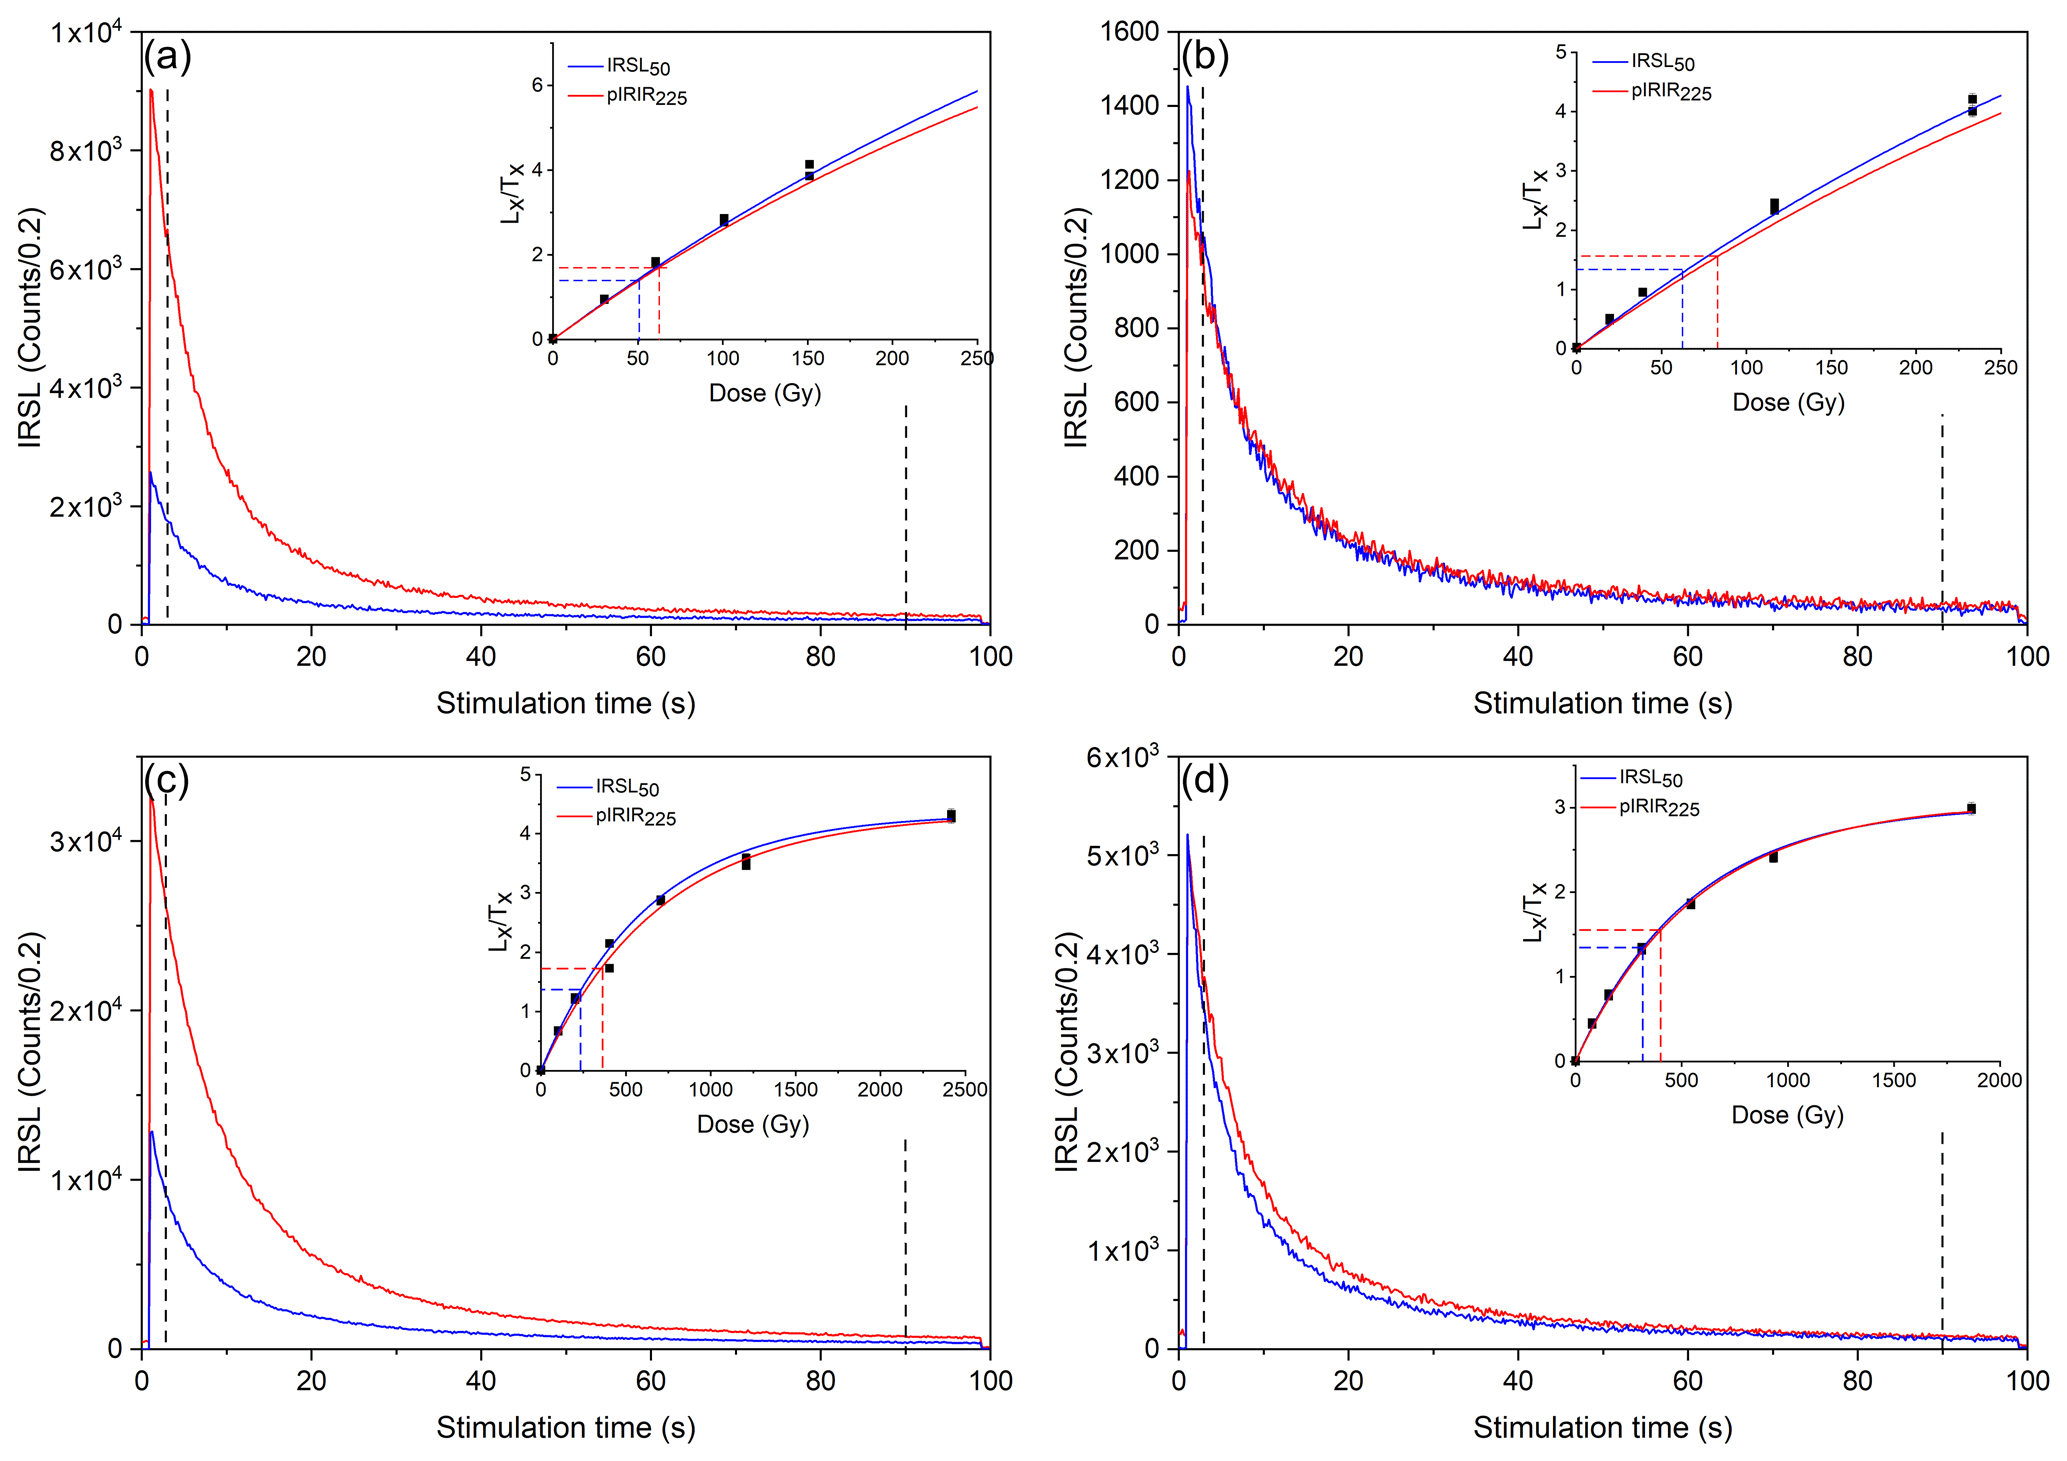
Figure 3Example of (a, c) CG K-feldspar and (b, d) FG polymineral natural IRSL decay curves for pIRIR225 (in red) and its associated IR50 (in blue) signals, with the corresponding dose response curve in the inset, for the representative samples (a, b: LUM 3266 and c, d: LUM 3270). The integration intervals are denoted by the dashed black line.
To determine the equivalent doses, six aliquots per sample (both for CG K-feldspar and FG polymineral) were measured. The mean recycling ratios generated from CG K-feldspar and FG polymineral were 1.001±0.004 and 1.005±0.004, respectively, and recuperation was below 2 %, therefore well within the acceptable range (Murray and Wintle, 2003).
The reliability of the pIRIR225 protocol was checked by means of dose recovery tests for each sample using six aliquots previously bleached for 4 h in a Hönle SOL2 solar simulator. To test whether a given dose could be accurately recovered, three bleached aliquots were then given a dose similar to the natural equivalent dose, and subsequently the pIRIR225 measurement procedure described above was applied. The other bleached aliquots were used for the measurement of the residual dose after bleaching in the solar simulator. Figure 4a and b shows a summary histogram of the measured-to-given dose ratio, with a mean of 0.94±0.01 for CG K-feldspar and 0.96±0.01 for FG polymineral, which is within the suggested range of 0.9–1.1 (Wintle and Murray, 2006). All the measured residual doses were negligible (≤6 Gy) with respect to the measured De values; they were not subtracted from the measured De values for the final age calculation.

Figure 4Summary of measured-to-given dose ratios for (a) the K-feldspar CG and for (b) the polymineral FG pIRIR225 signals.
To test the athermal stability of the feldspar signals, fading experiments following Auclair et al. (2003) were run on the aliquots previously used for dose recovery tests. The fading rate is expressed by the g value, where g is the percentage signal loss per decade of time (Aitken, 1985). We applied two fading correction models. The Huntley and Lamothe (2001) fading correction model was used for samples for which the luminescence ages are <50 ka and correspond to the linear part of DRC (Huntley and Lamothe, 2001). The fading correction for samples with ages up to field saturation was performed using the Kars et al. (2008) fading correction model, which is known to correct anomalous fading for older samples with ages in the nonlinear part of the DRC (Li et al., 2019).
3.3.2 Blue OSL measurements
First, the purity of quartz samples was checked by examining the IR depletion ratio (Duller, 2003), which was for all samples within 10 % of unity, indicating that there is no significant feldspar contribution to the OSL signal.
The quartz De values were obtained using a SAR protocol (Murray and Wintle, 2000, 2003). In order to select the most appropriate thermal treatment, preheat plateaus were measured on two representative samples (LUM 3266, KT; LUM 3827, HKH). The temperatures were set to 160–280 ∘C with an interval of 20 ∘C; the cut heat was 20 ∘C lower than the preheat temperature. A preheat of 260 ∘C (10 s) and a cut heat of 240 ∘C (0 s) was selected for the final De measurements, which were then conducted on 12 aliquots per sample. The test dose used for all samples was ∼10 Gy. At the end of each SAR cycle, a high-temperature blue light illumination (280 ∘C for 60 s) was carried out.
For De calculations, the signal integrated over the initial ∼0.4 s minus the immediate ∼0.5–1.5 s (early background subtraction; Cunningham and Wallinga, 2010) was used, and the DRC were fitted using a single saturating exponential function (Fig. 6). The characteristic saturation dose (D0) of ∼80 Gy suggests that the upper dose limit for quartz signal is about 160 Gy. Since most of the samples were found to be in saturation (De>2D0; Wintle and Murray, 2006; Fig. 6b), the quartz ages were obtained for six samples only, all of which are expected to be in the datable range according to the field stratigraphy. For all samples, recycling was <10 %, and recuperation was <5 %. The suitability of the protocol was tested by means of dose recovery tests on three aliquots per sample. Prior to measurements, the aliquots were bleached in the luminescence reader using two blue stimulations for 1000 s separated by a 10 000 s pause. The aliquots were then given a dose close to the expected De value and measured using the same SAR protocol. For all samples, the dose recovery ratio falls within 10 % of unity (Fig. 5b).
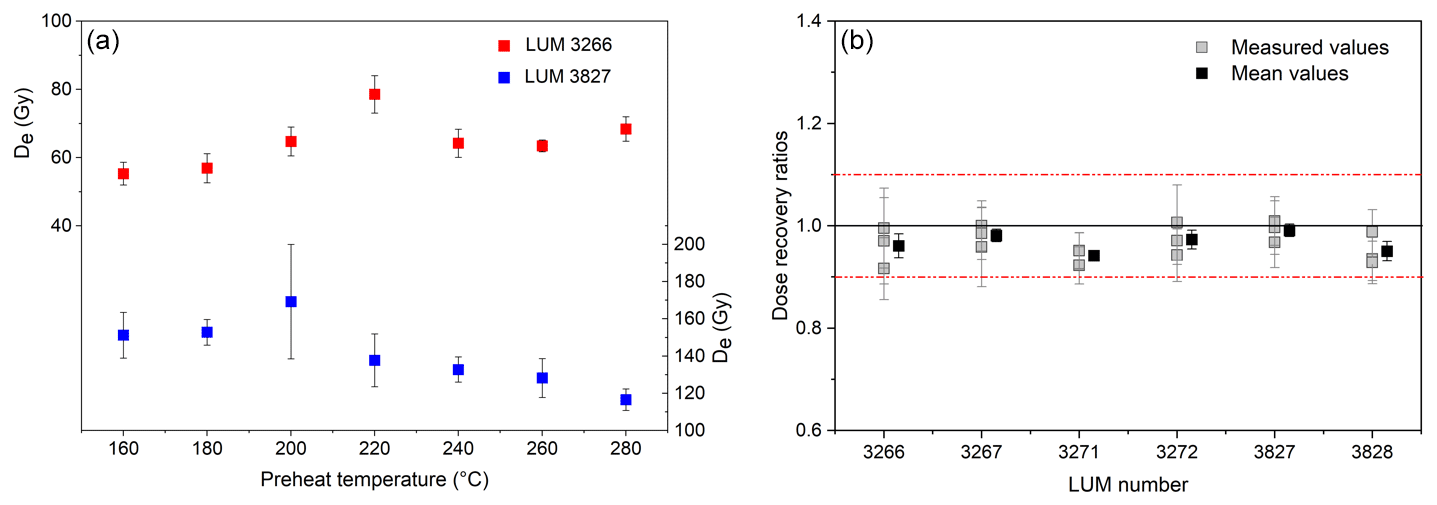
Figure 5(a) Preheat plateau using varying preheat temperatures conducted on two representative samples (LUM 3266, 3827); (b) dose recovery test conducted on all measured quartz samples.
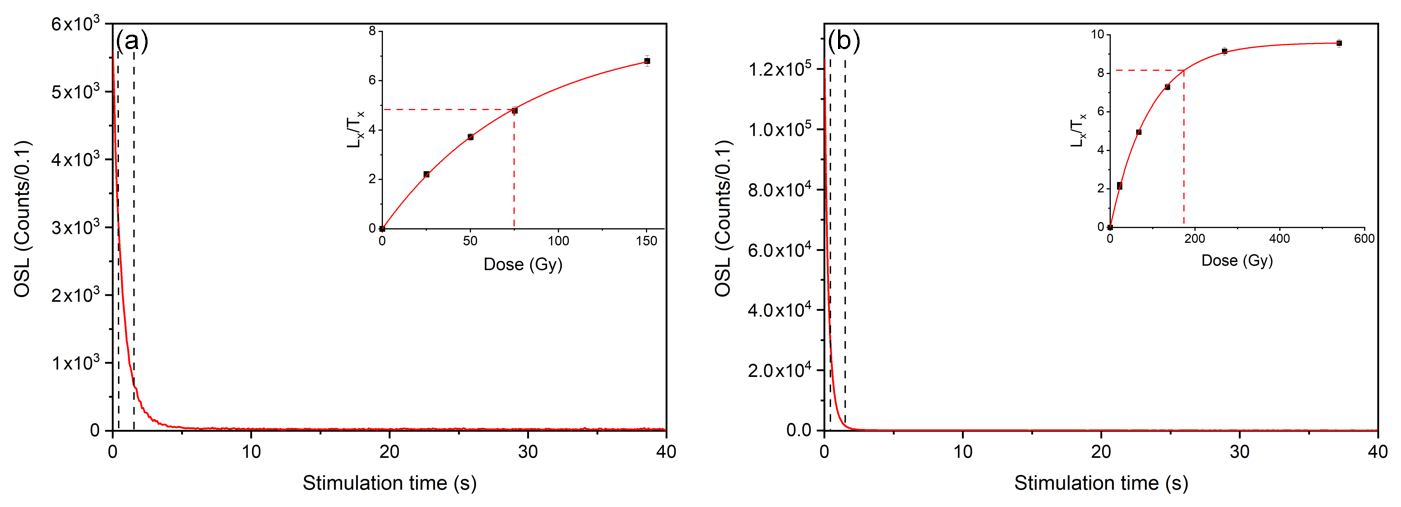
Figure 6Natural blue OSL decay curve and dose response curve (inset) for representative young and old samples, respectively (a: LUM 3266 and b: LUM 3268 with quartz OSL signal in saturation). The integration intervals are denoted by the dashed black line.
4.1 CG K-feldspar and FG polymineral De and apparent pIRIR ages
The De values of 16 samples from two different sections were measured using the pIRIR225 protocol for FG polymineral and CG K-feldspar multi-grain aliquots, and the measurement results and calculated ages are listed in Table 2. The non-fading-corrected final pIRIR225 De values for FG polymineral samples range between 72±1 and 393±12 Gy (KT) and 124±1 and 431±12 Gy (HKH), with corresponding ages ranging from 18±1 to 110±7 ka (KT) and 31±2 to 97±6 ka (HKH). The non-fading-corrected final pIRIR225 De values determined for CG K-feldspar samples range between 59±1 and 357±10 Gy and 111±1 and 379±11 Gy, with corresponding ages ranging from 15±1 to 100±5 ka and 29±1 to 89±4 ka, for KT and HKH, respectively.
Table 2Equivalent doses (Gy) and ages (ka) for quartz OSL, K-feldspar CG (K-fsp) and polymineral FG (poly.) pIRIR225. The corrected CG pIRIR225 ages are being used for discussion. For details see text.
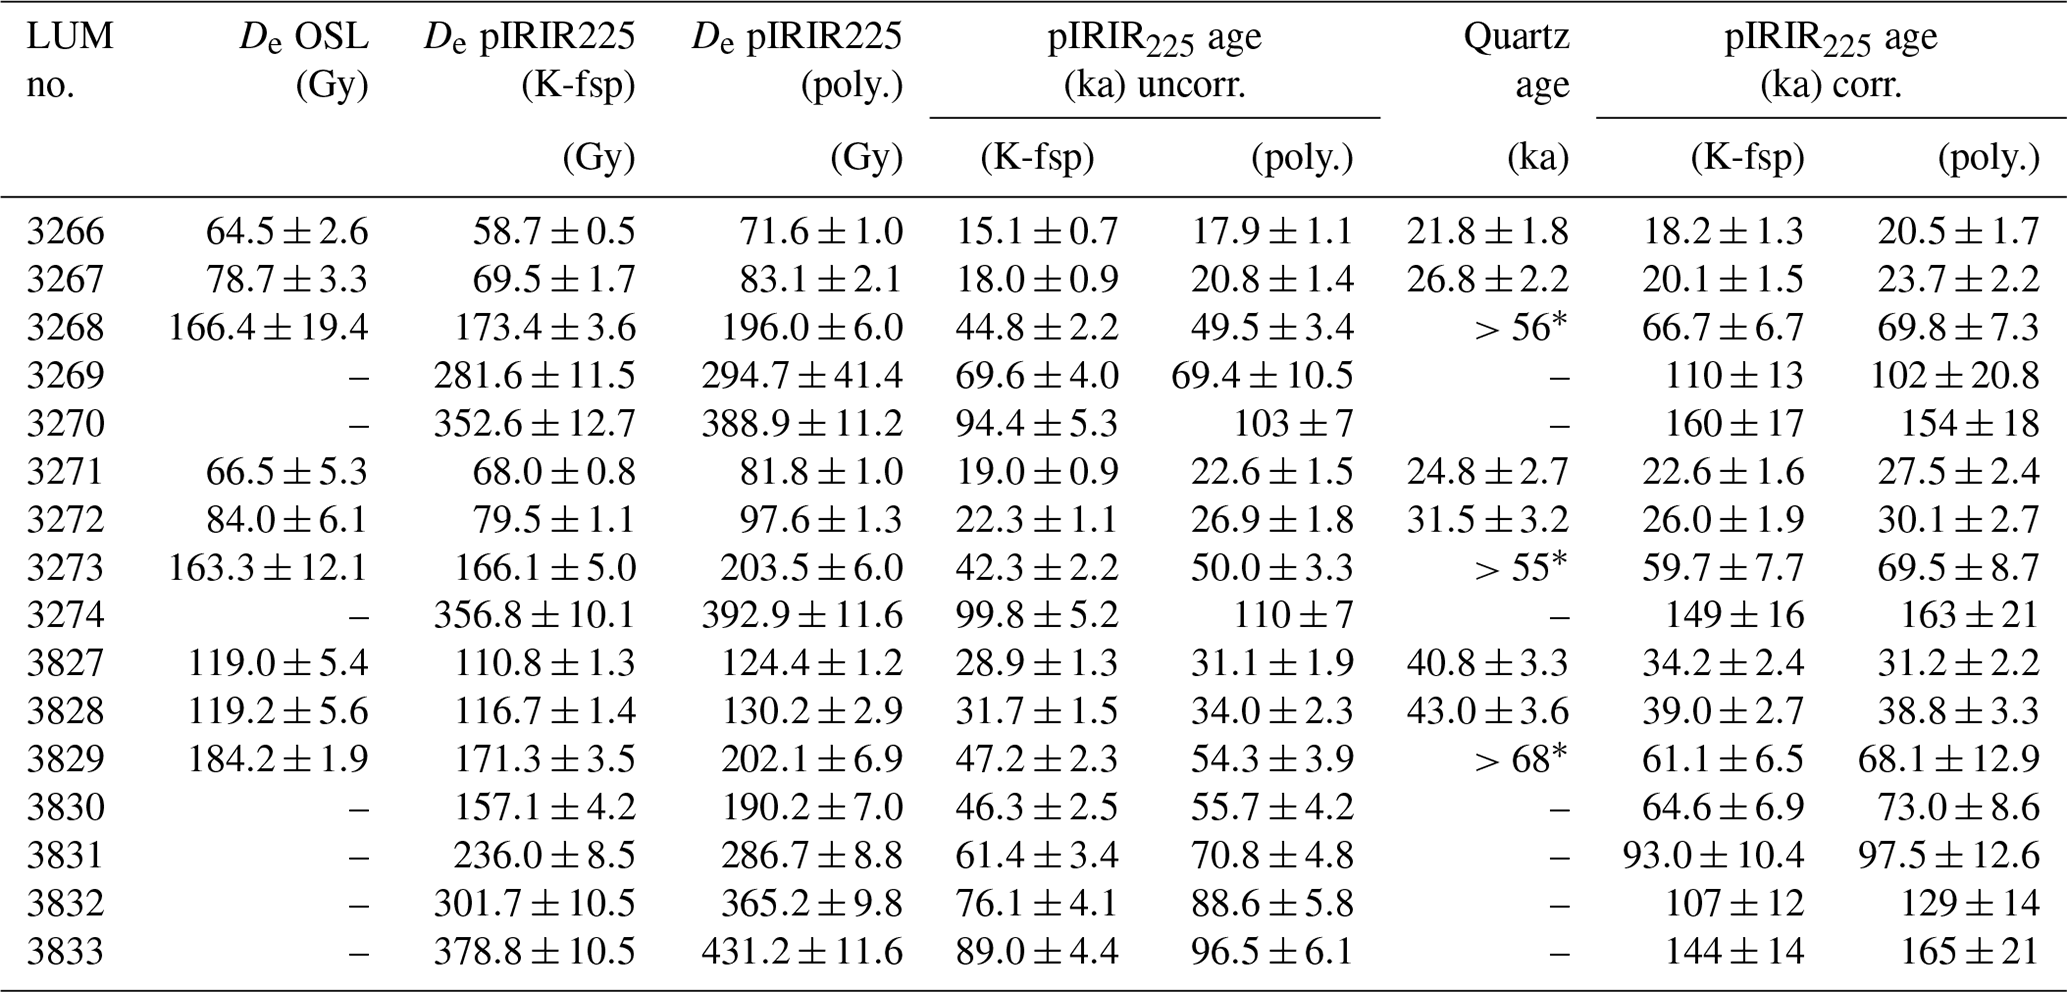
* Minimum ages due to saturation of the quartz OSL signal.
4.2 Fading correction
Fading measurements indicate significantly different fading behavior between the pIRIR225 and the corresponding IRSL50 signals with a mean g2 d value of 4.0±0.2 % for the IRSL50 signals and a mean g2 d value of 1.9±0.10 % for the pIRIR225 signals (Fig. 7a, d). It is interesting to note that the fading rates of FG polymineral samples, both IR50 and pIRIR225, are slightly lower than the fading rates of CG K-feldspar samples (Fig. 7d, e and f), which implies a higher athermal stability of the FG polymineral luminescence signals. The observed difference in fading rate may originate from the Na-feldspar grains in the mineralogical composition of the FG extracts which tend to have lower fading rates (Huntley et al., 2007; Huot and Lamothe, 2012); however, it has to be noted that none of the associated papers report the detection window that was used in their study. For the pIRIR225 signals of the FG polymineral samples, the mean g2 d value is 1.8±0.1 % per decade (Fig. 7b), which is lower than the g2 d value of the pIRIR225 signal for CG K-feldspar samples (2.2±0.1 % per decade; Fig. 7c).
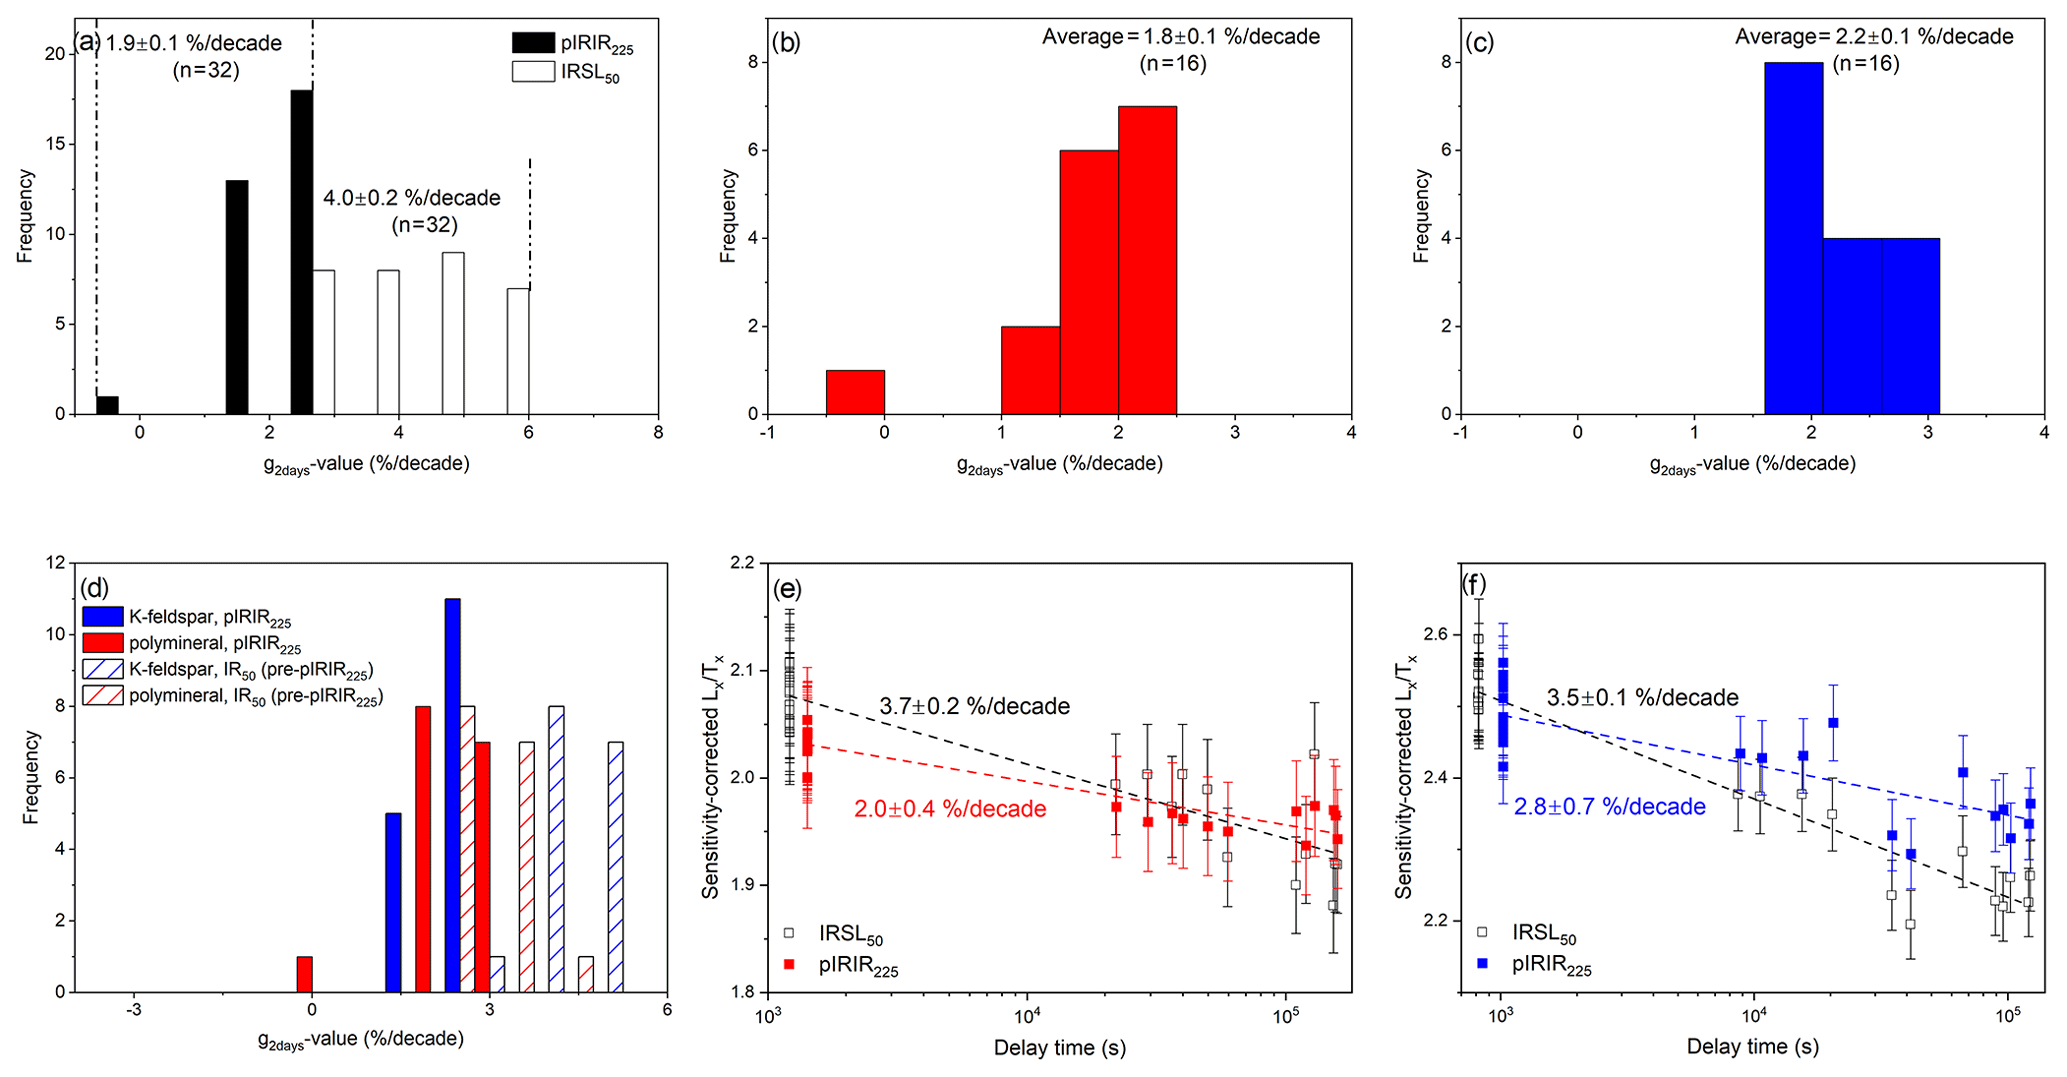
Figure 7Histogram summarizing average fading rates of (a) IR50 and pIRIR225, (b) FG polymineral of pIRIR225, (c) CG K-feldspar of pIRIR225, and (d) anomalous fading of IR50 (pre-pIR225) and pIRIR225 signals of both grain size fractions for all samples; fitting of luminescence sensitivity and delay time of IR50 and pIRIR225 for (e) FG polymineral and (f) CG K-feldspar for sample LUM 3270.
The Huntley and Lamothe (2001) fading correction model was applied to all samples for which the non-fading-corrected pIRIR225 ages are <40 ka (Table 2). The fading-corrected CG K-feldspar pIRIR225 ages vary from 18±1 to 26±2 ka (KT) and 34±2 to 39±3 ka (HKH), while the fading-corrected FG polymineral pIRIR225 ages are between 21±2 and 30±3 ka (KT) and 31±2 and 39±3 ka (HKH) (Table 2).
The Kars et al. (2008) fading correction model was applied to the other samples. The final corrected pIRIR225 ages range from 67±7 to 160±17 ka (KT) and from 61±7 to 144±14 ka (HKH) for CG K-feldspar samples and from 70±7 to 163±21 ka (KT) and from 68±13 to 165±21 ka (HKH) for FG polymineral samples (Table 2).
4.3 Dose response curves and saturation characteristics of different grain size fractions
Based on the age calculation for both FG polymineral and CG K-feldspar, all calculated ages are stratigraphically consistent within errors, which allows us to have a reasonable degree of confidence in these ages. The fading-corrected FG polymineral and CG K-feldspar pIRIR225 ages agree within uncertainty (1σ) for all of the samples (Fig. 8, Table 2).

Figure 8Comparison of CG K-feldspar pIRIR225 ages with FG polymineral pIRIR225 ages for KT (in red) and HKH (in blue). The solid line is the 1:1 line, and the dotted red lines represent ±10 %.
The comparison of the natural DRCs of FGs and CGs for the lowermost samples (LUM 3270 and 3833, KT and HKH, respectively; Fig. 9c, d) shows different saturation characteristics of the fine-grained fraction compared to coarse-grain DRCs and a large divergence in shape and growth of DRCs which may cause the age discrepancy. Although the DRCs of the two grain sizes investigated also have the different shape for the youngest samples (LUM 3266 and 3828, KT and HKH, respectively; Fig. 9a, b), this discordance is less problematic as the obtained De values lie in the linear region of the DRCs. Furthermore, different D0 values of FG and CG samples were observed (Fig. S1 in the Supplement). In particular, the K-feldspar CG fractions yield much larger D0 values than the polymineral FG fractions for most of the samples except for the four youngest samples of KT (LUM 3266, 3267, 3271, 3272), which is consistent with previous observations (Li et al., 2019; Zhang and Li, 2019). These observations suggest that the pIRIR signals from CG K-feldspar may allow for the dating of even older samples compared to FG; this, however, has not been systematically tested. Zhang and Li (2019) attributed this discordance between the FG and CG SGCs to either the difference in alpha irradiation received in nature – as the grain size decreases, the surface volume ratio increases, and so more alpha irradiation will be received – or the removal of the alpha irradiated outer layer of CGs using HF. Interestingly, Timar-Gabor et al. (2017) reported negative correlations between D0 values of DRCs of quartz and grain size.
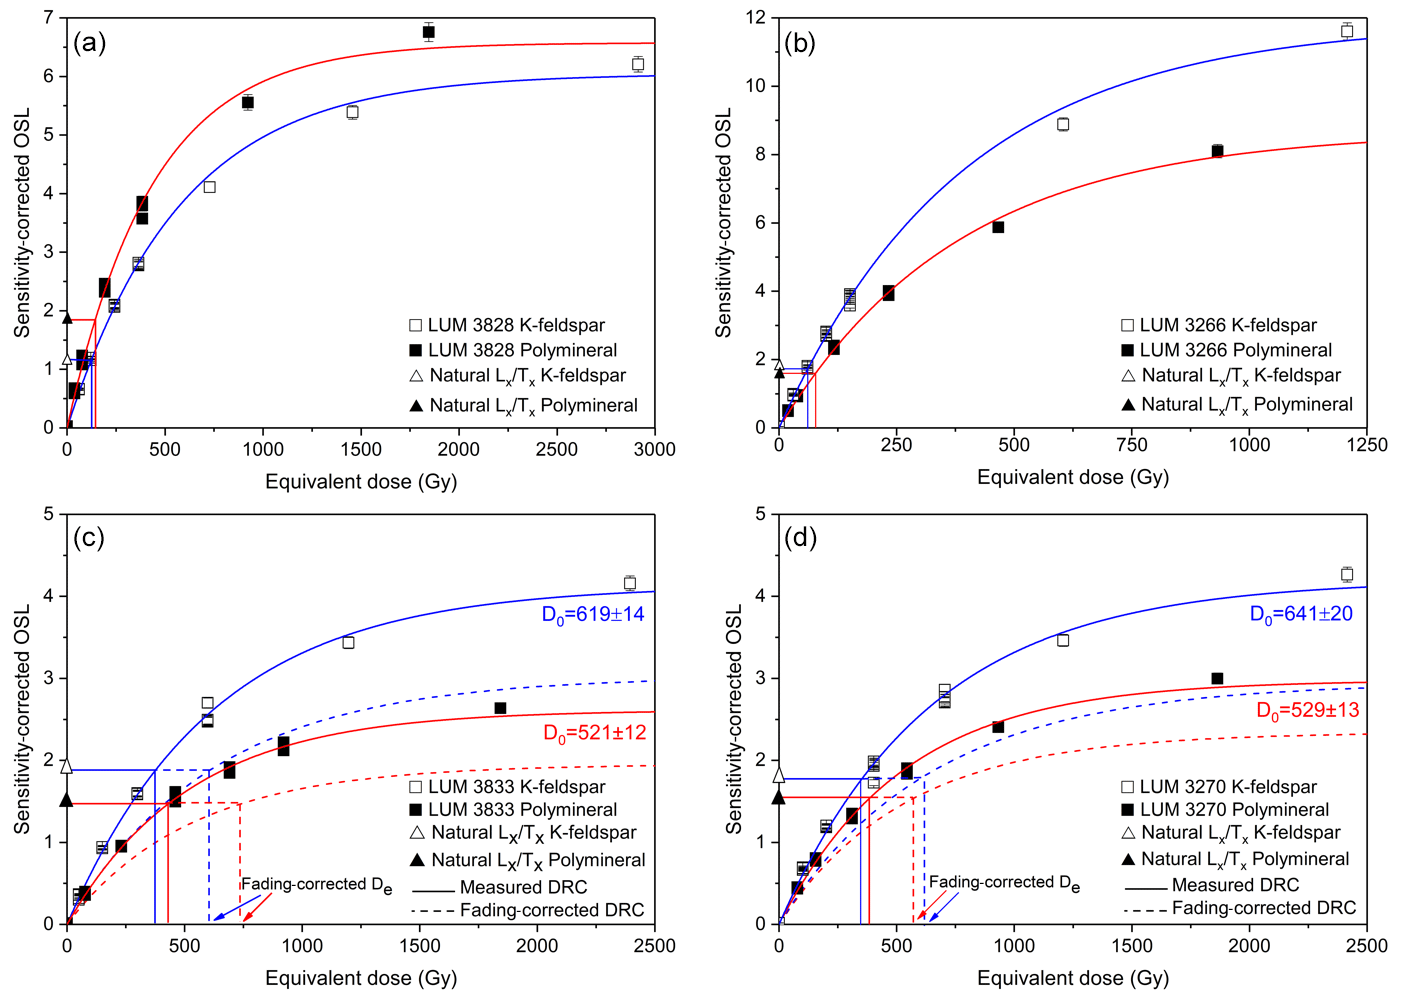
Figure 9Dose response curves of (a, b) uppermost samples and (c, d) lowermost samples from HKH and KT, respectively. The fading-corrected DRCs for the two lowermost samples (c, d) was constructed following Kars et al. (2008), and fading-corrected De values were determined by interpolating the natural intensity onto the fading-corrected DRCs.
4.4 Quartz OSL ages: age comparison
The robustness of derived luminescence ages from FG polymineral and CG K-feldspar measurements remains uncertain and would need additional supporting chronological data to be validated. For studied samples without independent age control, reliable fast component quartz OSL ages can be obtained at least up to 40–50 ka (maximum De of about 120–150 Gy; Buylaert et al., 2007). Since most of the quartz samples are close to or beyond saturation (Fig. 6b), quartz ages are only presented for those samples for which De<2D0 (∼160 Gy) (Wintle and Murray, 2006). The OSL ages of these samples are then considered the most reliable age estimates available to evaluate the accuracy of both FG polymineral and CG K-feldspar pIRIR225 dating.
Quartz OSL ages are available for the six youngest samples; the ages range from 22±2 ka (LUM 3266; KT) to 43±4 ka (LUM 3828; HKH) (Table 2). In Fig. 10, a comparison of quartz OSL ages with FG and CG pIRIR225 ages is shown. There is a similar trend for both sets of pIRIR ages; most of the pIRIR ages agree with corresponding quartz OSL ages within 1σ uncertainty except one CG sample (LUM 3267) and one FG sample (LUM 3271) which both agree within 2σ uncertainty. These observations are in agreement with the results of Fu et al. (2012). They used the MET-pIRIR protocol for Late Pleistocene Chinese loess samples and indicated that the MET-pIRIR ages of FG polymineral samples are consistent with the CG K-feldspar MET-pIRIR ages, quartz OSL ages and stratigraphic ages. Moreover, the comparison of ages derived from quartz OSL and pIRIR signals further verifies the fully bleached pIRIR225 signals, considering that the quartz OSL signal bleaches much faster than any IRSL signal; the post-IR IRSL signal bleaches more slowly than the IRSL50 signal (Buylaert et al., 2012; Murray et al., 2012; Colarossi et al., 2015; Möller and Murray, 2015). Frouin et al. (2017) compared the FG polymineral ages with CG K-feldspar ages and quartz OSL ages (Guérin et al., 2015) in order to evaluate bleaching and thus distinguish the depositional processes. Their results showed that the FG pIRIR290, CG pIRIR290 and quartz OSL ages agree for most of the samples except for two samples which are attributed to colluvium deposits and for which CG ages significantly overestimate the FG and quartz ages. For those two layers, the consistency between their FG pIRIR290 ages and CG pIRIR160 ages suggested that the fine grains may have been sufficiently exposed to sunlight, considering that the bleachability of the IRSL signals decrease with increasing stimulation temperature (Poolton et al., 2002; Buylaert et al., 2012; Colarossi et al., 2015; Tsukamoto et al., 2017).
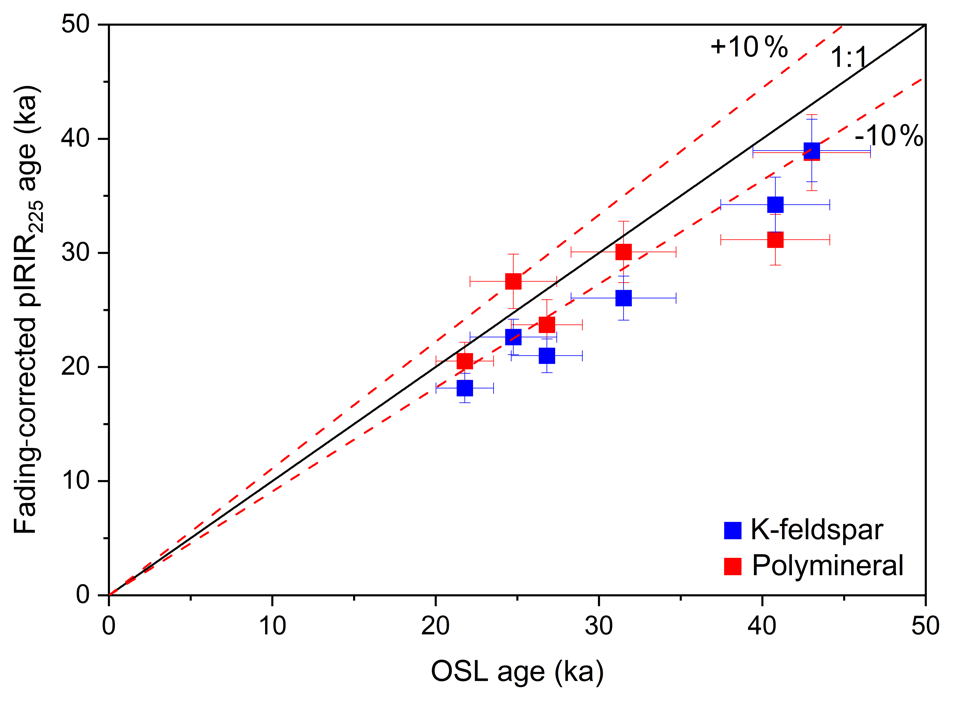
Figure 10Comparison of quartz OSL ages with CG K-feldspar (in blue) and FG polymineral (in red) pIRIR225 ages. The solid line is 1:1 line, and the red dotted lines represent ±10 %.
4.5 Thermoluminescence experiments: origin of the signals
It has consistently been reported that the intensity of elevated temperature pIRIR signals of K-feldspar is much higher than the prior IRSL signal at low temperature (Thomsen et al., 2008; Buylaert et al., 2009). However, the intensity of the pIRIR225 signals of polymineral fine grains is similar to or lower than that of the prior IRSL50 signal (Fig. 3a, c) which was also observed by Wacha and Frechen (2011) and Thiel et al. (2011b) for loess from Croatia and Austria, respectively, but is in contrast to other studies (e.g., Thiel et al., 2011a). Tsukamoto et al. (2012) suggested that the effect of stimulation temperature might be different between K-feldspar and polymineral fine grains resulting in different signal intensities. One possible explanation might be related to different luminescence properties for feldspar in different grain size fractions and mineral compositions as the IRSL signal of the FG polymineral fraction is mainly derived from Na-rich feldspar (Tsukamoto et al., 2012). We therefore examined the thermoluminescence (TL) glow curves and loss of TL signal after IR stimulation in order to explore the origin of the IRSL and pIRIR signals and investigate the relationship between IRSL and TL signals (Duller, 1995; Murray et al., 2009; Tsukamoto et al., 2012). An aliquot of two representative samples (LUM 3270 and 3833) was mounted as loose grains in stainless steel cups and sensitized through repeated cycles of irradiation and annealing. The TL response to a ∼40 Gy regenerative dose was then measured in four sets of experiments: after a preheat of 60 s at 250 ∘C (set 1), IR stimulation at 50 ∘C for 100 s (set 2), hold temperature at 225 ∘C for 200 s (set 3) and pIRIR stimulation at 225 ∘C for 200 s (set 4). TL glow curves up to 500 ∘C with a heating rate of 5 ∘C s−1 were measured and the background signal measured during a second heating was subtracted. The lost TL resulting from IR and pIRIR stimulations was obtained by the difference between two TL glow curves, i.e., one measured without and one measured with IR stimulation (TL set 1/set 3 – TL set 2/set 4; Tsukamoto et al., 2012).
Figure 11 shows the TL signals from a CG K-feldspar and FG polymineral sample (LUM 3833) following various IRSL and pIRIR stimulations. The TL glow curves are shown in Fig. 11a and b and the loss of TL due to IRSL and pIRIR stimulations in Fig. 11c and d. Similar results were also observed for sample LUM 3270. The regenerated TL signal after a preheat with no IR stimulation shows a peak centered at ∼350 ∘C for both grain size fractions. However, a tail of the higher temperature was observed in the FG polymineral sample. The IR stimulation at 50 ∘C clearly depletes the main peak at ∼350 ∘C while simultaneously optically transferring charge into low-temperature TL peaks. The TL peak position after IR stimulation at 50 ∘C in FG polymineral samples shifted slightly to the higher temperature region (i.e., ∼380 ∘C). The holding of the sample at 225 ∘C for 200 s resulted in a small reduction in the peak intensity at the lower temperature side. The TL peak after IR stimulation at 225 ∘C remains unaffected in the CG K-feldspar sample. However, a small reduction in the TL peak at the lower temperature region was observed in the FG polymineral sample. In general, the FG polymineral sample shows an asymmetrical peak at ∼380 ∘C with the shoulder on the higher temperature and a tail spreading up to 500 ∘C. In contrast, the CG K-feldspar sample shows a narrower TL peak than FG polymineral samples at ∼350 ∘C, with an absence of a higher temperature shoulder. The lost TL curves (Fig. 11c, d) further show which regions of the glow curve are reduced by the IR and pIRIR stimulations. A peak centered at ∼340–350 ∘C was obtained, indicating the TL component at ∼350 ∘C is the most IR sensitive and is the main source of IR-bleachable TL peaks, which is in agreement with conclusions of Li and Li (2011) and Wang et al. (2014). Tsukamoto et al. (2012) observed a double TL loss peak at 320 and 410 ∘C after IRSL with a preheat at 250 ∘C for K-feldspar samples but with the complete absence of the 410 ∘C peak for the polymineral sample. Murray et al. (2009) demonstrated that the main source of the IRSL signal following a preheat at both 320 and 250 ∘C is an IR-bleachable TL peak at 410 ∘C in K-feldspar, which is not observed in our sample. A negative TL peak at low temperature, which is a reflection of phototransfer, indicates the recharging of electron traps during IR stimulation. The phototransfer of charge into low temperature TL peaks located between 100 and 300 ∘C during IR stimulation has also been reported by others (Duller, 1995; Murray et al., 2009; Li and Li, 2011). The main depletion in TL due to pIRIR occurs at ∼320 ∘C for FG polymineral, slightly higher than that of CG K-feldspar (∼310 ∘C). Tsukamoto et al. (2012) showed that the main TL loss peaks during pIRIR stimulation at 225 ∘C are situated at lower temperature for Na-feldspar and polymineral samples (∼320 ∘C) but at higher temperature for K-feldspar samples (∼410 ∘C). They therefore concluded that IRSL and pIRIR signals in polymineral FGs originate mainly from Na-feldspar grains. However, our results showed the similarity in TL loss peak temperature (∼320 ∘C) for both FG polymineral and CG K-feldspar samples.
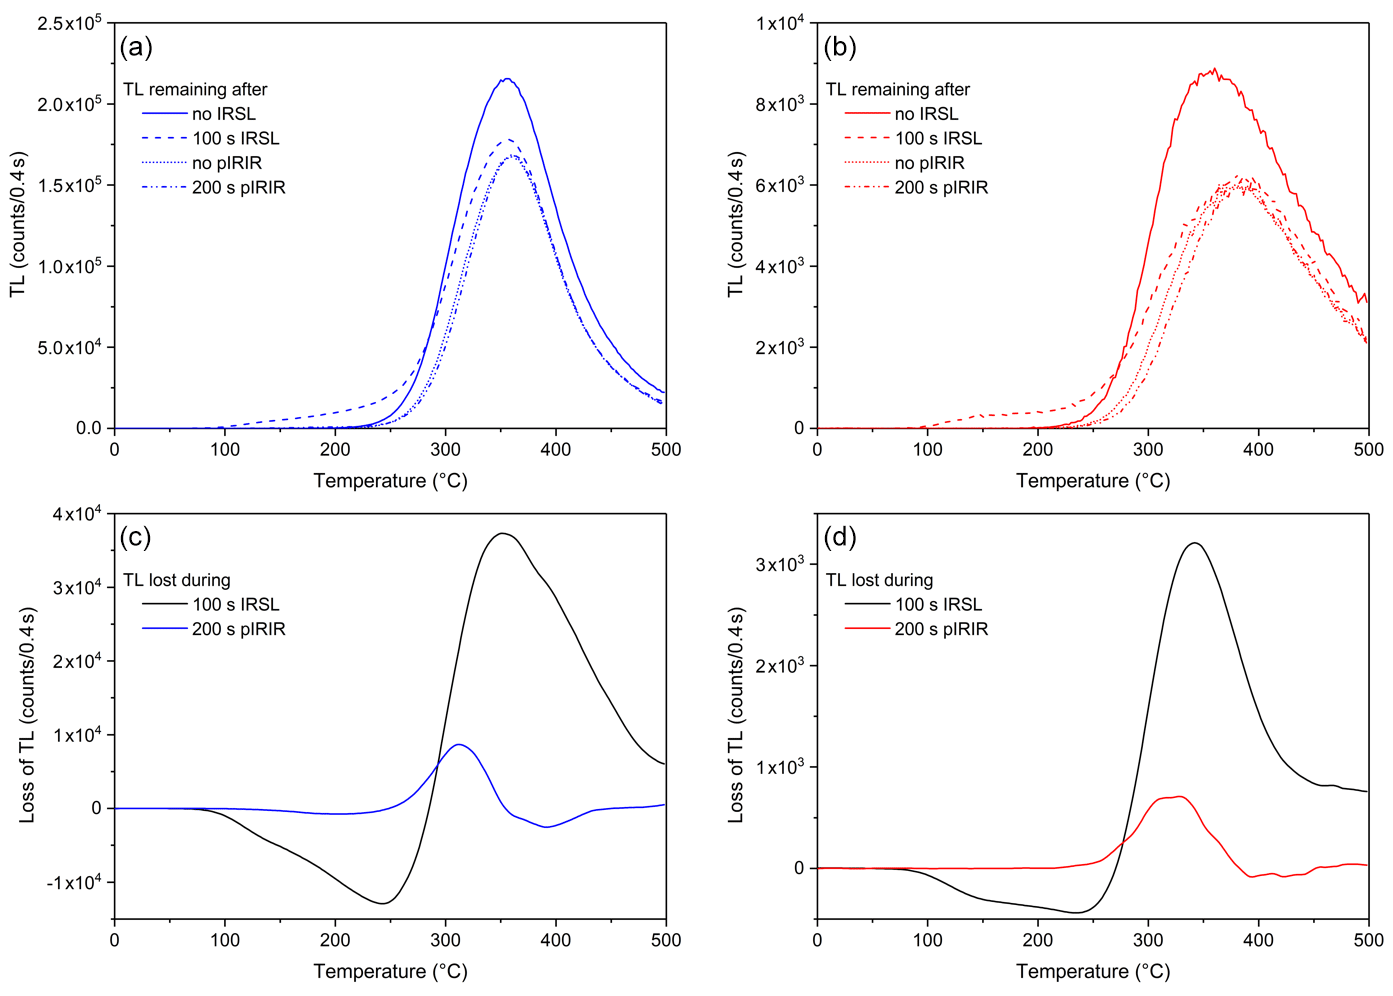
Figure 11(a, b) TL glow curve from (a) CG K-feldspar and (b) FG polymineral sample LUM 3833 after various IR stimulation; (c, d) lost TL as a result of IRSL and pIRIR stimulations for (c) CG K-feldspar and (d) FG polymineral sample LUM 3833.
It should be remembered that feldspars are chemically and structurally complex and display a broad range of compositions, which caused a broad range of thermoluminescence peaks and luminescence behavior (Duller, 1997). Duller (1995) showed that the TL signal loss during IR stimulation for 6000 s increased from high potassium to high sodium contents, and so physical separation of the different types of the feldspar is necessary. The standard approach to isolate a restricted range of mineralogies is density separation using heavy liquid (Wintle, 1997). K-feldspar minerals (2.53–2.56 g cm−3) are separated by heavy liquid (of density <2.58 g cm−3) since they are lighter than plagioclase (>2.61 g cm−3) and Na-feldspar (2.58–2.62 g cm−3). However, it should be noted that other studies (i.e., scanning electron microscopy with energy dispersive X-ray spectroscopy, SEM-EDX; X-ray diffractometry, XRD; and inductively coupled plasma optical emission spectroscopy, ICP-OES) have indicated that Na-feldspar grain contamination in the K-rich fraction and vice versa is possible (Huot and Lamothe, 2012; Tsukamoto et al., 2012; Sohbati et al., 2013; Thiel et al., 2015). Therefore, investigating the mineral composition in more detail, e.g., SEM-EDX, may be a powerful approach to assess the OSL behavior of the samples. If carrying out an assessment of the mineral composition is not possible, the use of a high temperature preheat, i.e., pIRIR290, is suggested since similar behavior and stability of the same signal from the different types of feldspar were observed (Tsukamoto et al., 2012). However, because of bleaching problems resulting in large residuals (either in nature or as laboratory artifacts) and additionally a poor dose recovery of the pIRIR290 signal (Tsukamoto et al., 2017), the pIRIR290 protocol has to be used cautiously.
As the agreement with quartz OSL is equally satisfactory for the younger samples, it is difficult to judge which fraction gives the most reliable ages in the higher dose region. Since the FG polymineral fraction contains different components and therefore its signal might include contributions from other minerals of which luminescence properties are poorly known (Feathers et al., 2012), preference should be given to CG K-feldspar as a dosimeter. It is acknowledged that in our study the obtained ages from different grain size fractions are in agreement and thus seem equally reliable, but to facilitate reading, we exclusively use CG K-feldspar pIRIR225 ages in the following discussion.
4.6 Relation between pedostratigraphy and luminescence chronology
Figure 12 summarizes the obtained numerical ages from the investigated loess sections with their pedostratigraphic designations used by Rösner (1990) and compares these to the German loess stratigraphic scheme, including the chronology suggested by Lehmkuhl et al. (2016) and Zens et al. (2018). It should be noted that all OSL ages from the studied profiles are in stratigraphical order, ranging from 18(±1) to 160(±17) ka for KT and 34(±2) to 144(±14) ka for HKH. This confirms the pedostratigraphic interpretation of Semmel and Stäblein (1971) and Rösner (1990) that both LPSs mainly represent the Late Pleistocene to Holocene.
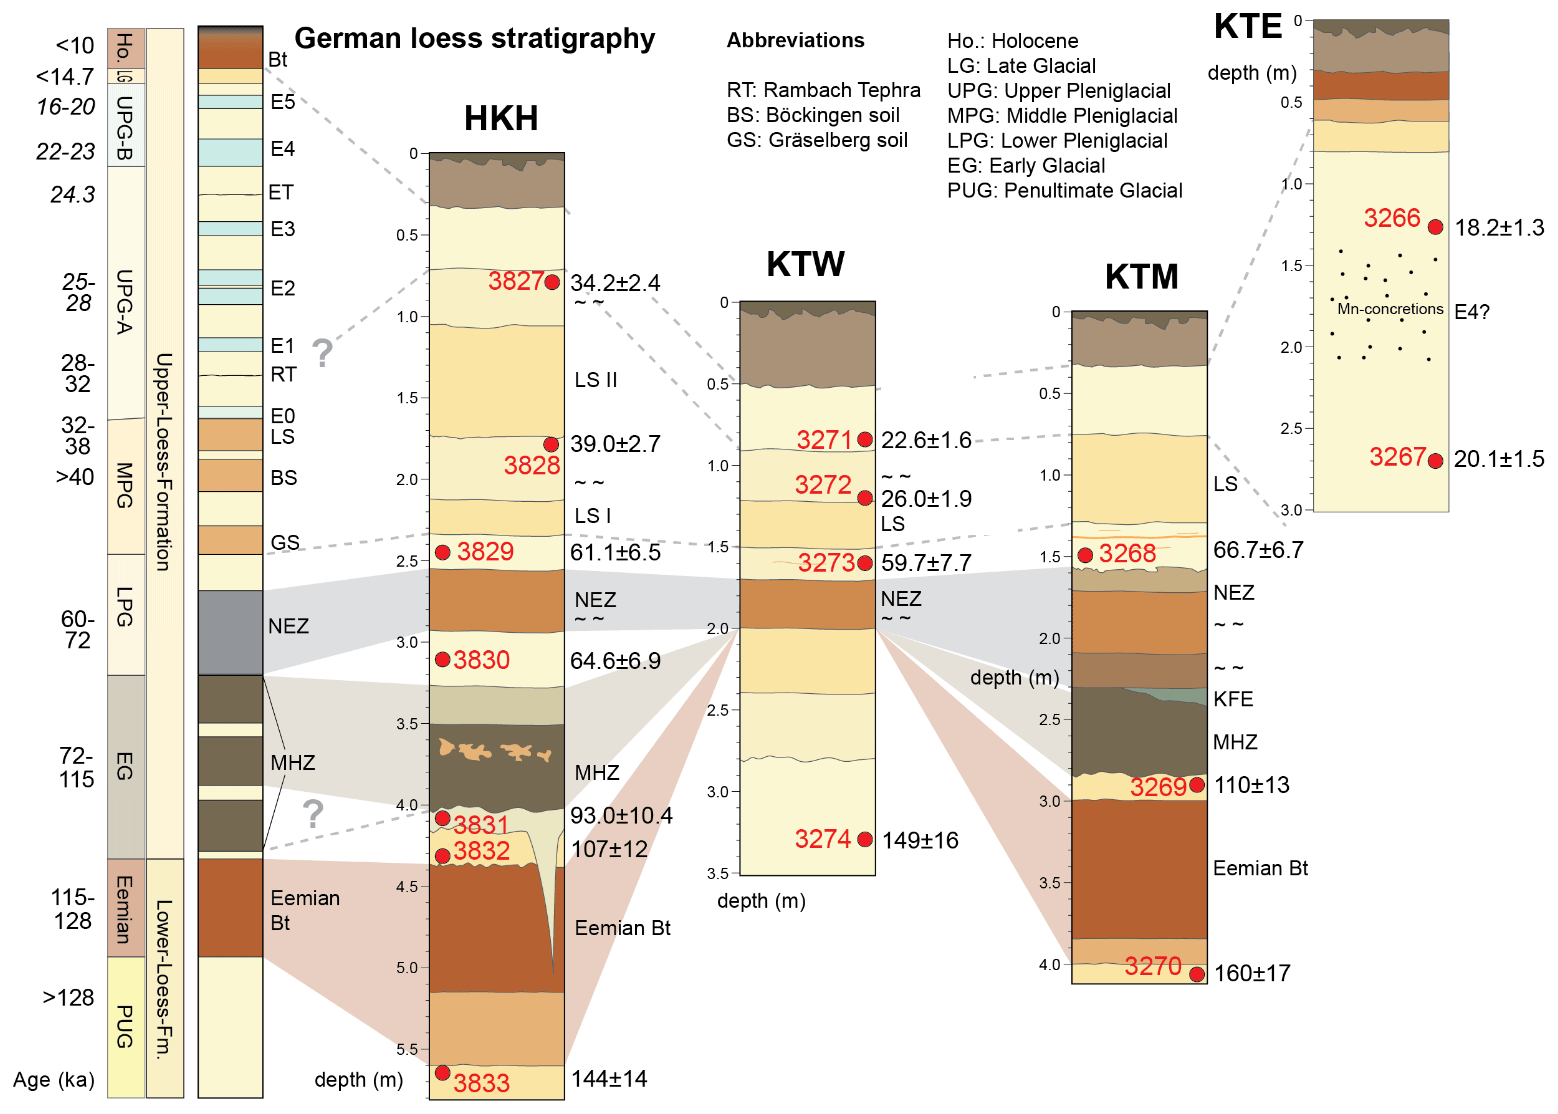
Figure 12Fading-corrected CG pIRIR225 ages and correlation of the studied profiles in comparison to German loess stratigraphy and approximate ages (Lehmkuhl et al., 2016) with partly updated ages by Zens et al. (2018) in italics. For a legend and further abbreviations, the reader is referred to Fig. 2.
The three profiles in Kitzingen capture distinct parts of the laterally variable outcrop. The youngest OSL samples were obtained from KTE, exposing loess sediments deposited in a paleo-depression younger than the LS (Semmel and Stäblein, 1971). The samples (LUM 3266 and 3267) gave an age of 18.2±1.3 and 20.1±1.5 ka, respectively, suggesting loess accumulation during the UPG, specifically during and after the last glacial maximum (LGM). The UPG is known as the period with the highest accumulation rate of dust in Europe during the last glacial (Frechen et al., 2003). Tundra gleys or the Eltville Tephra (ET) reported from a profile wall 20–30 m further south (Semmel and Stäblein, 1971; cf. Fig. 2a) were not clearly visible in the studied profile. Due to the absence of clear stratigraphic markers, we are unable to evaluate the reliability of the luminescence ages in more detail.
According to Semmel and Stäblein (1971), KTM contains the main elements of the Late Pleistocene pedostratigraphy between PUG loess at the bottom and a thin package of UPG loess with remnants of the surface soil at the top. The uppermost sample (LUM 3268) is taken from a ca. 30 cm thick loess package between the LS and NEZ. The location is below a ca. 1 cm thick brown clayey band of unclear origin in the middle of this loess layer. The age of 66.7±6.7 ka agrees with pedostratigraphic reasoning that this unit represents LPG (60–72 ka) loess that formed directly after the NEZ (Lehmkuhl et al., 2016; Zens et al., 2018). Sample LUM 3269 between the MHZs of the EG period and a well-developed Bt horizon attributed to the Eemian was dated to 110±13 ka. This agrees with the stratigraphic assumption that this horizon represents post-Eemian colluvial deposits (Semmel and Stäblein, 1971). The loess deposits from the bottom of KTM, just below the thick Bt horizon assigned to the Eemian in previous works, yielded an age of 160±17 ka (sample LUM 3270) corresponding to the PUG.
According to Rösner (1990), the KTW section is comparable to parts of KTM with a large erosional gap between the NEZ and the PUG loess. The uppermost sample (LUM 3271) dates to 22.6±1.6 ka, which is in accordance with dating results from UPG loess just below the recent soil in profile KTE. Sample LUM 3272 from reworked deposits just above the LS dates to 26.0±1.9 ka, whereas LUM 3273 below the LS has an age of 59.7±7.7 ka. It is unlikely that the weakly developed LS at Kitzingen represents over 30 kyr of landscape stability. More likely it is the result of polygenesis including phases of erosion. The end of LS formation has been discussed controversially (Terhorst et al., 2015; Sauer et al., 2016), which is due to chronological insecurities and geographic differences (e.g., paleoclimate, sedimentation rates, paleotopographic position) in landscape response to climatic deterioration at the MPG–UPG boundary. At the Central European high-resolution reference LPS Nussloch, this transition dates to ca. 34 ka (Moine et al., 2017), which is older than our age. In this context, the resolution and available data from Kitzingen are insufficient to reconstruct the local response to suborbital paleoclimatic oscillations that occurred during the MPG and early UPG (Frechen and Schirmer, 2011; Lehmkuhl et al., 2016). The loess deposits at the bottom of KTW (LUM 3274) date to 149±16 ka, corresponding to the PUG. This confirms the absence of the nearby exposed (KTM) Eemian and EG pedocomplexes most likely due to extensive erosion in the LPG, as stated by Rösner (1990).
At HKH, there is no indication of considerable UPG loess. The uppermost OSL sample (LUM 3827) yields an age of 34.2±2.4 ka above pale brown horizons interpreted as LS II by Rösner (1990). Sample LUM 3828 between LS II and LS I is only slightly older (39.0±2.7 ka) but agrees within error. The age of LS II at HKH agrees well with the LS at the LPS Nussloch (Moine et al., 2017), an assignment that was not possible at Kitzingen. The loess below LS (LUM 3829) is dated to 61.1±6.5 ka, which is the LPG–MPG transition. It is unlikely that LS I represents 20 kyr of stable environments as other Central European LPSs record more intensively developed soils and/or soils higher in number (Lehmkuhl et al., 2016). Erosion apparently reduced the early to middle MPG record of HKH.
LUM 3829 and LUM 3830 (64.6±6.9 ka) enclose the NEZ layer, which agrees with the pedostratigraphic assignment of this colluvial horizon to the LPG (Lehmkuhl et al., 2016). Similar to the obtained age of early glacial deposits from the KTM profile, which is enclosed by MHZs and the Eemian Bt horizon, the samples LUM 3831 and 3832 yield ages of 93.0±10.4 and 107±12 ka, respectively, and thus can be assigned to the EG period. The upper of these two ages is outside the range of the post-Eemian colluvial layer; therefore, we tentatively correlate the MHZ at HKH to the middle MHZ of the German pedostratigraphy. The lowermost sample of HKH (LUM 3833) from loess sediments below the well-developed Eemian Bt horizon dates the PUG period and therefore confirms the chronostratigraphic assumptions based on German loess stratigraphy (Rösner, 1990). Nevertheless, numerical age determinations are of uppermost importance in LPS studies as there may be significant differences between pedostratigraphic assumptions and ages obtained (e.g., Steup and Fuchs, 2017; Stevens et al., 2018).
The main aim of this study was to test the application of both FG polymineral and CG K-feldspar pIRIR225 dating to LPSs in Lower Franconia, southern Germany. Chronostratigraphic schemes from these sites relied entirely on pedostratigraphic assumptions based on the German loess stratigraphic scheme. This study provides the first OSL ages from LPS in Lower Franconia, which are in stratigraphic order and agree well with previous chronostratigraphic designations. The good agreement of the obtained ages from two different grain size fractions increases our confidence in the reliability of the derived ages, as further confirmed by comparison with some quartz blue OSL ages. Although the obtained ages from both grain size fractions are consistent, the different growth pattern of DRCs and correspondingly different saturation characteristics of fine and coarse grains are observed. Based on these results, we suggest caution in dating samples with equivalent doses in the nonlinear part of the DRC.
On the basis of the results obtained from TL experiments, the IRSL in FG polymineral and CG K-feldspar behaves similarly and hence likely shares most of their luminescence characteristics. However, the different luminescence behavior among FG and CG samples due to the different mineral composition is possible. We therefore give preference to using CG K-feldspar extracts, which mostly have particular minerals with well-known luminescence properties. In the absence of coarse fractions, the mineralogical composition of polymineral fine fractions would need to be investigated in order to identify different components and subsequently select the most appropriate protocol, e.g., high temperature preheat for an FG sample which is dominated by Na-feldspar grains.
Most of the OSL data underlying this study are presented in the article, and OSL raw data can be obtained on request.
The supplement related to this article is available online at: https://doi.org/10.5194/egqsj-70-53-2021-supplement.
TS, BT and CT designed the study. NR, TS and CT drafted the paper with final contributions from BT and MF.
The authors declare that they have no conflict of interest.
We thank Michael Menke, Simon Meyer-Heintze, Jan Grunau, Alexander Bauer, Peter Zwosta, Johannes Väth and the University of Würzburg and University of Bern field course students for help during fieldwork and critical discussions. We are grateful to the technicians from the LIAG for the laboratory responsibilities, Sonja Riemenschneider and Sabine Mogwitz for preparation of the luminescence samples, and Petra Posimowski for gamma spectrometry measurements. We are also thankful to Sumiko Tsukamoto for scientific discussions. We are indebted to Hofmann Transporte GmbH Kitzingen and to the Verwaltungsgemeinschaft Helmstadt for permission to repeatedly access the outcrops KT and HKH, respectively. We are especially grateful to Ludwig Zöller and Tony Reimann for their constructive reviews and comments.
This paper was edited by Markus Fuchs and reviewed by Tony Reimann and Ludwig Zöller.
Aitken, M. J.: Thermoluminescence Dating, Academic Press, London, 1985.
Aitken, M. J.: An introduction to optical dating, Oxford University Press, Oxford, 1998.
Auclair, M., Lamothe, M., and Huot, S.: Measurement of anomalous fading for feldspar IRSL using SAR, Radiat. Meas., 37, 487–492, https://doi.org/10.1016/S1350-4487(03)00018-0, 2003.
Brunnacker, K.: Regionale Bodendifferenzierungen während der Würmeiszeit, Eiszeitalter and Gegenwart, 7, 43–48, 1965.
Buylaert, J. P., Vandenberghe, D., Murray, A. S., Huot, S., De Corte, F., and Van den haute, P.: Luminescence dating of old (>70 ka) Chinese loess: a comparison of single-aliquot OSL and IRSL techniques, Quat. Geochronol., 5, 9–14, https://doi.org/10.1016/j.quageo.2006.05.028, 2007.
Buylaert, J. P., Murray, A. S., Thomsen, K. J., and Jain, M.: Testing the potential of an elevated temperature IRSL signal from K-feldspar, Radiat. Meas., 44, 560–565, https://doi.org/10.1016/j.radmeas.2009.02.007, 2009.
Buylaert, J. P., Jain, M., Murray, A. S., Thomsen, K. J., Thiel, C., and Sohbati, R.: A robust feldspar luminescence dating method for Middle and Late Pleistocene sediments, Boreas, 41, 435–451, https://doi.org/10.1111/j.1502-3885.2012.00248.x, 2012.
Buylaert, J. P., Yeo, E. Y., Thiel, C., Yi, S., Stevens, T., Thompson, W., Frechen, M., Murray, A. S., and Lu, H.: A detailed post-IR IRSL chronology for the last interglacial soil at the Jinbian loess site (northern China), Quat. Geochronol., 30, 194–199, https://doi.org/10.1016/j.quageo.2015.02.022, 2015.
Colarossi, D., Duller, G. A. T., Roberts, H. M., Tooth, S., and Lyons, R.: Comparison of paired quartz and feldspar post-IR IRSL dose distributions in poorly bleached fluvial sediments from South Africa, Quat. Geochronol., 30, 233–238, https://doi.org/10.1016/j.quageo.2015.02.015, 2015.
Constantin, D., Jain, M., Murray, A. S., Buylaert, J. P., and Timar-Gabor, A.: Quartz luminescence response to a mixed alpha-beta field: investigations on Romanian loess, Radiat. Meas., 81, 110–115, https://doi.org/10.1016/j.radmeas.2015.01.001, 2015.
Cunningham, A. S. and Wallinga, J.: Selection of integration time intervals for quartz OSL decay curves, Quat. Geochronol., 5, 657–666, https://doi.org/10.1016/j.quageo.2010.08.004, 2010.
Duller, G. A. T.: Infrared bleaching of the thermoluminescence of four feldspars, J. Phys. D Appl. Phys., 28, 1244–1258, https://doi.org/10.1088/0022-3727/28/6/030, 1995.
Duller, G. A. T.: Behavioral studies of stimulated luminescence from feldspars, Radiat. Meas., 27, 663–694, https://doi.org/10.1016/S1350-4487(97)00216-3, 1997.
Duller, G. A. T.: Distinguishing quartz and feldspar in single grain luminescence measurements, Radiat. Meas., 37, 161–165, https://doi.org/10.1016/S1350-4487(02)00170-1, 2003.
FAO: Guidelines for soil description. Food and Agriculture Organization of the United Nations, 4th edn., Roma, Italy, 2006.
Feathers, J. K., Casson, M. A., Schmidt, A. H., and Chithambo, M. L.: Application of pulsed OSL to polymineral fine-grained samples, Radiat. Meas., 47, 201–209, https://doi.org/10.1016/j.radmeas.2012.01.003, 2012.
Frechen M. and Schirmer, W.: Luminescence chronology of the Schwalbenberg ll loess in the middle Rhine valley, E&G – Quaternary Science Journal, 60, 78–89, https://doi.org/10.23689/fidgeo-965, 2011.
Frechen, M., Schweitzer, U., and Zander, A.: Improvements in sample preparation for the fine grain technique, Ancient TL, 14, 15–17, 1996.
Frechen, M., van Vliet-Lanoë, B., and Van Den Haute, P.: The Upper Pleistocene loess record at Harmignies/Belgium – high resolution terrestrial archive of climate forcing, Palaeogeogr. Palaeocl., 173, 175–195, https://doi.org/10.1016/S0031-0182(01)00319-4, 2001.
Frechen, M., Oches, E. A., and Kohfeld, K. E.: Loess in Europe–mass accumulation rates during the Last Glacial Period, Loess and the Dust Indicators and Records of Terrestrial and Marine Palaeoenvironments (DIRTMAP) database, Quaternary Sci. Rev., 22, 1835–1857, https://doi.org/10.1016/S0277-3791(03)00183-5, 2003.
Frouin, M., Guérin, G., Lahaye, C., Mercier, N., Huot, S., Aldeias, V., Bruxelles, L., Chiotti, L., Dibble, H. L., Goldberg, P., Madelaine, S., McPherron, S. J. P., Sandgathe, D., Steele, T. E., and Turq, A.: New luminescence dating results based on polymineral fine grains from the Middle and Upper Palaeolithic site of La Ferrassie (Dordogne, SW France), Quat. Geochronol., 39, 131–141, https://doi.org/10.1016/j.quageo.2017.02.009, 2017.
Fu, X., Li, B., and Li, S. H.: Testing a multi-step post-IR IRSL dating method using polymineral fine grains from Chinese loess, Quat. Geochronol., 10, 8–15, https://doi.org/10.1016/j.quageo.2011.12.004, 2012.
Fuchs, M., Rousseau, D.-D., Antoine, P., Hatté, C., Gauthier, C., Marković, S., and Zoeller, L.: Chronology of the last climatic cycle (upper Pleistocene) of the Surduk loess sequence, Vojvodina, Serbia, Boreas, 37, 66–73, https://doi.org/10.1111/j.1502-3885.2007.00012.x, 2008.
Guérin, G., Mercier, N., and Adamiec, G.: Dose-rate conversion factors: update, Ancient TL, 29, 5–8, 2011.
Guérin, G., Frouin, M., Talamo, S., Aldeias, V., Chiotti, L., Dibble, H., Goldberg, P., Hublin, J. J., Jain, M., Lahaye, C., Madelaine, S., Maureille, B., McPherron, S., Mercier, N., Murray, A. S., Sandgathe, D., Steele, T. E., Thomsen, K., and Turq, A.: A multi-method luminescence dating of the paleolithic sequence of La Ferrassie based on new excavations adjacent to the La Ferrassie 1 and 2 skeletons, J. Archaeol. Sci., 58, 147–166, https://doi.org/10.1016/j.jas.2015.01.019, 2015.
Haase, D., Fink, J., Haase, G., Ruske, R., Pécsi, M., Richter, H., Altermann, M., and Jäger, K. D.: Loess in Europe-its spatial distribution based on a European loess map, scale , Quaternary Sci. Rev., 26, 1301–1312, https://doi.org/10.1016/j.quascirev.2007.02.003, 2007.
Huntley, D. J. and Baril, M. R.: The K content of the K-feldspar being measured in optical dating or in thermoluminescence dating, Ancient TL, 15, 11–13, 1997.
Huntley, D. J. and Hancock, R. G. V.: The Rb contents of K-feldspar grains being measured in optical dating, Ancient TL, 19, 43–46, 2001.
Huntley, D. J. and Lamothe, M.: Ubiquity of anomalous fading in K-feldspars and the measurement and correction for it in optical dating, Can. J. Earth Sci., 38, 1093–1106, https://doi.org/10.1139/e01-013, 2001.
Huntley, D. J., Baril, M. R., and Haidar, S.: Tunnelling in plagioclase feldspars, J. Phys. D Appl. Phys., 40, 900–906, https://doi.org/10.1088/0022-3727/40/3/031, 2007.
Huot, S. and Lamothe, M.: The implication of sodium-rich plagioclase minerals contaminating K-rich feldspars aliquots in luminescence dating, Quat. Geochronol., 10, 334–339, https://doi.org/10.1016/j.quageo.2012.03.003, 2012.
Kars, R. H., Wallinga, J., and Cohen, K. M.: A new approach towards anomalous fading correction for feldspar IRSL dating – tests on samples in field saturation, Radiat. Meas., 43, 786–790, https://doi.org/10.1016/j.radmeas.2008.01.021, 2008.
Kreutzer, S., Schmidt, C., DeWitt, R., and Fuchs, M.: The a-value of polymineral fine grain samples measured with the post-IR IRSL protocol, Radiat. Meas., 69, 18–29, https://doi.org/10.1016/j.radmeas.2014.04.027, 2014.
Lehmkuhl, F., Zens, J., Krauß, L., Schulte, P., and Kels, H.: Loess-paleosol sequences at the northern European loess belt in Germany: distribution, geomorphology and stratigraphy, Quaternary Sci. Rev., 153, 11–30, https://doi.org/10.1016/j.quascirev.2016.10.008, 2016.
Lehmkuhl, F., Pötter, S., Pauligk, A., and Bösken, J.: Loess and other Quaternary sediments in Germany, J. Maps, 14, 330–340, https://doi.org/10.1080/17445647.2018.1473817, 2018.
Li, B. and Li, S. H.: Thermal stability of infrared stimulated luminescence of sedimentary K-feldspar, Radiat. Meas., 46, 29–36, https://doi.org/10.1016/j.radmeas.2010.10.002, 2011.
Li, B. and Li, S. H.: Luminescence dating of Chinese loess beyond 130 ka using the non-fading signal from K-feldspar, Quat. Geochronol., 10, 24–31, https://doi.org/10.1016/j.quageo.2011.12.005, 2012.
Li, Y., Tsukamoto, S., Shang, Z., Tamura, T., Wang, H., and Frechen, M.: Constraining the transgression history in the Bohai Coast China since the Middle Pleistocene by luminescence dating, Mar. Geol., 416, 105980, https://doi.org/10.1016/j.margeo.2019.105980, 2019.
Mejdahl, V.: Thermoluminescence dating: beta-dose attenuation in quartz grains, Archaeometry, 21, 61–72, https://doi.org/10.1111/j.1475-4754.1979.tb00241.x, 1979.
Moine, O., Antonie, P., Hatté, C., Landais, A., Mathieu, J., Prud'homme, C., and Rousseau, D.-D.: The impact of Last Glacial climate variability in west-European loess revealed by radiocarbon dating of fossil earthworm granules, P. Natl. Acad. Sci. USA, 114, 6209–6214, https://doi.org/10.1073/pnas.1614751114, 2017.
Möller, P. and Murray, A. S.: Drumlinised glaciofluvial and glaciolacustrine sediments on the Småland peneplain, South Sweden- new information on the growth and decay history of the Fennoscandian Ice Sheets during MIS 3, Quaternary Sci. Rev., 122, 1–29, https://doi.org/10.1016/j.quascirev.2015.04.025, 2015.
Moska, P., Adamiec, G., Jary, Z., Bluszcz, A., Poręba, G., Piotrowska, N., Krawczyk, M., and Skurzyński, J.: Luminescence chronostratigraphy for the loess deposits in Złota, Poland, Geochronometria, 45, 44–55, https://doi.org/10.1515/geochr-2015-0073, 2018.
Murray, A. S. and Olley, J. M.: Precision and accuracy in the optically stimulated luminescence dating of sedimentary quartz: a status review, Geochronometria, 21, 1–16, 2002.
Murray, A. S. and Wintle, A. G.: Luminescence dating of quartz using an improved single-aliquot regenerative-dose protocol, Radiat. Meas., 32, 57–73, https://doi.org/10.1016/S1350-4487(99)00253-X, 2000.
Murray, A. S. and Wintle, A. G.: The single aliquot regenerative dose protocol: potential for improvements in reliability, Radiat. Meas., 37, 377–381, https://doi.org/10.1016/S1350-4487(03)00053-2, 2003.
Murray, A. S., Buylaert, J. P., Thomsen, K. J., and Jain, M.: The effect of preheating on the IRSL signal from feldspar, Radiat. Meas., 44, 554–559, https://doi.org/10.1016/j.radmeas.2009.02.004, 2009.
Murray, A. S., Thomsen, K. J., Masuda, N., Buylaert, J. P., and Jain, M.: Identifying well-bleached quartz using the different bleaching rates of quartz and feldspar luminescence signals, Radiat. Meas., 47, 688–695, https://doi.org/10.1016/j.radmeas.2012.05.006, 2012.
Novothny, A., Frechen, M., Horváth, E., Wacha, L., and Rolf, C.: Investigating the penultimate and last glacial cycles of the Süttö loess section (Hungary) using luminescence dating, high-resolution grain size, and magnetic susceptibility data, Quatern. Int., 234, 75–85, https://doi.org/10.1016/j.quaint.2010.08.002, 2011.
Poolton, N. R. J., Ozanyan, K. B., Wallinga, J., Murray, A. S., and Bøtter-Jensen, L.: Electrons in feldspar II: a consideration of the influence of conduction band-tail states on luminescence processes, Phys. Chem. Miner., 29, 217–225, https://doi.org/10.1007/s00269-001-0218-2, 2002.
Prescott, J. R. and Hutton, J. T.: Cosmic ray contributions to dose rates for luminescence and ESR dating: large depths and long term variations, Radiat. Meas., 23, 497–500, https://doi.org/10.1016/1350-4487(94)90086-8, 1994.
Prescott, J. R. and Stephan, L. G.: The contribution of cosmic radiation to the environmental dose for thermoluminescent dating – latitude, altitude and depth dependences, PACT, 6, 17–25, 1982.
Rees-Jones, J.: Optical dating of young sediments using fine-grain quartz, Ancient TL, 13, 9–14, 1995.
Roberts, H. M.: The development and application of luminescence dating to loess deposits: a perspective on the past, present and future, Boreas, 37, 483–507, https://doi.org/10.1111/j.1502-3885.2008.00057.x, 2008.
Rösner, U.: Die Mainfränkische Lößprovinz, Mitteilungen der Fränkischen Geographischen Gesellschaft Erlangen, Bd. 37, 290 pp., 1990.
Sauer, D., Kadereit, A., Kühn, P., Kösel, M., Miller, C. E., Shinonaga, T., Kreutzer, S., Herrmann, L., Fleck, W., Starkovich, B. M., and Stahr, K.: The loess-palaeosol sequence of Datthausen, SW Germany: characteristics, chronology, and implications for the use of the Lohne Soil as a marker soil, Catena, 146, 10–29, https://doi.org/10.1016/j.catena.2016.06.024, 2016.
Schmidt, E. D., Machalett, B., Marković, S. B., Tsukamoto, S., and Frechen, M.: Luminescence chronolgy of the upper part of the Stari Slankamen loess sequence (Vojvodina, Serbia), Quat. Geochronol., 5, 137–142, https://doi.org/10.1016/j.quageo.2009.09.006, 2010.
Schmidt, E. D., Frechen, M., Murray, A. S., Tsukamoto, S., and Bittmann, F.: Luminescence chronology of the loess record from the Tönchesberg section: A comparison of using quartz and feldspar as dosimeter to extend the age range beyond the Eemian, Quatern. Int., 234, 10–22, https://doi.org/10.1016/j.quaint.2010.07.012, 2011.
Schönhals, E., Rohdenburg, H., and Semmel, A.: Ergebnisse neuerer Untersuchungen zur Würmlöß-Gliederung in Hessen, E&G – Quaternary Science Journal, 15, 199–206, https://doi.org/10.23689/fidgeo-1507, 1964.
Semmel, A.: Studien über den Verlauf jungpleistozäner Formung in Hessen, Frankfurter Geographische Hefte, Hefte 45, 133 pp., 1968.
Semmel, A. and Stäblein, G.: Zur Entwicklung quartärer Hohlformen in Franken, Eiszeitalter u. Gegenwart, 22, 23–34, https://doi.org/10.23689/fidgeo-1443, 1971.
Skowronek, A.: Paläoböden und Lösse in Mainfranken vor ihrem landschaftsgeschichtlichen Hintergrund, Würzburger Geographische Arbeiten, 57, 89–107, 1982.
Sohbati, R., Murray, A. S., Jain, M., Thomsen, K., Hong, S., Yi, K., and Choi, J.: Na-rich feldspar as a luminescence dosimeter in infrared stimulated luminescence (IRSL) dating, Radiat. Meas., 51–52, 67–82, https://doi.org/10.1016/j.radmeas.2012.12.011, 2013.
Spooner, N. A.: The anomalous fading of infrared-stimulated luminescence from feldspars, Radiat. Meas., 23, 625–632, https://doi.org/10.1016/1350-4487(94)90111-2, 1994.
Sprafke, T.: Löss in Niederösterreich – Archiv quartärer Klima- und Landschaftsveränderungen, Würzburg University Press, Würzburg, E-book version, 272 pp., available at: https://opus.bibliothek.uni-wuerzburg.de/files/12778/978-3-95826-039-9_Sprafke_Tobias_OPUS_12778.pdf (last access: 29 January 2021), 2016.
Steup, R. and Fuchs, M.: The loess sequence at Münzenberg (Wetterau/Germany): A reinterpretation based on new luminescence dating results, Z. Geomorphol., 61, 101–120, https://doi.org/10.1127/zfg_suppl/2016/0408, 2017.
Stevens, T., Buylaert, J. P., Thiel, C., Újvári, G., Yi, S., Murray, A. S., Frechen, M., and Lu, H.: Ice-volume-forced erosion of the Chinese Loess Plateau global Quaternary stratotype site, Nat. Commun., 9, 983, https://doi.org/10.1038/s41467-018-03329-2, 2018.
Terhorst, B., Sedov, S., Sprafke, T., Peticzka, R., Meyer-Heintze, S., Kühn, P., and Solleiro Rebolledo, E.: Austrian MIS 3/2 loess-palaeosol records – key sites along a west-east transect, Palaeogeogr. Palaeocl., 418, 43–56, https://doi.org/10.1016/j.palaeo.2014.10.020, 2015.
Thiel, C., Buylaert, J. P., Murray, A. S., Terhorst, B., Hofer, I., Tsukamoto, S., and Frechen, M.: Luminescence dating of the Stratzing loess profile (Austria) – testing the potential of an elevated temperature post-IR IRSL protocol, Quatern. Int., 234, 23–31, https://doi.org/10.1016/j.quaint.2010.05.018, 2011a.
Thiel, C., Buylaert, J.-P., Murray, A. S., Terhorst, B., Tsukamoto, S., Frechen, M., and Sprafke, T.: Investigating the chronostratigraphy of prominent palaeosols in Lower Austria using post-IR IRSL dating, E&G Quaternary Sci. J., 60, 11, https://doi.org/10.3285/eg.60.1.10, 2011b.
Thiel, C., Tsukamoto, S., Kayoko, T., Buylaert, J. P., Murray, A. S., Tanaka, K., and Shirai, M.: Testing the application of quartz and feldspar luminescence dating to MIS 5 Japanese marine deposits, Quat. Geochronol., 29, 16–29, https://doi.org/10.1016/j.quageo.2015.05.008, 2015.
Thomsen, K. J., Bøtter-Jensen, L., Denby, P. M., Moska, P., and Murray, A. S.: Developments in luminescence measurement techniques, Radiat. Meas., 41, 768–773, https://doi.org/10.1016/j.radmeas.2006.06.010, 2006.
Thomsen, K. J., Murray, A. S., Jain, M., and Bøtter-Jensen, L.: Laboratory fading rates of various luminescence signals from feldspar-rich sediment extracts, Radiat. Meas., 43, 1474–1486, https://doi.org/10.1016/j.radmeas.2008.06.002, 2008.
Timar-Gabor, A. and Wintle, A. G.: On natural and laboratory generated dose response curves for quartz of different grain sizes from Romanian loess, Quat. Geochronol., 18, 34–40, https://doi.org/10.1016/j.quageo.2013.08.001, 2013.
Timar-Gabor, A., Vandenberghe, D. A. G., Vasiliniuc, S., Panaiotu, C. E., Panaiotu, C. G., Dimofte, D., and Cosma, C.: Optical dating of Romania loess: a comparison between sand-sized and silt-sized quartz, Quatern. Int., 240, 62–70, https://doi.org/10.1016/j.quaint.2010.10.007, 2011.
Timar-Gabor, A., Constantin, D., Marković, S. B., and Jain, M.: Extending the area of investigation of fine versus coarse quartz optical ages from the Lower Danube to the Carpathian Basin, Quatern. Int., 388, 168–176, https://doi.org/10.1016/j.quaint.2014.09.065, 2015.
Timar-Gabor, A., Buylaert, J.-P., Guralnik, B., Trandafir-Antohi, O., Constantin, D., Anechitei-Deacu, V., Jain, M., Murray, A. S., Porat, N., Hao, Q., and Wintle, A. G.: On the importance of grain size in luminescence dating using quartz, Radiat. Meas., 106, 464–471, https://doi.org/10.1016/j.radmeas.2017.01.009, 2017.
Tsukamoto, S., Jain, M., Murray, A. S., Thiel, C., Schmidt, E., Wacha, L., Dohrmann, R., and Frechen, M.: A comparative study of the luminescence characteristics of polymineral fine grains and coarse-grained K- and Na-rich feldspars, Radiat. Meas., 47, 903–908, https://doi.org/10.1016/j.radmeas.2012.02.017, 2012.
Tsukamoto, S., Kondo, R., Lauer, T., and Jain, M.: Pulsed IRSL: A stable and fast bleaching luminescence signal from feldspar for dating Quaternary sediments, Quat. Geochronol., 41, 26–36, https://doi.org/10.1016/j.quageo.2017.05.004, 2017.
Vasiliniuc, Ş., Vandenberghe, D. A. G., Timar-Gabor, A., Panaiotu, C., Cosma, C., and Van Den haute, P.: Testing the potential of elevated temperature post-IR-IRSL signals for dating Romanian loess, Quat. Geochronol., 10, 75–80, https://doi.org/10.1016/j.quageo.2012.02.014, 2012.
Vasiliniuc, Ş., Vandenberghe, D. A. G., Timar-Gabor, A., Cosma, C., and Van Den haute, P.: Combined IRSL and POST-IR OSL dating of Romanian loess using single aliquots of polymineral fine grains, Quatern. Int., 293, 15–22, https://doi.org/10.1016/j.quaint.2012.01.002, 2013.
Wacha, L. and Frechen, M.: The geochronology of the “Gorjanović loess section” in Vukovar, Croatia, Quatern. Int., 240, 87–99, https://doi.org/10.1016/j.quaint.2011.04.010, 2011.
Wacha, L., Mikulčić Pavlaković, S., Novothny, Á., Crnjaković, M., and Frechen, M.: Luminescence dating of upper Pleistocene loess from the island of Susak in Croatia, Quatern. Int., 34, 50–61, https://doi.org/10.1016/j.quaint.2009.12.017, 2011.
Wang, X. L., Wintle, A. G., and Adamiec, G.: Post-IR IRSL production in perthitic feldspar, Radiat. Meas., 64, 1–8, https://doi.org/10.1016/j.radmeas.2014.03.006, 2014.
Wintle, A. G.: Luminescence dating: laboratory procedures and protocols, Radiat. Meas., 27, 769–817, https://doi.org/10.1016/S1350-4487(97)00220-5, 1997.
Wintle, A. G. and Murray, A. S.: A review of quartz optically stimulated luminescence characteristics and their relevance in single-aliquot regeneration dating protocols, Radiat. Meas., 41, 369–391, https://doi.org/10.1016/j.radmeas.2005.11.001, 2006.
Yi, S., Buylaert, J. P., Murray, A. S., Thiel, C., Zeng, L., and Lu, H.: High resolution OSL and post-IR IRSL dating of the last interglacial-glacial cycle at the Sanbahuo loess site (northeastern China), Quat. Geochronol., 30, 200–206, https://doi.org/10.1016/j.quageo.2015.02.013, 2015.
Yi, S., Buylaert, J. P., Murray, A. S., Lu, H., Thiel, C., and Zeng, L.: A detailed post-IR IRSL dating study of the Niuyangzigou loess site in northeastern China, Boreas, 45, 644–657, https://doi.org/10.1111/bor.12185, 2016.
Zens, J., Schulte, P., Klasen, N., Krauß, L., Pirson, S., Burow, C., Brill, D., Eckmeier, E., Kels, H., Zeeden, C., Spagna, P., and Lehmkuhl, F.: OSL chronologies of paleoenvironmental dynamics recorded by loess-paleosol sequences from Europe: case studies from the Rhine-Meuse area and the Neckar Basin, Palaeogeogr. Palaeocl., 509, 105–125, https://doi.org/10.1016/j.palaeo.2017.07.019, 2018.
Zhang, J. and Li, S. H.: Constructions of standarised growth curves (SGCs) for IRSL signals from K-feldspar, plagioclase and polymineral fractions, Quat. Geochronol., 49, 8–15, https://doi.org/10.1016/j.quageo.2018.05.015, 2019.