the Creative Commons Attribution 4.0 License.
the Creative Commons Attribution 4.0 License.
 | 23 Aug 2022
Investigating the loess–palaeosol sequence of Bahlingen-Schönenberg (Kaiserstuhl), southwestern Germany, using a multi-methodological approach
Tabea Schulze
Lea Schwahn
Alexander Fülling
Christian Zeeden
Frank Preusser
Tobias Sprafke
Schulze, T., Schwahn, L., Fülling, A., Zeeden, C., Preusser, F., and Sprafke, T.: Investigating the loess–palaeosol sequence of Bahlingen-Schönenberg (Kaiserstuhl), southwestern Germany, using a multi-methodological approach, E&G Quaternary Sci. J., 71, 145–162, https://doi.org/10.5194/egqsj-71-145-2022, 2022.
Loess–palaeosol sequences (LPSs) are key archives for the reconstruction of Quaternary environmental conditions, but there is a lack of investigated records from the southern Upper Rhine Graben (southwestern Germany). To close this gap, a LPS at Bahlingen-Schönenberg was investigated at high resolution using a multi-method approach. Infrared stimulated luminescence screening reveals a major hiatus in the lower part of the LPS that according to luminescence dating is older than marine isotope stage (MIS) 4. The section above the hiatus formed by quasi-continuous loess sedimentation between ca. 34 and 27 ka, interrupted by phases of weak reductive pedogenesis. The fact that this pedogenesis is much weaker compared to corresponding horizons in the more northerly part of the Upper Rhine Graben could be due to regionally drier conditions caused by a different atmospheric circulation pattern at the time of deposition. Our results reinforce earlier notions that the major environmental shifts leading into the Last Glacial Maximum (LGM) of southern Central Europe significantly predate the transition of MIS 3 to 2 (ca. 29 ka). In particular, the last massive phase of loess accumulation started several thousand years prior to the arrival of glaciers in the foreland of the Alps, which raises questions regarding the source and transport paths of the dust. It is also noted that no loess dating to the LGM or the time thereafter was observed due to either a lack of deposition or later erosion.
Löss-Paläoboden Sequenzen (LPS) sind Schlüsselarchive für die Rekonstruktion von quartären Umweltbedingungen, aber es mangelt an der Untersuchung solcher Abfolgen aus dem südlichen Oberrheingraben. Um diese Lücke zu schließen, wurde eine LPS bei Bahlingen-Schönenberg mit einem multimethodischen Ansatz hochauflösend untersucht. Die Untersuchung mit Infrarot Stimulierter Lumineszenz Screening zeigt einen Hiatus im unteren Teil der LPS, der laut Lumineszenzdatierungen älter ist als das Marine Isotopenstadium (MIS) 4. Der Abschnitt oberhalb des Hiatus bildete sich durch quasi-kontinuierliche Lössablagerung zwischen ca. 34 und 27 ka, unterbrochen von Phasen schwacher reduktiver Pedogenese. Da die Pedogenese im Vergleich zu entsprechenden Horizonten im nördlicheren Teil des Oberrheingrabens viel schwächer ausgeprägt ist, könnte dies auf regional trockenere Bedingungen zurückzuführen sein, verursacht durch ein anderes atmosphärisches Zirkulationsmuster zur Zeit der Ablagerung. Unsere Ergebnisse bestätigen frühere Annahmen, dass die großen Umweltveränderungen, die zum letzten glazialen Maximum (LGM) im südlichen Mitteleuropa führten, deutlich vor dem Übergang von MIS 3 zu 2 (ca. 29 ka) lagen. Insbesondere begann die letzte massive Phase der Lössakkumulation mehrere tausend Jahre vor der Ankunft der Gletscher im Alpenvorland, was Fragen zu den Quellen und Transportwegen des Staubs aufwirft. Es ist auch festzustellen, dass kein Löss aus dem LGM oder der Zeit danach gefunden wurde, entweder aufgrund fehlender Ablagerung oder späterer Erosion.
- Article
(4910 KB) - Full-text XML
-
Supplement
(414 KB) - BibTeX
- EndNote


Loess is among the most abundant Pleistocene sediments in Central Europe, and thick loess–palaeosol sequences (LPSs) are key archives to reconstruct Quaternary palaeoenvironments (e.g. Lehmkuhl et al., 2016; Sprafke, 2016). On the one hand, a warm to moderately temperate humid climate leads to the formation of different types of soils (depending on the nature and timing of climate conditions). On the other hand, a cool to cold dry climate is often characterised by the accumulation of loess but requires at least a grassland vegetation cover (mammoth steppe) to trap the dust. Furthermore, the subaerially deposited dust undergoes quasi-pedogenic or quasi-diagenetic processes, known as loessification, that result in the typical aggregation of loess (cf. Sprafke and Obreht, 2016; Smalley and Obreht, 2018). Another relevant question regards the source of the dust and its transport paths, which appear rather complex (e.g. Pye, 1995; Smalley, 1995; Wright, 2001; Smalley et al., 2009). For loess deposits found in proximity to formerly glaciated areas, it is usually assumed that dust formation is caused by different forms of grinding related directly to ice contact and meltwater streams, producing fine-grained debris also known as glacier milk. However, fine-grained sediment production is likely also related to different types of periglacial processes including frost shattering and abrasion during slope processes.
Another feature that is common in many LPS, but that has seen very limited attention in loess research, is the presence of hiatuses in the records (e.g. Huayu et al., 2006; Steup and Fuchs, 2017). In fact, most kinds of soil formation will form a break or massive reduction in sediment accumulation. Furthermore, LPSs feature unconformities, i.e. erosional boundaries, when parts of pre-existing loess and palaeosols have been removed (Meszner et al., 2013; Sprafke, 2016; Lehmkuhl et al., 2016; Zöller et al., 2022). In theory, this can be induced by three different processes, soil creep, sheet erosion (by water), and deflation, all of which are related to different climatic conditions.
In Central Europe, the Rhine represents the main drainage of the northwestern Alps with frequent occurrences of LPSs on both sides of the river (Lehmkuhl et al., 2016, 2021). Due to its direct connection to the Alps, the onset of the last phase of loess accumulation along the river Rhine should be directly related to the advance of glaciers towards their last maximum extent (Last Glacial Maximum, LGM). For the Swiss Alps, the chronology of the last advance is rather well constrained, and glaciers did reach the foreland likely shortly after 30 ka (reviewed by Stojakowits et al., 2021). The maximum of the last glaciation was reached around 24–25 ka, followed by rapid decay of ice within a few thousand years (e.g. Gaar et al., 2019). Interestingly, it has been demonstrated that the last massive phase of loess accumulation already started soon after 35 ka, as shown at the sites of Schwalbenberg (Fischer et al., 2021), Nussloch (Antoine et al., 2001, 2009; Moine et al., 2017), and Möhlin (Gaar and Preusser, 2017). A substantial increase in sediment accumulation rate peaking around 32 ka is also observed at Bergsee, a macro-fossil radiocarbon-dated lake record that is only a few kilometres' distance from the Möhlin site in the Rhine Valley (Duprat-Oualid et al., 2017). In summary, there is a clear offset between the onset and likely even the peak in dust flux, as well as theoretical assumptions regarding dust availability in the context of the last glaciation in this part of Central Europe.
A suitable area to further investigate the above issues would be the southern part of the Upper Rhine Graben, an area located directly downstream of the formerly glaciated areas of the Swiss Alps and the Black Forest (Preusser et al., 2011; Hofmann et al., 2020). In particular the Kaiserstuhl area, an extinct volcanic complex formed during the Miocene (Rotsein and Schaming, 2011), is well-known for its wide-spread loess deposits, mainly on its northern and eastern flanks (Smalley et al., 1973; Guenther, 1961, 1987). However, the most recent studies of the loess deposits in the Kaiserstuhl area were published more than 30 years ago (Guenther, 1987; Zöller et al., 1988; Zöller and Wagner, 1990) and do not represent the present stage of methodology. In particular, there have been substantial improvements in luminescence dating since the late 1980s, which allow for robust age control as a prerequisite to investigate the regional connection between mountain glaciations, glaciofluvial response, regional dust dynamics, palaeovegetation, and soil formation.
The LPS Bahlingen-Schönenberg (coordinates: 48.124312∘ N, 7.731780∘ E) is located on a small plateau west of the village Bahlingen at the northeastern Kaiserstuhl (Fig. 1), where up to 20 m deep, largely vegetated hollow ways are present. Where the road reaches its highest point, a 7 m high loess cliff without obvious palaeosols is present. The section investigated here is a 5 m thick profile starting 1.5 m below the disturbed top of the loess cliff. In order to develop a robust stratigraphy from this weakly differentiated LPS, we analyse colour (spectrophotometer), granulometry (laser diffraction), magnetic susceptibility, and organic matter and carbonate content (loss on ignition – LOI 550 and 950 ∘C, respectively) of samples taken at 5 cm resolution. Infrared stimulated luminescence (IRSL) screening at 10 cm resolution is applied to evaluate the chronostratigraphic continuity of the LPS, whereas numerical ages are derived from quartz optically stimulated luminescence (OSL) and feldspar multi-elevated-temperature (MET) post-IR IRSL (pIR). Besides establishing the chronology of the site investigated, this is also a test to check the performance of the applied proxy data and dating approaches and estimate their potential for future studies in the region.
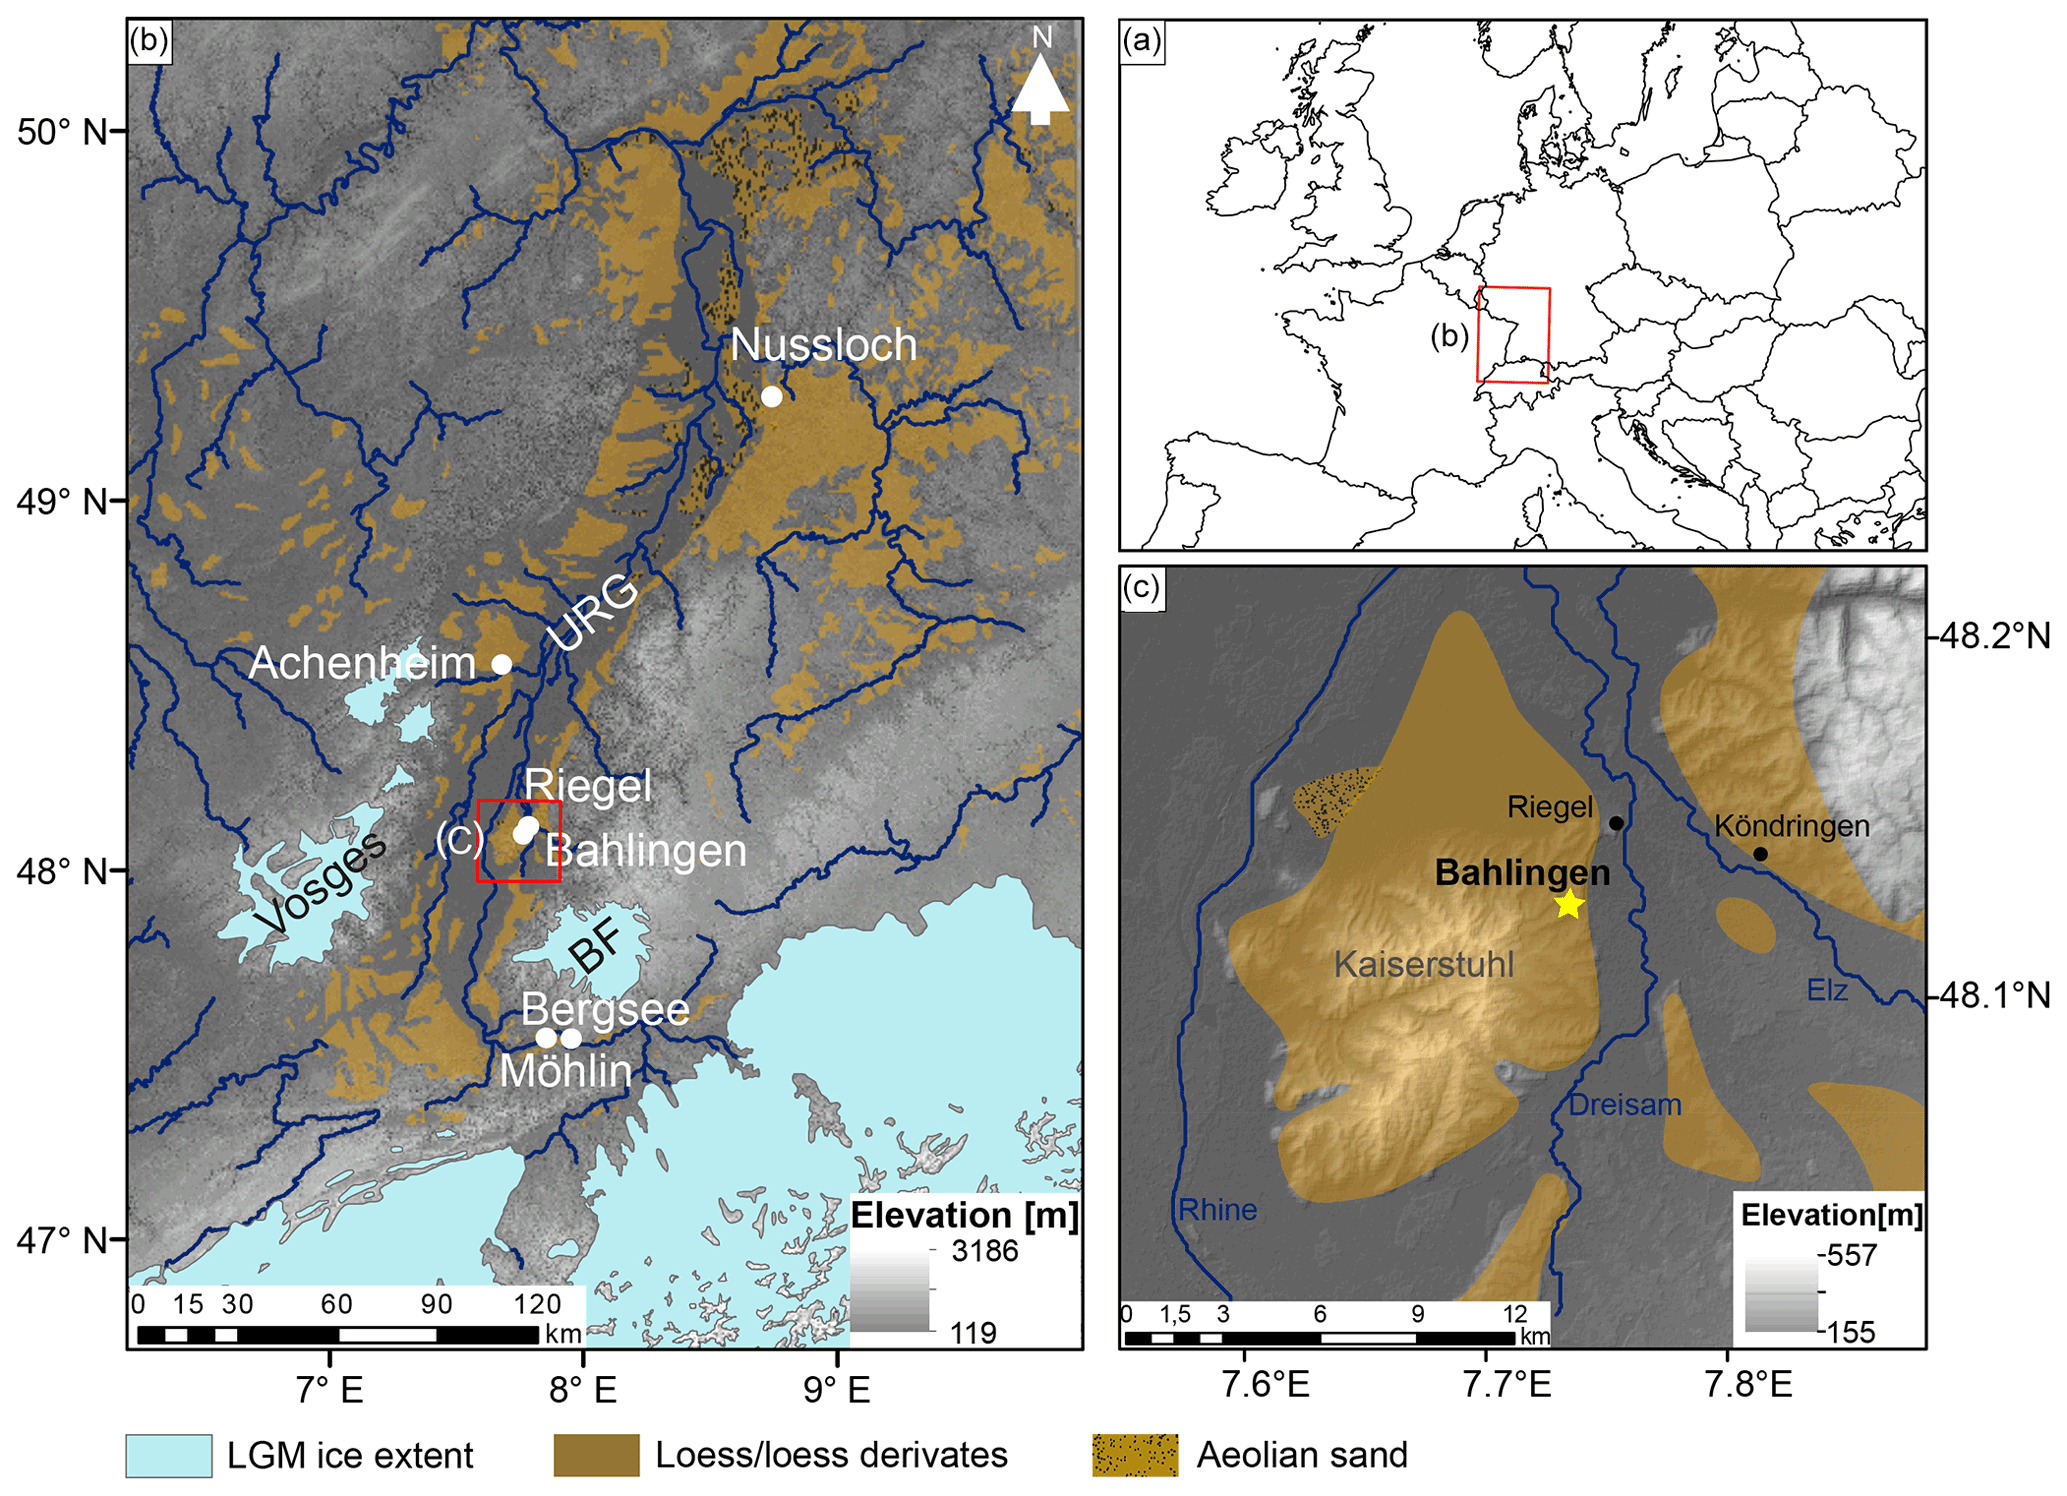
Figure 1(a) Location of the study region in Europe and (b) a digital elevation model (DEM) of the Upper Rhine Graben (URG) and its surroundings. The URG is bordered by the Vosges in the west and the Black Forest (BF) in the east. The river Rhine flows along the centre of the graben, and the Kaiserstuhl volcanic range of hills is located in its eastern part. Displayed are also the extent of glaciers during the maximum of the last glaciation (ca. 24 ka) and the aeolian deposits. (c) The investigated profile is situated in the northeastern part of the Kaiserstuhl on a plateau (Schönenberg) to the west of the village of Bahlingen (yellow star) (map of Germany from https://www.landkartenindex.de/, last access: 1 April 2022; DEM based on Shuttle Radar Topography Mission (SRTM) data, provided by USGS and processed with ArcMap 10.6.1; distribution of aeolian sediments following Lehmkuhl et al., 2021, and ice extent following Ehlers et al., 2011).
2.1 Profile preparation and sampling
In order to minimise impact to the loess cliff, which is located next to a road, we carefully prepared a 60 cm wide and 30 cm deep trench with spades and scratchers. A general profile description was carried out based on observed colour and structural differences. For sedimentary analyses, including determination of organic and carbonate content, grain size analysis, and colour measurements, samples at 5 cm resolution were taken as continuous column (Antoine et al., 2009; Fig. 2). For luminescence dating, 11 samples were collected using metal tubes with a length of 10–15 cm and a diameter of ca. 7 cm. These were hammered into the profile every 50 cm. These samples were also used for the determination of water absorption capacity. About 51 samples were taken for IRSL screening using small and opaque plastic tubes hammered about 3 cm into the profile every 10 cm (Fig. 2c).
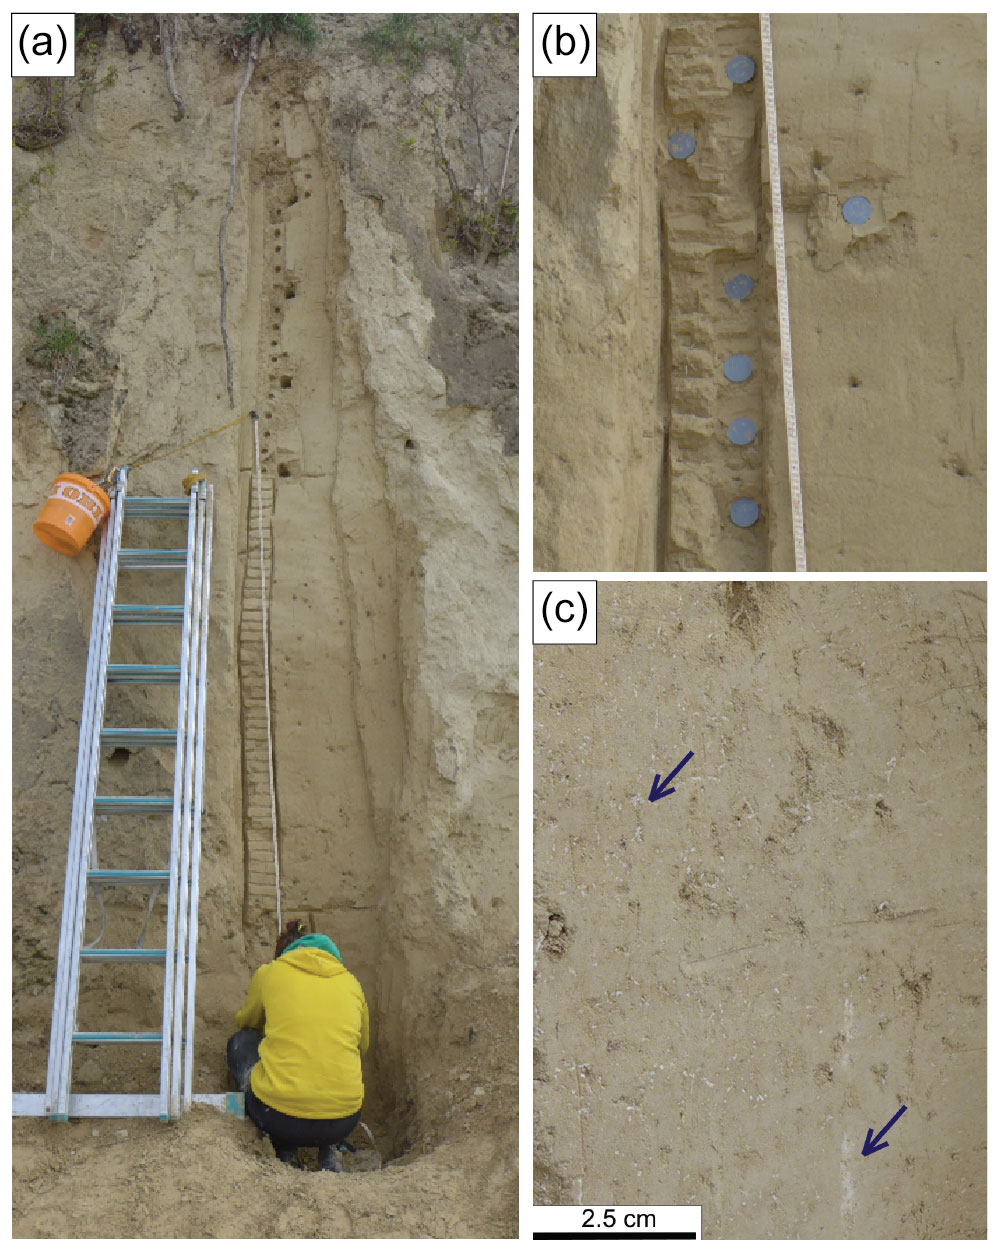
Figure 2(a) The 5 m high loess profile Bahlingen-Schönenberg situated below 1.5 m thick loess disturbed by roots, pedogenesis, and agricultural activity. Note that macroscopically only a few colour changes are visible, mainly related to varying moisture. Small holes at around 1 m height and from 1.8 to 2.6 m were caused by carbonate concretions that fell out. (b) Plastic tubes hammered into the loess profile every 10 cm for IRSL screening. (c) Examples of pseudomycelia (secondary carbonate of former grass root channels).
2.2 Colour measurements
For colour measurements at the University of Bern, a ColorLite sph850 spectrophotometer was used on air-dried fine earth (Sprafke, 2016). The measuring diameter is 3.5 mm, the observer angle 10∘, and the light source corresponds to D65, emitted from six LEDs. With this spectrophotometer wave lengths from 400 to 700 nm can be measured with a spectral resolution of 3.5 nm. The measuring head was gently pushed into the loose sample material until it was completely sealed from daylight. Between two triplicate measurements at different sample positions, the sample material was stirred. After every 10th measurement the spectrophotometer was calibrated using a white standard disc. All data (various colour variables, remission spectra) were exported to Microsoft Excel© tables with the spectrophotometer software ColorDaTra 1.0.181.5912. After checking for outliers, mean values for each sample were calculated and visualised as real colours based on RGB variables. RGB tuning in three steps was done according to Sprafke et al. (2020) to determine subtle colour variations in the weakly differentiated profile. Variations between oxidative and reductive colours are indicated by the warm–cold value (WCV) according to Sprafke et al. (2013) as the ratio between the spectral reflectance values of 600–700 nm divided by the values of 400–500 nm. Variations in lightness are represented by the L* value of the CIELAB colour space (Viscarra Rossel et al., 2006).
2.3 Grain size analysis
Grain sizes were determined with laser diffraction spectrometry (LDS), using a Malvern Mastersizer 3000 at the University of Freiburg. The Mastersizer 3000 determines the particle size indirectly by irradiating a suspension with a laser and evaluating the generated angles and intensities of scattered light. For measurements the samples were dried at 105 ∘C for at least 12 h and sieved through a mesh size of 1 mm. 1–2 g of the subsample <1 mm was dispersed for 12 h with 50 ml liquid consisting of 33 g Na6O18P6 and 7 g Na2CO3 dissolved in 1 L of distilled water (Abdulkarim et al., 2021). The standard operating procedure for every sample comprised five measurements for each sample and the calculation of grain sizes after the Mie theory of light scattering. After measurements, the data were exported to a Microsoft Excel© worksheet, and average values for each sample were calculated out of the five measurements using MATLAB R2021a. Clay contents determined by LDS strongly underestimate clay contents determined by classical pipette methods; therefore, we use the boundary of 6.3 µm as equivalent to pipette clay measurements (cf. Makó et al., 2017). To interpret changes in wind intensity and dynamics, the grain size index (GSI: [percent between 20 and 63 µm] [percent <20 µm]) was calculated (Antoine et al., 2009).
2.4 Determination of organic carbon and carbonate content
After removing the pore water by drying at 105 ∘C, the samples were pestled with a mortar and sieved through a 2 mm sieve. About 1 g, referred to as dry weight DW105, was weighed out and put in a crucible with known weight. For the determination of organic carbon content, the material was burned in a first cycle at 550 ∘C for 5 h in a Nabertherm muffle (Heiri et al., 2001). Afterwards the crucible was weighed. The LOI is calculated in weight percentage (wt %) out of the dry weight and the weight measured after the 550 ∘C burning cycle (Heiri et al., 2001). As per Meyers and Lallier-Verges (1999), the calculated LOI after the 550 ∘C burning cycle is twice the real organic carbon content. Therefore, the calculated data are bisected to obtain the organic carbon content in a last step. The carbonate content was determined in a second burning cycle, which comprised burning for a further 3 h at 950 ∘C (Heiri et al., 2001). The LOI after 950 ∘C can be calculated similarly to the LOI after 550 ∘C, out of the dry weight, the weight measured after the 550 ∘C burning cycle, and the weight measured after the 950 ∘C burning cycle (Heiri et al., 2001). Since carbon dioxide has a molar mass of ∼44 g mol−1 and carbonate (CO has a mass of 60 g mol−1, the LOI950 has to be multiplied by the ratio of these two masses (1.36) to obtain the carbonate content in the sample (Bengtsson and Enell, 1986; Heiri et al., 2001).
2.5 Magnetic susceptibility
For magnetic susceptibility (weight normalised; χ) measurements, carried out at the Leibniz Institute for Applied Geophysics in Grubenhagen, samples were dried, homogenised, and placed in non-magnetic plastic boxes of 6.4 cm3 in a way that material is fixed and cannot move. The χ was measured in alternating fields of 505 and 5050 Hz with 400 A m−1 using a MAGNON VFSM (variable field susceptibility metre), providing both low-field χ and frequency dependency of the χ. χ is given weight-normalised, taking weights of samples and boxes into account. Temperature-dependent χ was measured following Zeeden et al. (2021) in an Argon atmosphere for five samples (depths: 1.00, 2.60, 2.65, 3.20, 3.95 m) using an AGICO CS3 high-temperature furnace.
2.6 Luminescence screening and dating
2.6.1 Methodological background
During the past decades, luminescence dating has established as key method for constraining the age of LPS (e.g. Roberts, 2008). The advantage of the method is that it allows us to directly determine the age of dust deposition, uses the omni-present quartz and feldspar minerals, and has a dating range potentially reaching back several hundreds of thousands of years. However, luminescence dating is quite laborious and is affected by several methodological challenges (e.g. Preusser et al., 2008; Rittenour, 2018). While quartz and feldspar overall share the underlying physics, the two minerals have some important differences in luminescence properties. Quartz is known to have an OSL signal that is quickly reset by daylight and to be stable over geological periods (e.g. Preusser et al., 2009). It is hence usually preferred in dating applications. However, depending on provenance, the quartz OSL signal can have problematic properties (e.g. Preusser et al., 2006; Steffen et al., 2009), it may have limited age range due to low saturation dose (e.g. Faershtein et al., 2019), and yet a poorly understood underestimation of quartz has been observed on some occasions (e.g. Lowick et al., 2010; Anechitei-Deacu et al., 2018). Since feldspar usually shows both bright signals and a much higher saturation level, this mineral has attracted a lot of attention over the last 15 years. However, feldspar IRSL is known to contain signal components that are not stable with time. This phenomenon, known as anomalous fading (Wintle, 1973), is explained by the tunnelling of electrons within the crystal structure and will cause underestimation of IRSL ages. While several procedures have been suggested to correct for fading (e.g. Huntely and Lamothe, 2001; Kars et al., 2008), these are all based on measuring signal loss (i.e. the fading rate) over short periods of time (hours to months). The signal loss is then extrapolated to geological time periods (thousand to hundred thousand of years), assuming fading is constant with time and independent of environmental condition such as temperature.
To overcome the need of fading correction, it has been suggested to remove the unstable IRSL component by a first measurement and collect a more stable signal during subsequent stimulations at elevated temperature (Thomsen et al., 2008; Buylaert et al., 2009). This procedure is known as post-IR IRSL and has seen increasingly frequent application since its original development (see review by Zhang and Li, 2020). A modification of the original approach was introduced by Li and Li (2011), who introduced a protocol during which IRSL is subsequently stimulated at increasingly higher temperatures at 50∘C increments. The advantage of this MET approach is that it delivers additional information as the degree of stability at higher temperatures is usually at the cost of bleachability of the signal (Kars et al., 2014). Furthermore, higher stimulation temperatures may be affected by changes of sensitivity that may lead to incorrect estimates (e.g. Zhang, 2018). As a consequence, despite the huge potential to expand the dating range, application of the MET post-IR IRSL approach is not always straightforward.
Due to the time and costs required for producing luminescence ages, portable luminescence readers have been used in particular to identify potential breaks in sedimentary sequences in the field (see review by Munyikwa et al., 2021). A similar approach is to take samples to the laboratory but reduce the amount of preparation and simplify the measurement procedures to speed up the required time for receiving preliminary age information (e.g. Roberts et al., 2009; May et al., 2018). This approach is referred to as screening.
2.6.2 IRSL screening
In the red-light laboratory, the outer ca. 1 cm of the sample material from the light-contaminated ends of the sampling tubes was discarded. Samples were then dried at 50 ∘C for at least 24 h and gently pestled in a mortar. Part of the material gained this way was fixed on small steel sample discs that were previously coated with a thin layer of silicon oil (6 mm stamp) so that the sample material would stick to the surface during measurement. For each sample, three subsamples were generated. Measurements were done on a Lexsyg Smart device (Freiberg Instruments; Richter et al., 2015) with the detection window centred at 410 nm. The measurement protocol comprised IRSL stimulation (850 nm, 130 mW cm−3) of the natural signal (Ln) and that induced by laboratory irradiation (Tn, ca. 22 Gy, source dose rate ca. 0.1 Gy s−1), both after heating to 250 ∘C (preheat) and using a stimulation at 50 ∘C (Table S1 in the Supplement). The ratio was calculated based on the IRSL emission recorded during the first 20 s of stimulation, after subtracting the last 20 s as background.
2.6.3 Luminescence dating
Under red-light laboratory illumination, 5 cm sample material from the light-contaminated ends of the metal tubes was removed and used for gamma spectrometry and determination of water absorption capacity. From the inner sample material, due to the shortage of sand, the fraction 63–250 µm was gained by wet sieving, first being treated with hydrochloric acid (ca. 20 %) to remove carbonates, followed by treatment with hydrogen peroxide (30 %) to remove organic components. After each chemical treatment the material was washed with distilled water. A feldspar (δ<2.58 g cm−3) and quartz fraction (δ>2.58, δ<2.70 g cm−3) was subsequently isolated by density separation (LST Fastfloat©). The quartz fraction was etched with 40 % hydrofluoric acid for 60 min to dissolve any feldspar contamination and remove the outer layer of the grains. For measurements, grains were mounted on metal discs with a 2 mm stamped spot of silicon oil (ca. 100 grains).
All equivalent dose (De) measurements were done on a Lexsyg Standard device (Freiberg Instruments; Richter et al., 2013). Overall, the amount of sand-size grains was quite low which limited the number of replicate measurements. Quartz OSL was measured using a slightly modified version of the single aliquot regenerative dose (SAR) protocol originally developed by Murray and Wintle (2000, 2003; Table S2). Stimulation was done by green LEDs (525 nm, 90 mW cm−2) with application of a detection window centred at 365 nm (Schott BG39 3 mm plus Delta BP 365/50 EX Interference 5 mm). For feldspar, the MET post-IR IRSL following Li and Li (2011) was used (Table S3), with stimulation centred at 850 nm (300 mW cm−2) and detection peak at 410 nm (Schott BG39 3 mm plus AHF BrightLine 414/46 interference filter). For all samples, mean De was calculated using the central age model (Galbraith et al., 1999) as individual De values are normally distributed and show overdispersion values <20 % (most between 10 % and 15 %), which is considered to indicate well-bleached samples. The only exceptions apply to quartz OSL of the lower two samples, which is discussed below.
Material for water absorption capacity tests and measurement of dose-rate-relevant elements was dried at 105 ∘C for at least 12 h, ground, and sieved <2 mm. Water absorption capacity was determined after DIN 18132 using an Enslin–Neff apparatus. This resulted in an average value of 38±2 %. The present-day water content was measured to 6±3 %, with the highest value of 10 % determined for the lower part of the sequence that was better protected from drying out. While water uptake capability gives the maximum value of the unconsolidated material, present-day water content likely represents a minimum estimate due to drying of sediment close to the surface of the exposure. Hence, an average water content of 20±5 % was used in the calculations.
High-resolution gamma spectrometry was carried out using a high-purity germanium (HPGe) detector (ORTEC GMX30P4-PLB-S, n-type coaxial, 30 % efficiency, 1.9 keV FWHM (full width at half maximum) at 1.33 MeV, detector diameter 54.8 mm, end cap diameter 70 mm, liquid nitrogen cooling). Plastic containers with a volume of ca. 130 cm3 were completely filled with homogenised sediment, sealed with adhesive tape, and stored for at least a month to build up equilibrium between radon and its daughters. After storage, the sample containers were measured for several days to determine the activities of primordial radionuclides 40K, 232Th, and 238U. The detector is installed in a lead shielding to minimise the influence of the environmental radioactivity. Additionally, a blank sample (empty container) was measured to account for background radiation. The 238U content was determined by analysing the peaks of the 226Ra daughters 214Pb (295.2 and 351.9 keV) and 214Bi (609.3, 1120.3, 1764.5 keV). The 234Th line at 63.3 keV was used to quantify a possible radioactive disequilibrium in the 238U decay chain. The 232Th content was determined by analysing the peaks of the 228Ra daughter 228Ac (338.3, 911.1, 969.1 keV) and the 228Th daughters 212Pb (238.6 keV) and 208Tl (583.2 keV). 40K was measured directly at 1460.8 keV. The weighted mean of all selected peaks was then calculated to determine the activities of the parent radionuclides 238U and 232Th.
Dose rates (Table S4) and ages were calculated using the software ADELE v2017 (Degering and Degering, 2020; https://www.add-ideas.de/, last access: 1 April 2022), which uses the dose rate conversion factors of Guérin et al. (2011). Cosmic-ray dose rates were corrected for geographic position and burial depth following Prescott and Hutton (1994). All ages are given at 1σ level with reference to the year of sampling (2021 CE).
2.6.4 Age–depth modelling
Age–depth models of both OSL and pIR-200 dates were constructed using the model of Zeeden et al. (2018). This method establishes an age–depth model from luminescence ages without making assumptions regarding sedimentation rate or the sedimentation process itself. It involves an inverse model and uses a conservative measure for the random part of the overall uncertainty. In this case, uncertainty is dominantly of random nature because the mean luminescence ages show several inversions which we assign to random uncertainty.
3.1 Profile description
The investigated profile consists of silt-dominated loess with only subtle colour differences, notably a slightly darker tone in the lowermost metre (Fig. 3). Throughout the section, there are concretions of iron and/or manganese of 1–3 mm in size, pseudomycelia (secondary carbonate of former grass root channels; Fig. 2c), and snail shells and shell fragments. Sieving to <250 µm for luminescence dating confirmed that larger components in this profile are mainly calcified root cells, carbonate cemented silty pore walls, and shell fragments. From 1 to 1.35 m several loess dolls were observed with a diameter of ∼3 cm, and from 2.1 to 2.8 m their diameter was 1–2 cm. The occurrences of snail shells, manganese concretions, and loess dolls in the profile stratigraphy are shown in Fig. 3. The stratigraphic subdivision into four main units (I–IV), each with four to nine subunits, was finally defined based on quantitative colour and grain size data (cf. Sprafke et al., 2020).
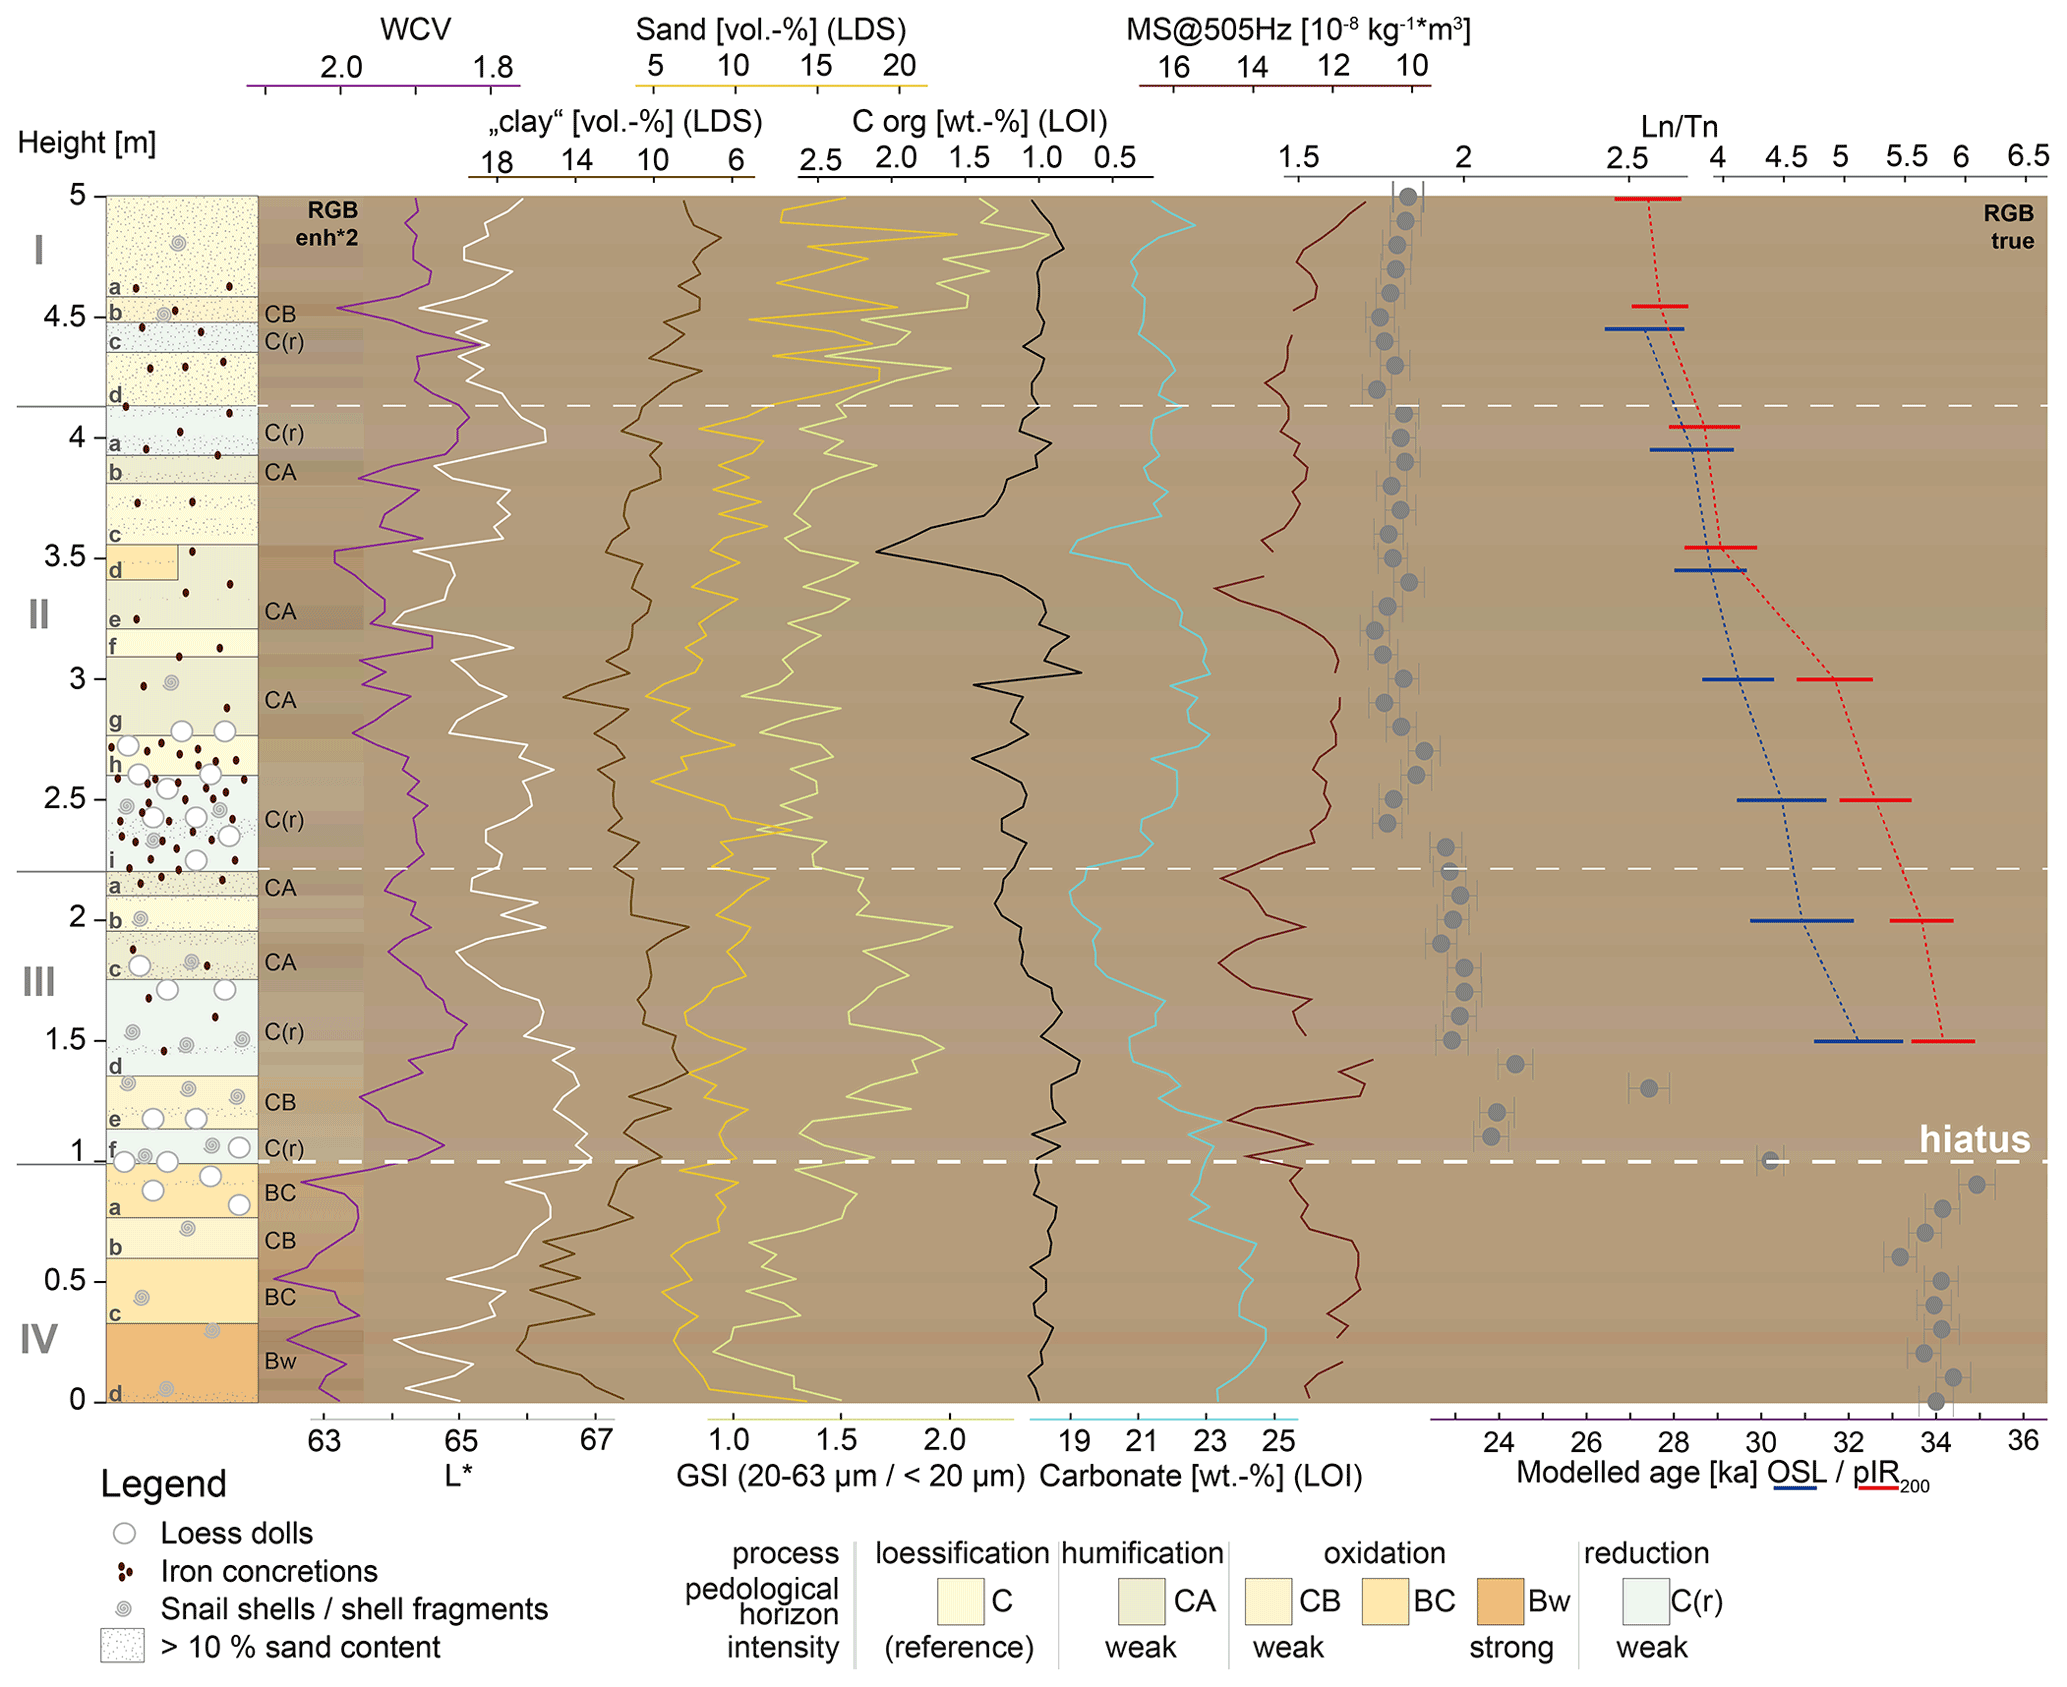
Figure 3Stratigraphy and main laboratory data with two times enhanced RGB colours behind pedological horizons and true RGB colours behind the data plots. Data peaks oriented to the left indicate enhanced oxidative soil formation, and peaks to the right indicate more aeolian activity and reductive pedogenesis. “Clay” refers to the LDS fractions <6.3 µm (see “Materials and methods” section). Note the change in scale of the luminescence screening results ().
3.2 Colour and stratigraphy
Field and untuned RGB colours indicate a weak stratigraphic differentiation of the profile, which becomes clearer by enhanced RGB colours (Fig. 3). The WCV (range: 1.8–2.1) and the L* value (range: 64–67) differentiate the main colour components. The inversely plotted WCV and the L* value show largely similar variations, indicating that major deviations from loess colour are pale blue and slightly darker brownish horizons. Unit VI at the bottom of the sequence has the highest WCV of the profile (>1.95) due to an overall light brown colour. L* values from <65 to 66 indicate a gradient from brown to pale brown colours from bottom to top, leading to the classification of Bw and BC or CB horizons, respectively. Unit III has the highest L* values (>66) of the whole profile in its lower part; the WCV differentiates greyish (C[r]) from brownish (CA and CB) horizons. Units II and I have a comparable colour pattern with different C(r) and CA or CB horizons.
3.3 Grain size composition
The granulometry reveals the predominance of coarse silt (20–63 µm; 45 %–60 %) and a mode of 20–25 µm throughout the profile (Fig. 3). Little sand (<1.6 %) is present, mainly in Units I and IIIe to VI. The mean grain size of the profile is coarse silt, and only in Unit IVd is it partly medium–fine silt (20–6.3 µm). The GSI ranges approximately between 1 and 2.5 and has more or less the same pattern as the mean grain size, with maxima in Units I and III and minima in Units II and IV (Fig. 3). Clay content (LDS particles <6.3 µm) varies largely parallel to the GSI between 6 % and 12 % in Units I–III and has its maximum (ca. 14 %) in Unit IV. Sand contents vary largely parallel to the GSI. However, in Unit III the GSI has much more pronounced variability compared to sand contents.
3.4 Organic carbon, carbonate content, and magnetic susceptibility
In general, the organic carbon content (Corg) varies relatively constant around 1 wt % along the profile, with no clear relation to stratigraphy (Fig. 3). A distinct peak at 3.5 m, along with comparably low carbonate contents, was confirmed by repeated measurement establishing that this is a real sample property. These unusual values may relate to a crotovine with soil material (low carbonate, high Corg) not recognised during sampling. Carbonate contents vary between 19 % and 24 %, with the highest values in Unit IV and minima in Units IIIa–c. Small oscillations are usually parallel to the inversely plotted contents of Corg, indicating these parameters are rather antagonists. Overall carbonate contents appear largely opposite to the GSI, which means that finer loess has higher carbonate contents. This trend is not confirmed in Unit I, where carbonate contents remain constant, despite the highest sand contents.
Mass-specific χ values oscillate around 12– m3 kg−1. The (inversely plotted) χ shows contrasting trends to variations in carbonate content and is opposite to variations of the GSI (Fig. 3). The three χ maxima in Unit III and a distinct peak in Unit IIe, all corresponding to CA horizons, do not follow this general pattern. In these horizons, the carbonate contents are also the lowest. The thin or less pronounced CA horizon IIb and IIg do not show χ maxima and carbonate minima. Generally, χ is low compared to other loess localities in Eurasia but comparable to loess of similar age from Nussloch (Taylor and Lagroix, 2015). The temperature-dependent magnetic susceptibility properties are similar to loess in Willendorf, Austria (Zeeden and Hambach 2021). The susceptibility stays rather constant until 250 ∘C, increases towards 300 ∘C, then decreases until ∼420 ∘C, and increases towards ∼550 ∘C. From this maximum during heating, the susceptibility decreases sharply towards ∼600 ∘C and continues to decrease from ∼600 to 700 ∘C (Fig. 4). This pattern is observed for all samples; therefore, only one is shown in Fig. 4.
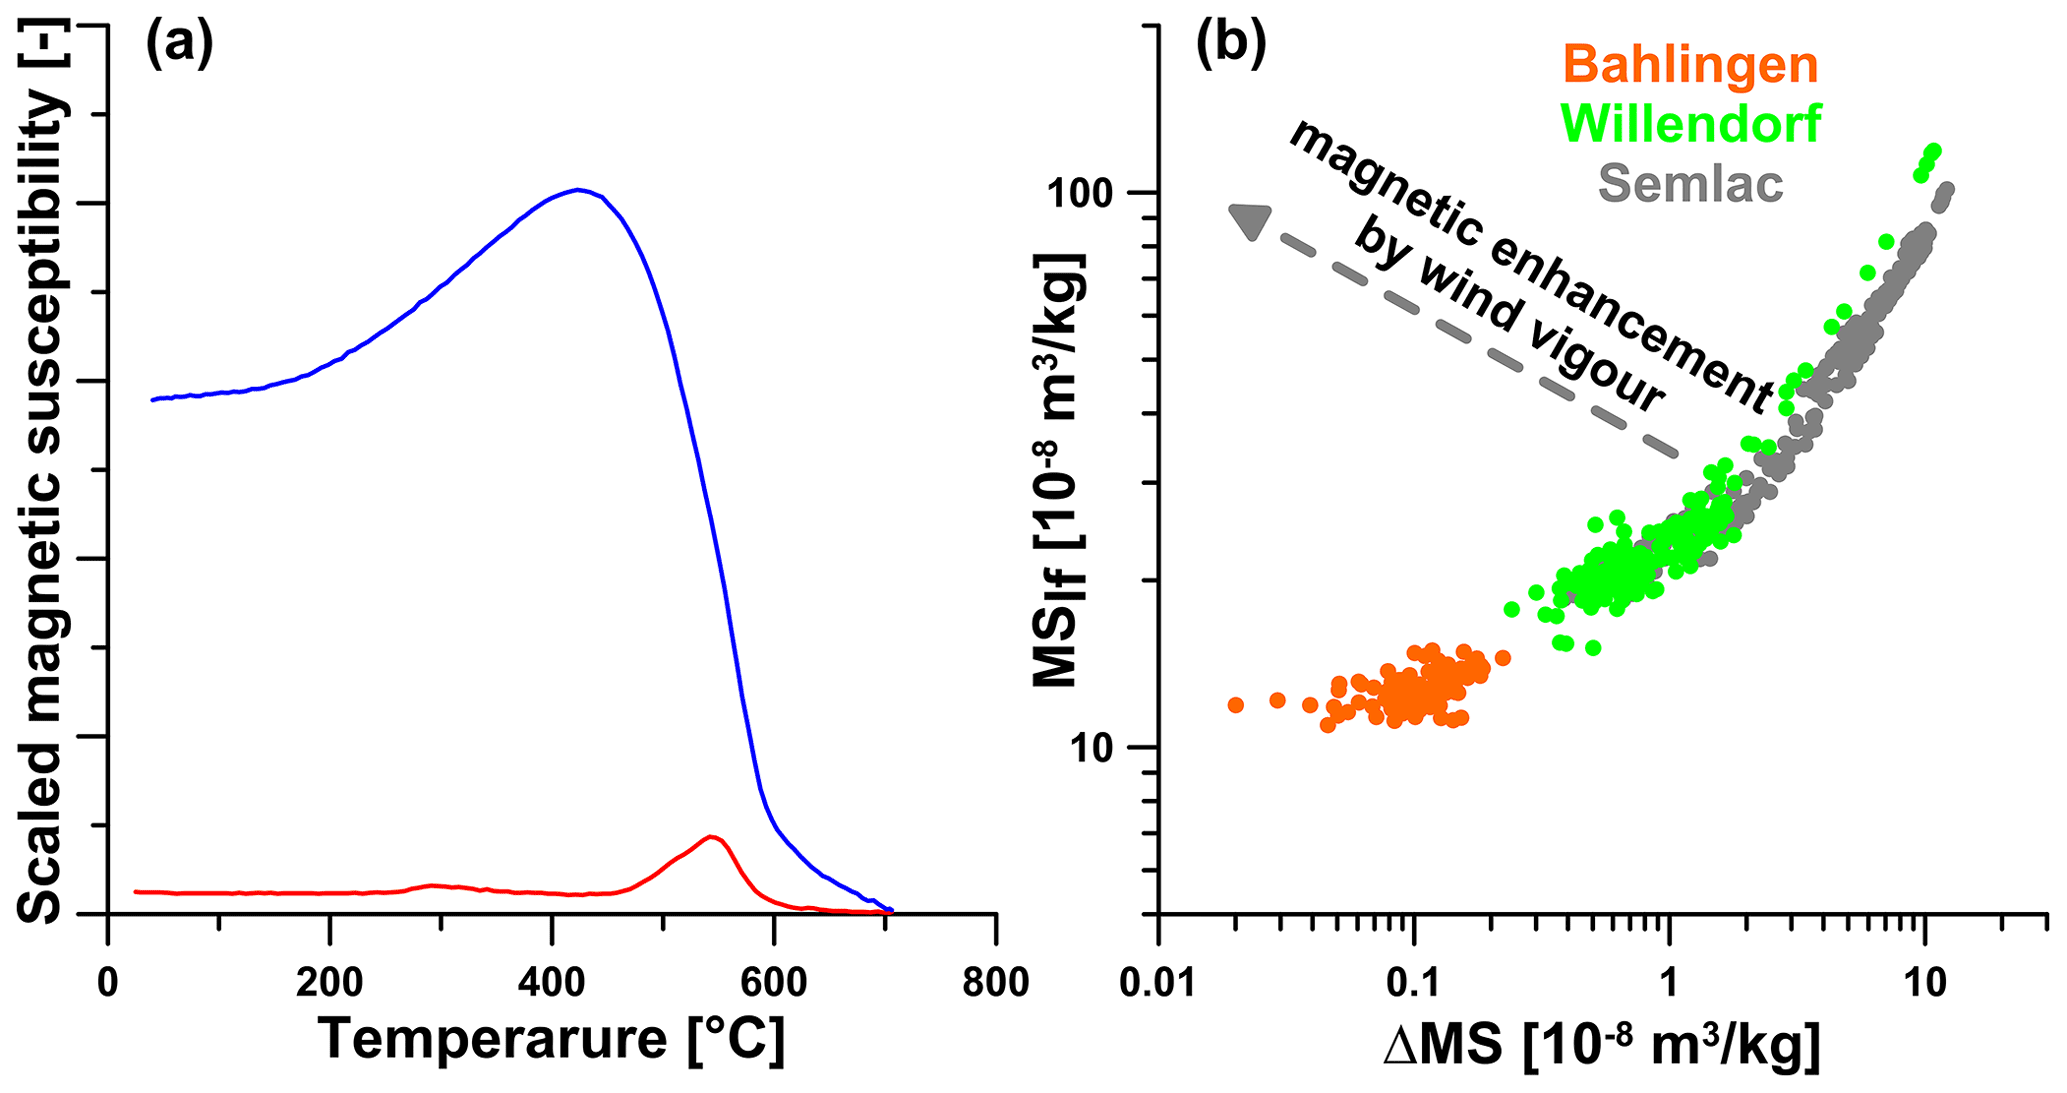
Figure 4(a) Temperature-dependent susceptibility heating (red) and cooling curve (blue). Note that during heating the main decrease in susceptibility occurs around 600 ∘C, indicative of magnetite. (b) Comparison of the magnetic susceptibility and its frequency dependence to the loess sections of Willendorf and Semlac (Zeeden et al., 2016; Zeeden and Hambach, 2021). This shows both the low susceptibility and also the low-frequency dependence. Because the frequency dependence is lower than also pure loess at Semlac, water logging and the associated decrease in at least the frequency-dependent susceptibility are assumed. No strong indication for wind vigour is present.
3.5 IRSL screening
The IRSL screening results show two distinct groups of values (Fig. 3). The first group comprises Unit IV and is characterised by values between 5.4 and 6.1. In comparison to the second group the distribution is partly scattered and shows some increase in values with increasing height. This indicates either a change in dose rate or the presence of partial bleaching of the IRSL signal prior to deposition in some of the samples. The second group comprises Units I to III and is characterised by values between 1.7 and 2.2, with a single outlier of 2.6 at a height of 1.3 m. The values are not perfectly aligned and show smaller offsets, namely at a height of 1.45, 1.85, 2.35, 2.55, 2.75, 2.95, 3.35, and 4.05 m. However, the second group of values appears overall quite homogeneous with limited variability in the values. The most likely explanation for the observed two groups of values appears to be a large hiatus in between Units III and IV. The sample taken across the expected hiatus between Units III and IV, which was not obvious in the field, has a value of 4.4, which represents the average of the values directly above and below.
3.6 Luminescence dating
Originally, 11 samples were taken for luminescence dating at intervals of 50 cm along the profile. Due to the likely hiatus within the profile at a height of 1 m, the sample taken at this height (across the hiatus) was discarded. For all investigated samples, the quartz OSL signals are moderately bright and show a rather rapid decay, reaching background within ca. 2 s of stimulation (note that green stimulated OSL decays much slower than blue stimulated OSL). The shape of the OSL decay curves of the natural and artificially irradiated sample is similar, and OSL growth curves fit well when using the sum of exponential saturating functions (Fig. 5a). Unfortunately, the amount of quartz remaining after sample preparation was low for several samples, which limited the number of replicate measurements (Table S5). The feldspar signals are also only moderately bright but much brighter than quartz OSL. Interestingly, the growth curves of IRSL and the different post-IR IRSL signals show pronounced differences in shape (Fig. 5b). While IRSL and pIR-100 have a quite similar behaviour, pIR-150 shows a much steeper shape of the growth curve. Both the pIR-200 and pIR-250 show a much flatter shape of dose response.
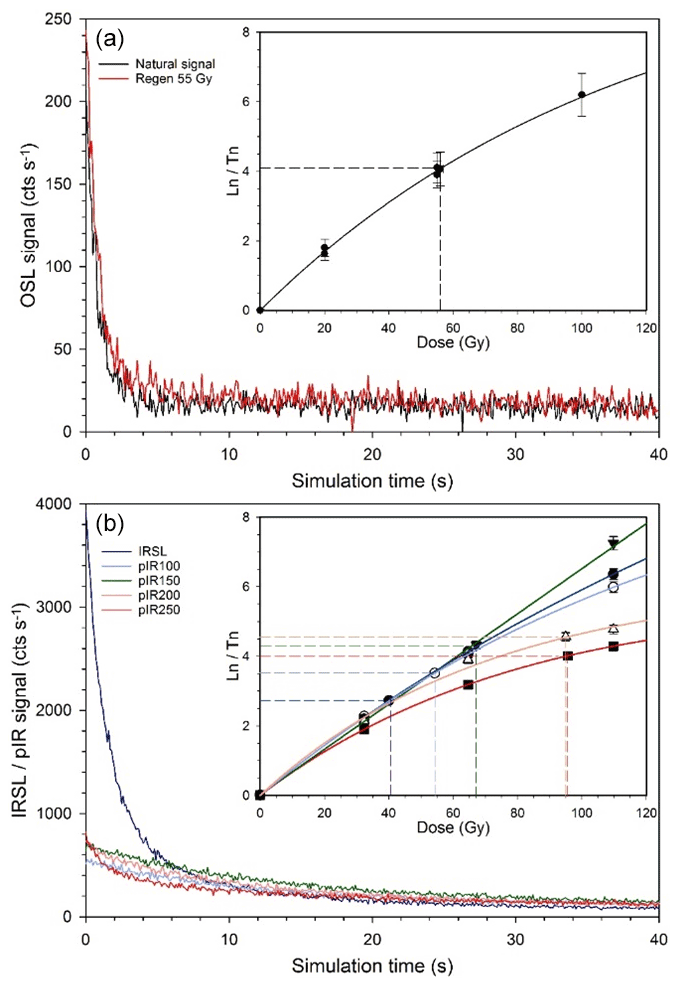
Figure 5Example of luminescence characteristics. (a) Quartz extracted from sample BAL-200 reveals rather weak OSL emissions but a similar decay shape for both the natural and laboratory-induced signal. Dose response curves are well described by a single-exponential saturating function. (b) IRSL decay curves are several times brighter than for pIR. The shape of the IRSL and pIR growth curves is significantly different for the different approaches. Both pIR-200 and pIR-250 show a less steep increase compared to lower stimulation temperatures, implying an earlier saturation level.
All luminescence ages are presented in Table 1. The determined ages confirm the hiatus between the lower (Unit IV) and upper part (Units I to III) of the profile (Fig. 3). The samples from above the hiatus are internally consistent but show significant differences between the different approaches (Fig. 6). The average ratios in relation to OSL (excluding the top and two bottom samples) are 0.53±0.03 (IRSL), 0.76±0.05 (pIR-100), 0.93±0.05 (pIR-150), 1.04±0.06 (pIR-200), and 1.16±0.08 (pIR-250). The differences are likely explained by signal instability, as well as the effect of partial bleaching and/or thermal transfer, as discussed later in the paper.
Table 1Ages determined at 50 (IRSL), 100, 150, 200, and 250 ∘C using the MET pIR protocol are shown for the different profile heights, as well as the ages determined using quartz and a SAR protocol (OSL). Ages are given in kiloyears before the year of sampling (2021).
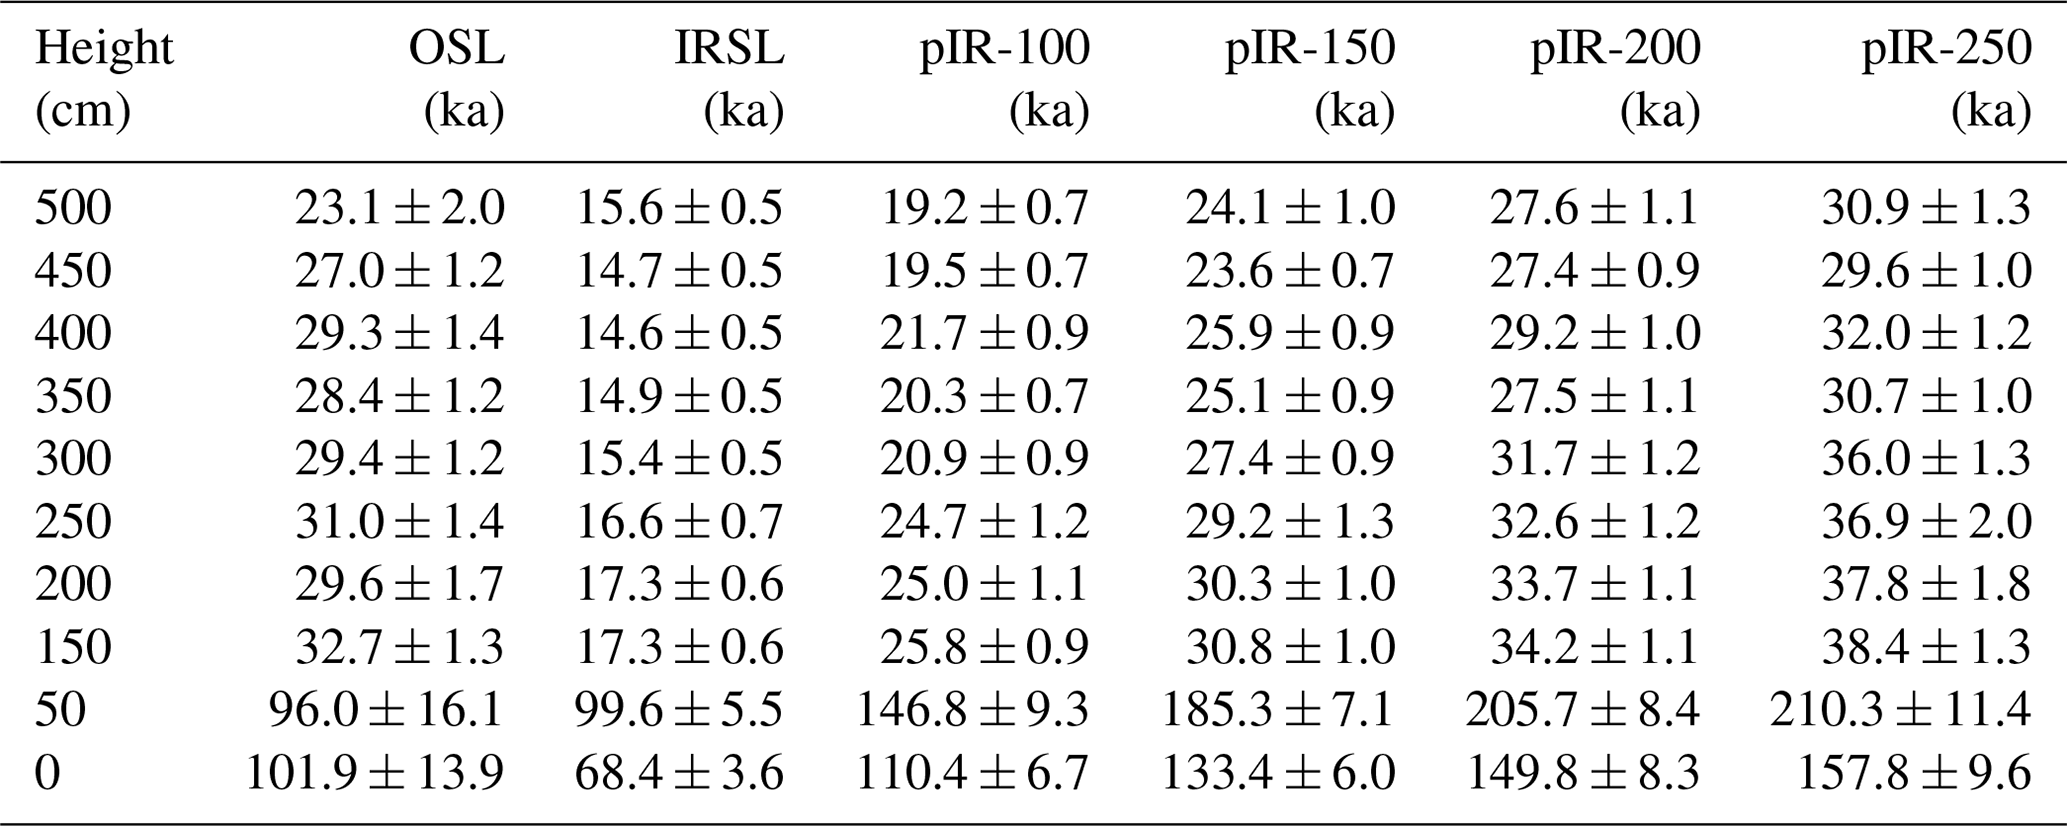
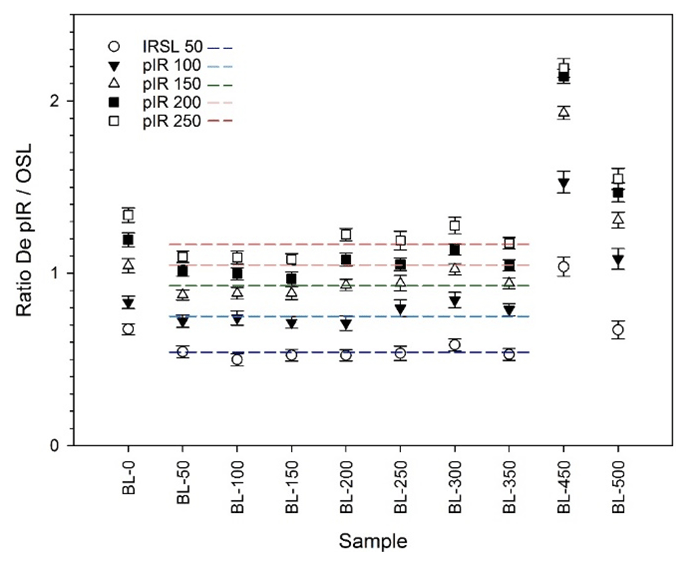
Figure 6Comparison of IRSLpIR versus OSL ratios calculated for all samples investigated in this study. Most samples (BL-50 to BL-350) reveal rather similar ratios. The ratio for the two samples from below the lower discontinuity show higher ratios, which reflects either an underestimation of OSL or, more likely, overestimation of IRSL and pIR due to incomplete bleaching of the signal. Furthermore, the top sample (BL-50) also reveals a consistently higher ratio, which is interpreted to reflect an underestimation of the OSL age in this case.
For the samples from below the hiatus at 1 m, sample BL-0 has an OSL age of 101.9±13.9 ka and sample BL-50 an OSL age of 96.0±16.1 ka. However, these ages are only based on 3 and 10 replicate measurements, respectively, which calls for caution with regard to the chronological interpretation. The corresponding pIR ages show a significant offset and are internally not consistent; sample BL-50 (pIR-200: 205.7±8.4 ka) shows a clearly older age than the underlying samples BL-0 (pIR-200: 149.8±8.3 ka), as is discussed further below.
4.1 Variations in proxy data
In the field, the LPS Bahlingen gives the impression of weakly differentiated loess with some loess-specific features such as loess dolls, snails shells, and iron/manganese concretions. Luminescence screening, confirmed by the dating results, indicates a major hiatus between Units IV and III. There is no indication of major erosional phases within Units I–III; therefore, this part of the profile will likely have recorded subtle palaeoenvironmental variations during a quasi-constant build-up. While granulometry of weakly differentiated LPSs largely reflects changes in sedimentation dynamics (Antoine et al., 2009; Schulte et al., 2018), changes in colour, χ, Corg, and possibly clay content are sensitive to post-sedimentary alteration, i.e. pedogenesis (Sprafke et al., 2020).
Initial soils from loess are usually characterised by enhanced amounts of organic matter, although in palaeosols this is usually lower than in surface soils due to decomposition, while dark colours may persist. Buried dark steppe soils of the LPS Dolní Věstonice have much lower organic carbon contents (0.9 %–1.4 %) than surface steppe soils (ca. 5 %) (Antoine et al., 2013). Advanced development of pedogenesis under warm and humid climate leads to decalcification, oxidation, and clay formation by hydrolysis (Sprafke, 2016); this usually goes along with increasing χ in the course of soil formation (e.g. Heller et al., 1993; Bradak et al., 2021, and references therein). In the presence of permafrost and in the absence of dust deposition, reduced soils form if sufficient soil moisture is present. This will lead to greyish colours, commonly the formation of iron/manganese concretions (Antoine et al., 2009; Terhorst et al., 2015), and possibly the leaching of iron and a reduction of magnetic susceptibility (e.g. Baumgart et al., 2013, and references therein).
Located on a plateau position, the presence of reworked soils and sediments can largely be excluded for the LPS Bahlingen-Schönenberg, and the applied multi-parameter approach is expected to reveal phases of initial pedogenesis (Schulte et al., 2018; Sprafke et al., 2020; Vlaminck et al., 2018). Unit IV appears to be a moderately pigmented pedocomplex with enhanced clay content, but at the same time it contains the highest amount of carbonate throughout the profile and exhibits no increase in χ. This is contrary to common models of pedogenesis on loess, in which oxidation (increase in brownish pigments, higher χ) and clay formation (by hydrolysis) most efficiently take place after decalcification (Stahr et al., 2020). At the LPS Krems-Wachtberg East, loess and brownish (BC) horizons contain 27 % and 18 % of carbonate, respectively, indicating that in the presence of easy weatherable iron-bearing silicates (there: biotite) no complete decalcification is required for brunification (Meyer-Heintze et al., 2018). Yet, at Bahlingen-Schönenberg even higher carbonate values in brownish loess compared to unaltered loess can only be explained by secondary enrichment. We hypothesise that Unit IV was enriched in carbonate during leaching of a formerly superimposed but now eroded and well-developed palaeosol. This does not exclude brunification and changes in magnetic susceptibility in the presence of carbonate. Low magnetic susceptibility may be related to leaching of iron due to high precipitation during pedogenesis (e.g. Ma et al., 2013).
Rather weak colour variations indicate the absence of well-developed palaeosols in Units I–III. It is challenging to link the colour-supported stratigraphy to the other parameter variations as there is no unidirectional pathway of pedogenic alteration, and changes in original sedimentary properties cannot be excluded. It is surprising that Units IIe and IIg share the same colour tone but have distinct differences in Corg and carbonate contents, as well as χ. This deviation is independent of some contamination (IId) likely due to a crotovine.
Coarse silt and fine sand content, as well as the GSI, show a rather similar pattern, contrasting with the variations observed for clay to medium silt content. In the absence of significant weathering and reworking, changes in wind speed as represented by the GSI likely explain most variations in granulometry (Antoine et al., 2009). Another explanation could be changing sediment sources or changes in source granulometry and vegetation cover (Sun et al., 2004; Schulte et al., 2016). Units I and III have a higher content of coarse silt to fine sand, possibly indicating more frequent dust storms during their formation (Antoine et al., 2009).
In Units II to III, carbonate contents vary in opposite pattern to the GSI, indicating that coarser grain sizes contain a smaller contribution of carbonate. CA horizons found in Units IIe, IIIa, and IIc do not only have darker pigments but are characterised by higher χ and lower carbonate contents, possibly indicating initial soil formation. Besides these initial terrestrial palaeosols, there are several pale horizons that likely correspond to very weak tundra gley soils that formed under waterlogged conditions (semi-terrestrial) above permafrost (Antoine et al., 2009, Sprafke et al., 2020). Yet, granulometry and magnetic susceptibility show little sensitivity for these initial palaeosols.
The χ values at Bahlingen-Schönenberg are rather low compared to other Central European loess sections, and it has been shown that χ is influenced by a suite of processes (e.g. Baumgart et al., 2013). The low χ is likely partly caused by a high proportion of quartz and other coarse diamagnetic materials diluting the magnetic signal. Yet, χ oscillates in the same range as χ at the LPS Nussloch and also has a close relation to GSI variations. At Nussloch, enhancement of χ, together with a higher GSI, is explained by a higher proportion of relatively dense (i.e. heavier) magnetite minerals delivered from the Rhine floodplain (Antoine et al., 2009). This wind-vigour model of magnetic enhancement in glacial loess is known from Alaska (Begét and Hawkins, 1989) and Siberia (Chlachula et al., 1998), and it likely also explains the present observations. Here, the effect of dissolution of fine magnetic particles most likely contributes to the feature of the low-frequency dependency of χ. Coarse magnetic particles are too large to be completely dissolved during water logging conditions.
We interpret the temperature-dependent susceptibility properties (Fig. 4) as indicative for contributions of both magnetite and hematite. Here, the decrease in the susceptibility at ∼580 ∘C is interpreted to represent the Curie temperature of magnetite. The further decrease in χ towards 700 ∘C is interpreted as a contribution of hematite; whether this is an original signal or an effect of heating is at this point uncertain, but sediment colour does not speak for a major contribution of hematite. These properties imply that more or less typical loess is present; a large quantity of the iron is originally not in a strongly magnetic phase.
4.2 Luminescence screening and dating
IRSL screening has proven here as a fast (measurements required only ca. 48 h machine time) and low-cost method to identify qualitative variations in the stored luminescence signal. This helped to quickly identify the substantial hiatus between Units III and IV that was not obvious in the field and to discard the sample that was taken exactly on the hiatus. The age from this sampling tube contains grains from above and below the hiatus, which would have produced a mixed age without much value. Nevertheless, in comparison to actual dating the method only provides semi-quantitative results, and small variations in the measured luminescence signal should not be overinterpreted.
For the upper part of the sequence (Units I to III), the OSL ages are within the time range usually considered to yield reliable results. Hence, the OSL ages are considered as reference. Whereas the lower IRSL, pIR-100, and pIR-150 ages are likely underestimated due to fading (Li and Li, 2011), the higher pIR-250 ages possibly relate to hard-to-bleach components or thermal transfer (Preusser et al., 2014) and may thus overestimate the real age of deposition. As a consequence, it appears that the pIR-200 ages should be regarded as the most reliable, and these indeed fit mainly well with the OSL ages. One exception is the topmost sample BL-500, which shows much higher ratios of IRSL and pIR versus OSL age (Fig. 6). In fact, the OSL age of this sample is some 4000 years younger than those determined for the rest of the sequence above the hiatus. However, neither the IRSL and pIR ages nor the IRSL screening data nor the stratigraphy point towards a major hiatus in this part of the sequence. Hence, it appears appropriate to rather favour the pIR-200 age (27.6±1.1 ka) as being more reliable than the OSL of this sample. While there is no obvious explanation supporting the apparent underestimation of this particular OSL age, it should be noted that it is based on only 10 replicate measurements (due to material shortage), compared to 20 to 30 carried out for most other samples.
Two semi-independent age–depth models were constructed for both OSL and pIR-200 (Fig. 3). We excluded the lower part of the sequence from the age–depth model as, first, including only two samples appears to be too few, second, the number of quartz replicate measurements is very low, and, third, the feldspar ages are inconsistent. While underestimation of quartz has been reported from loess (e.g. Anechitei-Deacu et al., 2018), this is usually for higher De values than those observed here. The higher apparent pIR ages could rather be explained by partial bleaching of the signal prior to deposition, which could be due to short distance reworking of sediment (Yi et al., 2016) in a potentially different geomorphological setting than at present (plateau situation). Due to the limited number of ages and the inconsistency with pIR, we only attribute a minimum age of ca. 100 ka for this part of the sequence. It must be the target of future studies to investigate the nature of the hiatus (soil micromorphology) and its spatial appearance (palaeotopography), as well as to address the chronological position in more detail.
4.3 Upper Pleniglacial chronostratigraphy
The OSL age–depth model indicates quasi-constant loess accumulation from ca. 33 to 27 ka. The pIR-200 age model is largely similar for the sequence above 3 m, whereas below, the mean ages are systematically ca. 2000 years older. According to this age model, loess accumulation may have started around 35 ka and continued until ca. 27 but was interrupted (hiatus) at around 30 ka (Figs. 3 and 7). There is no independent numerical or relative stratigraphic age control in support of either the OSL or the pIR-200 age model. Tundra gley soils and other palaeosols are very weakly developed at the LPS Bahlingen-Schönenberg, challenging pedostratigraphic inferences. The variations in the GSI at Bahlingen largely differ for the GSI of the contemporary part of the LPS Nussloch. At Nussloch the GSI is low before 30 ka and during later interstadials is represented by tundra gley soils, whereas at Bahlingen, the sequence older than 30 ka has distinct GSI peaks and lacks a GSI peak corresponding to the first major Nussloch loess event around 30 ka (Fig. 7). As we did not observe evidence for loess reworking, this pattern is likely related to a distinct aeolian deposition regime at Bahlingen.
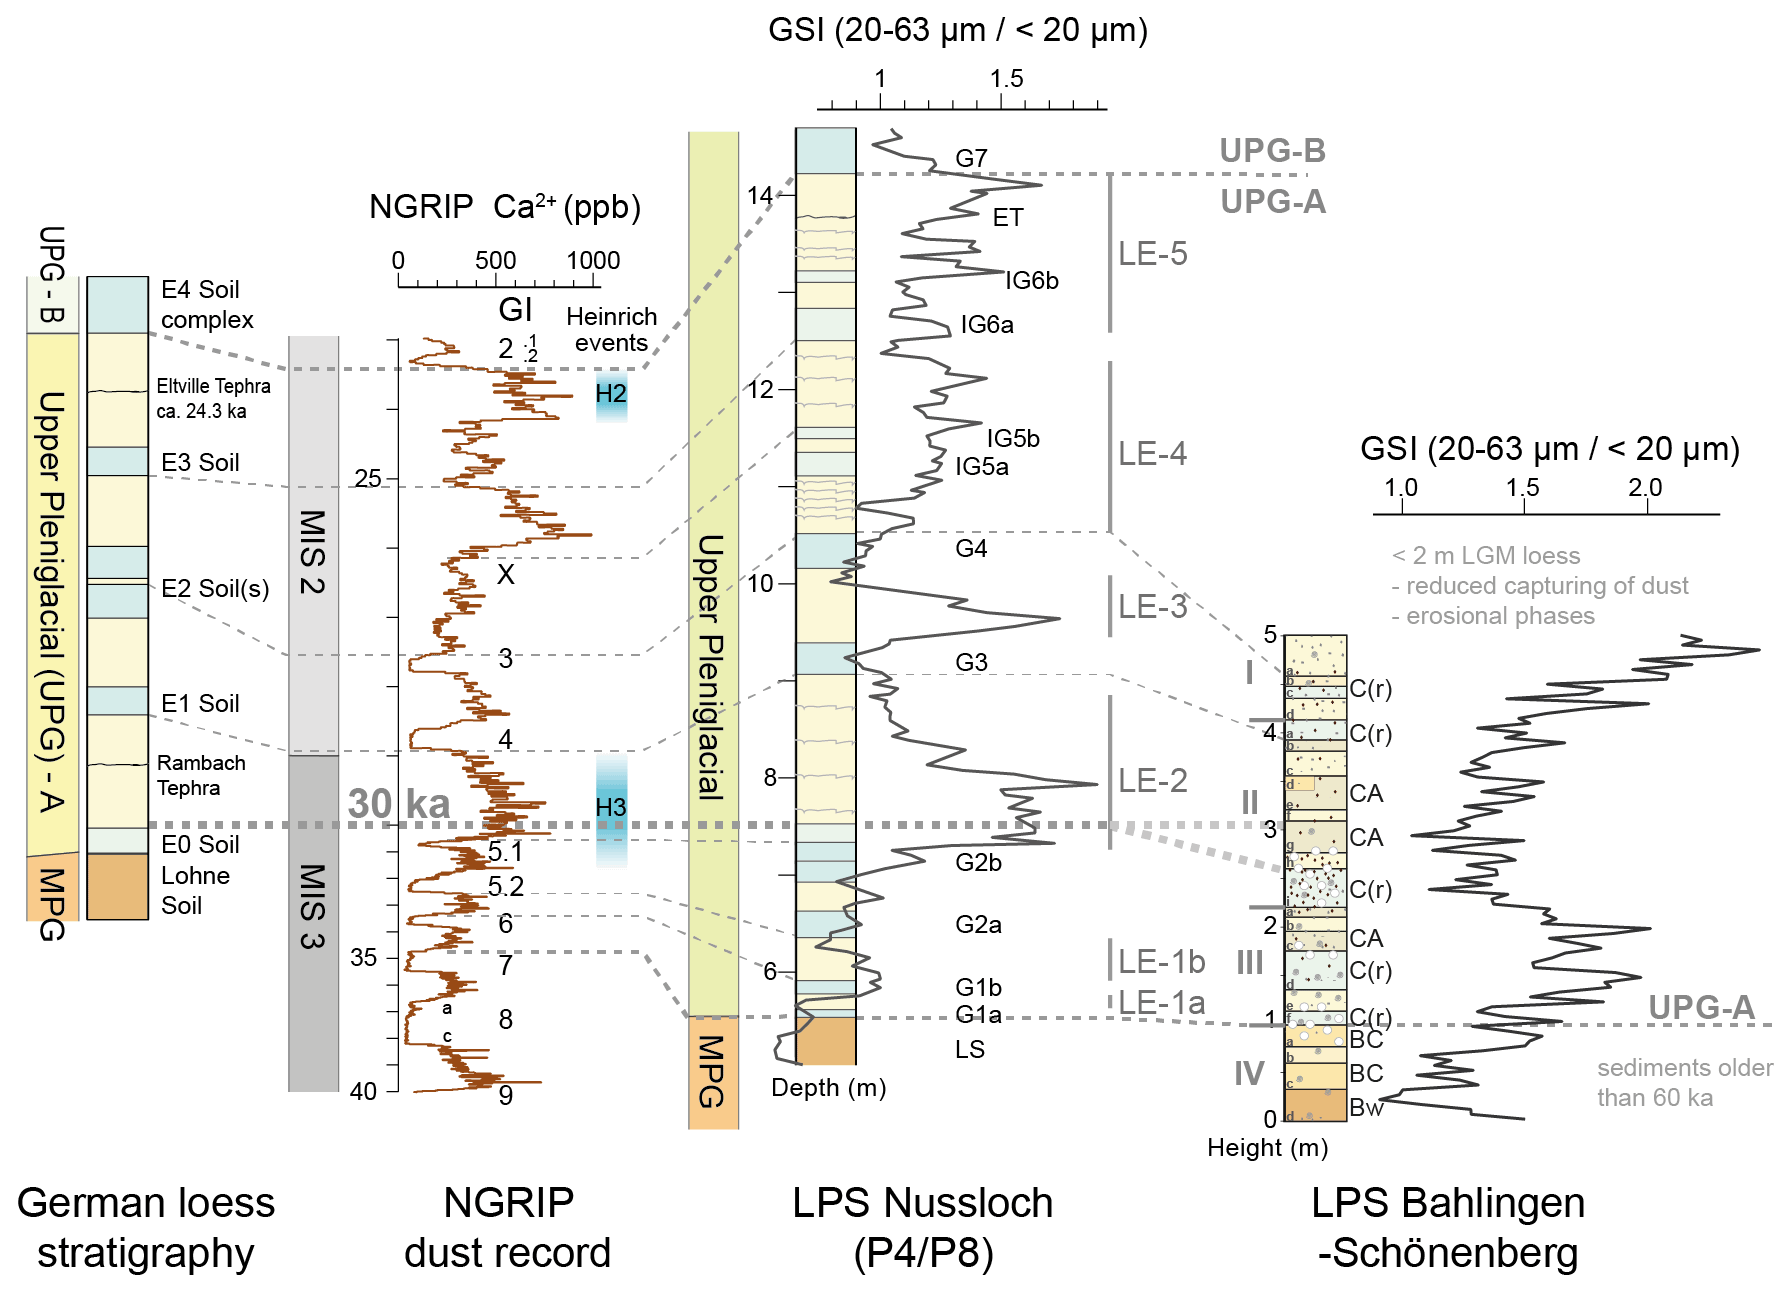
Figure 7LPS Bahlingen-Schönenberg stratigraphy and GSI record in comparison to the LPS Nussloch (Antoine et al., 2009; Moine et al., 2017), correlated to the North Greenland Ice Core Project (NGRIP) dust record from 40 to 23 ka (Rasmussen et al., 2014), and German loess stratigraphy (Lehmkuhl et al., 2016). UPG = Upper Pleniglacial; MPG = Middle Pleniglacial.
Despite the uncertainties related to different age models and the lack of information from the disturbed upper 1.5 m of the outcrop, the available age information from the LPS Bahlingen-Schönenberg clearly shows that the major period of dust deposition predates the Alpine LGM (25–24 ka). Linearly extrapolating the age models to the top of the sequence results in ages of not more than 25 ka. Hypothetically, several metres of previously deposited loess could have been removed by erosion, but our local survey along the hollow lanes did not reveal thick packages of reworked loess. Assuming that the apparent lack of deposition during and after the LGM is real, this is in a way in disagreement with the classical notion that glaciations in the upper reaches of river systems enhance silt production, fluvial and eventually aeolian transport, and deposition (Smalley et al., 2009). A possible scenario would be that during the LGM the local climate at the topographically exposed loess plateau west of Bahlingen was too cold and/or dry (polar-desert-like ecosystem) to support vegetation cover capable of capturing relevant quantities of windblown dust (Sirocko et al., 2016; Sprafke et al., 2020). The hiatus around 30 ka suggested by the pIR-200 age model may be explained in a similar way (Fig. 7), as during the time of Heinrich Event 3 very harsh environmental conditions prevailed from western to Central Europe (Starnberger et al., 2011; Fuhrmann et al., 2021). While the LPS Nussloch likely had sufficient vegetation cover during the Heinrich events and the LGM to collect thick amounts of mineral dust, recorded as loess events (Antoine et al., 2009), the LPS Krems-Wachtberg (Lower Austria) records phases of erosion and reworking attributed to polar-desert-like ecosystems (Sprafke et al., 2020). The lack of loess deposition at Bahlingen-Schönenberg during Heinrich Event 3 and the LGM may equally be explained by the local presence of polar-desert-like ecosystems during these periods.
The OSL age model suggests continuous dust deposition starting around 33 ka, without a clear effect of Heinrich Event 3 (Fig. 7). A slightly earlier onset of loess accumulation around 34–35 ka, as suggested by the pIR-200 model, is in agreement with results from the LPS Nussloch, where loess above the Lohne soil is robustly dated to ca. 35 ka (Gocke et al., 2014; Moine et al., 2017). This represents the transition from the Middle Pleniglacial to the Upper Pleniglacial of the last glacial period, corresponding to the end of Greenland Interstadial 7 (Antoine et al., 2009; Moine et al., 2017). It is possible that at Bahlingen-Schönenberg a Lohne soil equivalent has overprinted the upper part of Unit IV, below the major hiatus, but there are no data to support this assumption. The weak tundra gley soils at 1.0 to 3.5 m height could stratigraphically correspond to the G1 and G2 tundra gley soils at Nussloch that formed before 30 ka, correlative to the Erbenheim soil E0 (Lehmkuhl et al., 2016). These early Upper Pleniglacial tundra gley soils likely correspond to Greenland Interstadials 5 and 6. Taking the OSL age model into account, also the CA horizon at 3 m height may still be part of this suite of weak palaeosols; in this case we can tentatively attribute it to the very weak Greenland Interstadial 5.1 (Fig. 7).
Considerable mineral dust accumulation peaking around 34–29 ka is also reported from the LPS Möhlin (Gaar and Preusser, 2017), ca. 100 km upstream of the Rhine and the nearby Bergsee lacustrine record (Duprat-Oualid et al., 2017). There is no evidence for contemporary major glacier advances into the upstream Swiss Alpine forelands, but Alpine palaeoglacier dynamics and regional palaeoenvironments were likely favourable to contribute to downstream aeolian silt deposition. It appears that Alpine glaciers only advanced into the forelands around 30 ka (Gaar et al., 2019), apparently coinciding with Heinrich Event 3 (Starnberger et al., 2011). Interestingly, none of the dust records in the region (Bahlingen, Bergsee, Möhlin) recorded an increased dust accumulation during and after the LGM, calling for more data to unravel the regional response to the large-scale palaeoclimatic and palaeoenvironmental evolution. Yet, our results strongly support the notion that the Middle to Upper Pleniglacial transition, as recorded in Central European loess, predates the marine isotope stage (MIS) 3–2 transition (29 ka; Lisiecki and Raymo, 2005) by ca. 5000 years, as also recognised in other LPSs (Antoine et al., 2009, Terhorst et al., 2015, Lehmkuhl et al., 2016, Sprafke et al., 2020).
4.4 Upper Pleniglacial palaeoenvironments
In the classical German loess stratigraphy, originally developed in the northern part of the Upper Rhine Graben (URG; Schönhals et al., 1964; Semmel, 1967), the Upper Pleniglacial often comprises up to five well-developed tundra gleys, named Erbenheim soils after the type locality in southwestern Hesse. The Upper Pleniglacial loess record of Nussloch contains even nine tundra gley complexes of varying intensity. The absence of well-developed tundra gleys at the LPS Bahlingen-Schönenberg is striking but possibly represents a regional phenomenon as such palaeosols have so far not been reported from the southern URG (Guenther, 1987). Krauss et al. (2016) explain weakly developed tundra gleys in LPSs of the northern Harz foreland by drier palaeoclimatic conditions. At present, this region receives less than 600 mm of mean annual precipitation, compared to 600–700 mm in the northern URG and >800 mm at Nussloch (Institut für Länderkunde, 2003). Bahlingen receives >800 mm precipitation; therefore, present-day climatic conditions are no adequate reference to explain the absence of tundra gleys in the studied LPS. High dust accumulation rates equally do not explain the absence of palaeosols as the contemporary part of the LPS Nussloch is even thicker, and accumulation rates at Nussloch (1.1 mm yr−1) and Bahlingen-Schönenberg (0.8 mm yr−1) are very similar. Carbonate contents and magnetic susceptibility of the LPS Bahlingen-Schönenberg are also similar to those of the LPS Nussloch; therefore, we can largely exclude an influence of parent material differences on palaeopedogenesis. The absence of tundra gleys in the Pannonian Basin has been related to the lack of continuous permafrost in this region (Terhorst et al. 2015). However, during the Upper Pleniglacial, the Vosges (Mercier and Jeser, 2004), Black Forest (Hofmann et al., 2020), Jura (Buoncristiani and Campy, 2004), and Alps (Preusser et al., 2011) surrounding the southern URG were covered by considerable ice masses; therefore, the absence of permafrost in the area between appears rather unlikely. Yet, this specific topographic and palaeoenvironmental framework likely caused a specific regional palaeoclimate. A possible scenario to explain the absence of tundra gley soils in the Upper Pleniglacial loess of the study region could be a distinct pattern of precipitation during this period. While the missing presence of tundra gleys in the southern URG has to be confirmed, a possible explanation would be the southern advection of precipitation during the LGM, first suggested by Florineth and Schlüchter (2000) and later promoted by several other authors (e.g. Kuhlemann et al., 2008; Monegato et al., 2017; Gribenski et al., 2021). The underlying precipitation pattern would place the southern URG in a rain shadow position north of the Alps that could have been less pronounced further north. However, a robust palaeoenvironmental interpretation of pale horizons in the southern URG requires more detailed studies on this and other regionally distributed loess profiles. For the URG, a reliable pedo- and chronostratigraphic scheme of the Late Pleistocene remains to be established. For the LPS Nussloch, a clear connection of Upper Pleniglacial tundra gley soils to Greenland interstadials was possible only through a very robust age–depth model, based on radiocarbon dating of calcified earthworm casts (Moine et al., 2017).
The loess profile of Bahlingen-Schönenberg is the first LPS from the southern Upper Rhine Graben that has been investigated using a multi-method approach. While the site shows little stratigraphic differentiation and no typical response of palaeoenvironmental proxies, it covers a relatively short period of time (ca. 7000 years) at high resolution, covering the onset of the Upper Pleniglacial and the MIS 3–2 transition. IRSL screening has shown its potential as a tool that may help to quickly and cost-efficiently identify gaps in sedimentation and could be used in the future to position samples for luminescence dating more efficiently. Identifying the nature of and possible causes producing the hiatus observed in the lower part of Bahlingen-Schönenberg requires more detailed work in the surroundings. The sequence above the hiatus is characterised by weakly developed tundra gleys that are less intensely developed as tundra gleys found in the same stratigraphic position in the middle and northern part of the Upper Rhine Graben. It is here hypothesised that this could be due to drier regional climate during the time of their formation, possibly caused by the different circulation pattern over the North Atlantic and Europe that has already been deduced from the analyses of glacial features. Another interesting fact is the lack of loess dating to the LGM and the time thereafter. This could be explained either by lack of loess deposition during that time due to wind speed that is too high and/or a lack of vegetation required to fix the dust or by substantial erosion during the late glacial period and early Holocene before the area was occupied by dense vegetation. More regional palaeoenvironmental records are required to further address the above research questions in the future.
Relevant data are given either in the main text or in the supplement.
The supplement related to this article is available online at: https://doi.org/10.5194/egqsj-71-145-2022-supplement.
FP, ToS, and AF conceptualised this study. Fieldwork and most laboratory analyses were carried out by TaS and LS, under the supervision of FP, ToS, and AF. Luminescence dating was carried out by AF and magnetic susceptibility measurements by CZ. CZ calculated the age models. The original draft was prepared by ToS and FP, based on the MSc thesis written by TaS. All authors contributed by additional writing, reviewing, and editing.
At least one of the (co-)authors is a member of the editorial board of E&G Quaternary Science Journal. The peer-review process was guided by an independent editor, and the authors also have no other competing interests to declare.
Publisher’s note: Copernicus Publications remains neutral with regard to jurisdictional claims in published maps and institutional affiliations.
This article is part of the special issue “Quaternary research from and inspired by the first virtual DEUQUA conference”. It is a result of the vDEUQUA2021 online conference in September/October 2021.
The authors thank Jan-Hendrik May, University of Melbourne, for inspiring discussions regarding the concepts of landscape dynamics and sediment flux in the Upper Rhine Graben. Many thanks to Robert Peticzka, University of Vienna, for providing the spectrophotometer.
This open-access publication was funded by the University of Freiburg.
This paper was edited by Hans von Suchodoletz and reviewed by Markus Fuchs and Ludwig Zoeller.
Abdulkarim, M., Grema, H. M., Adamu, I. H., Mueller, D., Schulz, M., Ulbrich, M., Miocic, J. M., and Preusser, F.: Effect of using different chemical dispersing agents in grain size analyses of fluvial sediments via laser diffraction spectrometry, Methods and Protocols, 4, 44, https://doi.org/10.3390/mps4030044, 2021.
Anechitei-Deacu, V., Timar-Gabor, A., Constantin, D., Trandafir-Antohi, O., Valle, L. D., Fornós, J. J., Gómez-Pujol, L., and Wintle, A. G.: Assessing the maximum limit of SAR-OSL dating using quartz of different grain sizes, Geochronometria, 45, 146–159, https://doi.org/10.1515/geochr-2015-0092, 2018.
Antoine, P., Rousseau, D.-D., Zöller, L., Lang, A., Munaut, A.-V., Hatte, C., and Fontugne, M.: High-resolution record of the last Interglacial-glacial cycle in the Nussloch loess-palaeosol sequences, Upper Rhine Area, Germany, Quatern. Int., 76/77, 211–229, https://doi.org/10.1016/S1040-6182(00)00104-X, 2001.
Antoine, P., Rousseau, D.-D., Moine, O., Kunesch, S., Hatte, C., Lang, A., Tissoux, H., and Zöller, L.: Rapid and cyclic aeolian deposition during the Last Glacial in European loess: a high-resolution record from Nussloch, Germany, Quaternary Sci. Rev., 28, 2955–2973, https://doi.org/10.1016/j.quascirev.2009.08.001, 2009.
Antoine, P., Rousseau, D.-D., Degeai, J.-P., Moine, O., Lagroix, F., Kreutzer, S., Fuchs, M., Hatte, C., Gauthier, C., Svoboda, J., and Lisa, L.: High-resolution record of the environmental response to climatic variations during the Last Interglacial-Glacial cycle in Central Europe: the loess-palaeosol sequence of Dolní Vestonice (Czech Republic), Quaternary Sci. Rev., 67, 17–38, https://doi.org/10.1016/j.quascirev.2013.01.014, 2013.
Baumgart, P., Hambach, U., Meszner, S., and Faust, D.: An environmental magnetic fingerprint of periglacial loess: records of Late Pleistocene loess–palaeosol sequences from Eastern Germany, Quatern. Int., 296, 82–93, https://doi.org/10.1016/j.quaint.2012.12.021, 2013.
Begét, J. and Hawkins, D.: Influence of orbital parameters on Pleistocene loess deposition in central Alaska, Nature, 337, 151–153, https://doi.org/10.1038/337151a0, 1989.
Bengtsson, L. and Enell, M.: Chemical analysis, in: Handbook of Holocene Palaeoecology and Palaeohydrology, edited by: Berglund, B. E., John Wiley & Sons Ldt., Chichester, 423–451, ISBN 978-1-930665-80-4, 1986.
Bradák, B., Seto, Y., Stevens, T., Újvári, G., Fehér, K., and Költringer, C.: Magnetic susceptibility in the European Loess Belt: New and existing models of magnetic enhancement in loess, Palaeogeogr. Palaeoclimatol. Palaeoecol., 569, 110329, https://doi.org/10.1016/j.palaeo.2021.110329, 2021
Buoncristiani, J. F. and Campy, M.: Expansion and retreat of the Jura Ice sheet (France) during the last glacial maximum, Sediment. Geol., 165, 253–264, https://doi.org/10.1016/j.sedgeo.2003.11.007, 2004.
Buylaert, J. P., Murray, A. S., Thomsen, K. J., and Jain, M.: Testing the potential of an elevated temperature IRSL signal from K-feldspar, Radiat. Meas., 44, 560–565, https://doi.org/10.1016/j.radmeas.2009.02.007, 2009.
Chlachula, J., Evans, M. E., and Rutter, N. W.: A magnetic investigation of a Late Quaternary loess/palaeosol record in Siberia, Geophys. J. Int., 132, 128–132, https://doi.org/10.1046/j.1365-246x.1998.00399.x, 1998.
Degering, D. and Degering, A.: Change is the only constant – Time-dependent dose rates in luminescence dating, Quat. Geochronol., 58, 101074, https://doi.org/10.1016/j.quageo.2020.101074, 2020.
European Standards: DIN 18132:1995-12, Soil, testing procedures and testing equipment – Determination of water absorption, https://www.en-standard.eu/din-18132-soil-testing, last access: 1 April 2022.
Duprat-Oualid, F., Rius, D., Bégeot, C., Magny, M., Millet, L., Wulf, S., and Appelt, O.: Vegetation response to abrupt climate changes in Western Europe from 45 to 14.7k cal a BP: the Bergsee lacustrine record (Black Forest, Germany), J. Quaternary Sci., 32, 1008–1021, https://doi.org/10.1002/jqs.2972, 2017.
Ehlers, J., Gibbard, P. L., and Hughes, P. D. (Eds.): Quaternary Glaciations – Extent and Chronology – A Closer Look, in: Developments in Quaternary Sciences, Elsevier, 15, 1108 pp., ISBN 9780444534477, 2011.
Faershtein, G., Porat, N., and Matmon, A.: Natural saturation of OSL and TT-OSL signals of quartz grains from Nilotic origin, Quat. Geochronol., 49, 146–152, https://doi.org/10.1016/j.quageo.2018.04.002, 2019.
Fischer, P., Jöris, O., Fitzsimmons, K., Vinnepand, M., Prud'homme, C., Schulte, P., Hatté, C., Hambach, U., Lindauer, S., Zeeden, C., Peric, Z., Lehmkuhl, F., Wunderlich, T., Wilken, D., Schirmer, W., and Vött, A.: Millennial-scale terrestrial ecosystem responses to Upper Pleistocene climatic changes: 4D-reconstruction of the Schwalbenberg Loess-Palaeosol- Sequence (Middle Rhine Valley, Germany), Catena, 196, 104913, https://doi.org/10.1016/j.catena.2020.104913, 2021.
Florineth, D. and Schlüchter, C.: Alpine Evidence for Atmospheric Circulation Patterns in Europe during the Last Glacial Maximum, Quaternary Res., 54, 295–308, https://doi.org/10.1006/qres.2000.2169, 2000.
Fuhrmann, F., Seelos, K., and Sirocko, F.: Eolian sedimentation in central European Auel dry maar from 60 to 13 ka, Quaternary Res., 101, 4–12, https://doi.org/10.1017/qua.2020.81, 2021.
Gaar, D. and Preusser, F.: Age of the Most Extensive Glaciation of Northern Switzerland: Evidence from the scientific drilling at Möhliner Feld, E&G Quaternary Sci. J., 66, 1–5, https://doi.org/10.3285/eg.66.1.er1, 2017.
Gaar, D., Graf, H. R., and Preusser, F.: New chronological constraints on the timing of Late Pleistocene glacier advances in northern Switzerland, E&G Quaternary Sci. J., 68, 53–73, https://doi.org/10.5194/egqsj-68-53-2019, 2019.
Galbraith, R. F., Roberts, R. G., Laslett, G. M., Yoshida, H., and Olley, J. M.: Optical Dating of single and multiple Grains of Quartz from Jinmium Rock Shelter, Northern Australia: Part I, Experimental Design and Statistical Models, Archaeometry, 41, 339–364, https://doi.org/10.1111/j.1475-4754.1999.tb00987.x, 1999.
Gocke, M., Hambach, U., Eckmeier, E., Schwark, L., Zöller, L., Fuchs, M., Löscher, M., and Wiesenberg, G. L. B.: Introducing an improved multi-proxy approach for paleoenvironmental reconstruction of loess–paleosol archives applied on the Late Pleistocene Nussloch sequence (SW Germany), Palaeogeogr. Palaeocl., 410, 300–315, https://doi.org/10.1016/j.palaeo.2014.06.006, 2014.
Gribenski, N., Valla, P., Preusser, F., Roattino, T., Crouzet, C., and Buoncristiani J.-F.: Out-of-phase Late Pleistocene glacier advances in the western Alps reflect past changes in North Atlantic atmospheric circulation, Geology, 49, 1096–1101, https://doi.org/10.1130/G48688.1, 2021.
Guenther, E. W.: Sedimentpetrographische Untersuchung von Lössen – Zur Gliederung des Eiszeitalters und zur Einordnung paläolithischer Kulturen – Teil 1 Methodische Grundlagen mit Erläuterung an Profilen, Böhlau Verlag, Köln, Graz, p. 10, Reihe B, Bd. 1, 1961.
Guenther, E. W.: Zur Gliederung der Lösse des südlichen Oberrheintals, E&G Quaternary Sci. J., 37, 67–78, https://doi.org/10.3285/eg.37.1.07, 1987.
Guérin, G., Mercier, N., and Adamiec, G.: Dose-rate conversion factors: Update, Ancient TL, 29, 5–8, 2011.
Heiri, O., Lotter, A. F., and Lemcke, G.: Loss on ignition as a method for estimating organic and carbonate content in sediments: reproducibility and comparability of results, J. Paleolimnol., 25, 101–110, https://doi.org/10.1023/A:1008119611481, 2001.
Heller, F., Shen, C. D., Beer, J., Liu, X. M., Liu, T. S., Bronger, A., Suter, M., and Bonani, G.: Quantitative estimates of pedogenic ferromagnetic mineral formation in Chinese loess and palaeoclimatic implications, Earth Planet. Sc. Lett., 114, 385–390, https://doi.org/10.1016/0012-821X(93)90038-B, 1993.
Hofmann, F. M., Rauscher, F., McCreary, W., Bischoff, J.-P., and Preusser, F.: Revisiting Late Pleistocene glacier dynamics north-west of the Feldberg, southern Black Forest, Germany, E&G Quaternary Sci. J., 69, 61–87, https://doi.org/10.5194/egqsj-69-61-2020, 2020.
Huayu, L., Stevens, S., Shuangwen, Y., and Xuefeng, S.; An erosional hiatus in Chinese loess sequences revealed by closely spaced optical dating, Chinese Sci. Bull., 51, 2253–2259, https://doi.org/10.1007/s11434-006-2097-x, 2006.
Huntley, D. J. and Lamothe, M.: Ubiquity of anomalous fading in K-feldspars and the measurement and correction for it in optical dating, Can. J. Earth Sci., 38, 1093–1106, https://doi.org/10.1139/e01-013, 2001.
Institut für Länderkunde: Nationalatlas der Bundesrepublik Deutschland, Band 3 – Natur und Umwelt II: Klima, Pflanzen und Tierwelt, ISBN 978-3827409560, 2003.
Kars, R. H., Wallinga, J., and Cohen, K. M.: A new approach towards anomalous fading correction for feldspar IRSL dating – tests on samples in field saturation, Radiat. Meas., 43, 786–790, https://doi.org/10.1016/j.radmeas.2008.01.021, 2008.
Kars, R. H., Reimann, T., Ankjærgaard, C., and Wallinga, J.: Bleaching of the post-IR IRSL signal: new insights for feldspar luminescence dating, Boreas, 43, 780–791, https://doi.org/10.1111/bor.12082, 2014.
Krauss, L., Zens, J., Zeeden, C., Schulte, P., Eckmeier, E., and Lehmkuhl, F.: A Multi-Proxy Analysis of two Loess-Palaeosol Sequences in the Northern Harz Foreland, Germany, Palaeogeogr. Palaeocl., 461, 401–417, https://doi.org/10.1016/j.palaeo.2016.09.001, 2016.
Kuhlemann, J., Rohling, E. J., Krumrei, I., Kubik, P., Ivy-Ochs, S., and Kucera, M.: Regional synthesis of Mediterranean atmospheric circulation during the last glacial maximum, Science, 321, 1338–1340, https://doi.org/10.1126/science.1157638, 2008.
Lehmkuhl, F., Zens, J., Krauß, L., Schulte, P., and Kels, H.: Loess-palaeosol sequences at the northern European loess belt in Germany: Distribution, geomorphology and stratigraphy, Quaternary Sci. Rev., 153, 11–30, https://doi.org/10.1016/j.quascirev.2016.10.008, 2016.
Lehmkuhl, F., Nett, J. J., Pötter, S., Schulte, P., Sprafke, T., Jary, Z., Antoine, P., Wacha, L., Wolf, D., Zerboni, A., Hošek, J., Marković, S. B., Obreht, I., Sümergi, P., Veres, D., Zeeden, C., Boemke, B., Schaubert, V., Viehweger, J., and Hambach, U.: Loess landscapes of Europe – Mapping, geomorphology, and zonal differentiation, Earth Sci. Rev., 215, 103496, https://doi.org/10.1016/j.earscirev.2020.103496, 2021.
Li, B. and Li, S.-H.: Luminescence dating of K-feldspar from sediments: A protocol without anomalous fading correction, Quat. Geochronol., 6, 468–479, https://doi.org/10.1016/j.quageo.2011.05.001, 2011.
Lisiecki, L. E. and Raymo, M. E.: A Pliocene-Pleistocene stack of 57 globally distributed benthic d18O records, Paleoceanography, 20, PA10032005, https://doi.org/10.1029/2004PA001071, 2005.
Lowick, S. E., Preusser, F., Pini, R., and Ravazzi, C.: Underestimation of quartz OSL dating towards the Eemian: comparison with palynostratigraphy from Azzano Decimo, northeastern Italy, Quat. Geochronol., 5, 583–590, https://doi.org/10.1016/j.quageo.2009.12.003, 2010.
Ma, M., Liu, X., Pillans, B. J., Hu, S., Lü, B., and Liu, H.: Magnetic properties of Dashing Rocks loess at Timaru, South Island, New Zealand, Geophys. J. Int., 195, 75–85, doi.org/10.1093/gji/ggt206, 2013.
Makó, A., Tóth, G., Weynants, M., Rajkai, K., Hermann, T., and Tóth, B.: Pedotransfer functions for converting laser diffraction particle-size data to conventional values, Eur. J. Soil Sci., 68, 769–782, https://doi.org/10.1111/ejss.12456, 2017.
May, J.-H., Marx, S. K., Reynolds, W., Clark-Balzan, L., Jacobsen, G. E., and Preusser, F.: Establishing a chronological framework for a late Quaternary seasonal swamp in the Australian “Top End”, Quat. Geochronol., 47, 81–92, https://doi.org/10.1016/j.quageo.2018.05.010, 2018.
Mercier, J.-L. and Jeser, N.: The glacial history of the Vosges Mountains, Developments in Quaternary Science, 2, 113–118, https://doi.org/10.1016/S1571-0866(04)80061-7, 2004.
Meszner, S., Kreutzer, S., Fuchs, M., and Faust, D.: Late Pleistocene landscape dynamics in Saxony, Germany: Paleoenvironmental reconstruction using loess-palaeosol sequences, Quatern. Int., 296, 94–107, https://doi.org/10.1016/j.quaint.2012.12.040, 2013.
Meyer-Heintze, S., Sprafke, T., Schulte, P., Terhorst, B., Lomax, J., Fuchs, M., Lehmkuhl, F., Neugebauer-Maresch, C., Einwögerer, T., Händel, M., Simon, U., and Solís Castillo, B.: The MIS 3/2 transition in a new loess profile at Krems-Wachtberg East – A multi-methodological approach, Quatern. Int., 464, 370–385, https://doi.org/10.1016/j.quaint.2017.11.048, 2018.
Meyers, P. A. and Lallier-Verges, E.: Lacustrine sedimentary organic matter records of Late Quaternary paleoclimates, J. Paleolimnol., 21, 345–372, https://doi.org/10.1023/A:1008073732192, 1999.
Moine, O., Antoine, P., Hatté, C., Landais, A., Mathieu, J., Prud'homme, C., and Rousseau, D.-D.: The impact of Last Glacial climate variability in west-European loess revealed by radiocarbon dating of fossil earthworm granules, PNAS, 114, 6209–6214, https://doi.org/10.1073/pnas.1614751114, 2017.
Monegato, G., Scardia, G., Hajdas, I., Rizzini, F., and Piccin, A.: The Alpine LGM in the boreal ice-sheets game, Sci. Rep., 7, 2078, https://doi.org/10.1038/s41598-017-02148-7, 2017.
Munyikwa, K., Kinnaird, T. C., and Sanderson, D. C. W.: The potential of portable luminescence readers in geomorphological investigations: a review, Earth Surf. Proc. Land., 46, 131–150, https://doi.org/10.1002/esp.4975, 2021.
Murray, A. S. and Wintle, A. G.: Luminescence dating of quartz using an improved single-aliquot regenerative-dose protocol, Radiat. Meas., 32, 57–73, https://doi.org/10.1016/S1350-4487(99)00253-X, 2000.
Murray, A. S. and Wintle, A. G.: The single aliquot regenerative dose protocol: potential for improvements in reliability, Radiat. Meas., 37, 377–381, https://doi.org/10.1016/S1350-4487(03)00053-2, 2003.
Prescott, J. R. and Hutton, J. T.: Cosmic ray contributions to dose rates for luminescence and ESR dating: Large depths and long-term time variations, Radiat. Meas., 23, 497–500, https://doi.org/10.1016/1350-4487(94)90086-8, 1994.
Preusser, F., Ramseyer, K., and Schlüchter, C.: Characterisation of low luminescence intensity quartz from Westland, New Zealand, Radiat. Meas., 41, 871–877, https://doi.org/10.1016/j.radmeas.2006.04.019, 2006.
Preusser, F., Degering, D., Fuchs, M., Hilgers, A., Kadereit, A., Klasen, N., Krbetschek, M., Richter, D., and Spencer, J. Q. G.: Luminescence dating: basics, methods and applications, E&G Quaternary Sci. J., 57, 95–149, https://doi.org/10.3285/eg.57.1-2.5, 2008.
Preusser, F., Chithambo, M. L., Götte, T., Martini, M., Ramseyer, K., Sendezera, E. J., Susino, G. J., and Wintle A. G.: Quartz as a natural luminescence dosimeter, Earth-Sci. Rev., 97, 196–226, https://doi.org/10.1016/j.earscirev.2009.09.006, 2009.
Preusser, F., Graf, H. R., Keller, O., Krayss, E., and Schlüchter, C.: Quaternary glaciation history of northern Switzerland, E&G Quaternary Sci. J., 60, 21, https://doi.org/10.3285/eg.60.2-3.06, 2011.
Preusser, F., Muru, M., and Rosentau, A.: Comparing different post-IR IRSL approaches for the dating of Holocene foredunes from Ruhnu Island, Estonia, Geochronometria, 41, 342–351, https://doi.org/10.2478/s13386-013-0169-7, 2014.
Pye, K.: The nature, origin and accumulation of loess, Quaternary Sci. Rev., 14, 653–667, https://doi.org/10.1016/0277-3791(95)00047-X, 1995.
Rasmussen, S. O., Bigler, M., Blockley, S. P., Blunier, T., Buchardt, S. L., Clausen, H. B., Cvijanovic, I., Dahl-Jensen, D., Johnsen, S. J., Fischer, H., Gkinis, V., Guillevic, M., Hoek, W. Z., Lowe, J. J., Pedro, J B., Popp, T., Seierstadt, I. K., Steffensen, J. P., Svensson, A. M., Vallelonga, P., Vinther, B. M., Walker, M. J. C., Wheatley, J. J., and Winstrup, M.: A stratigraphic framework for abrupt climatic changes during the Last Glacial period based on three synchronized Greenland ice-core records: refining and extending the INTIMATE event stratigraphy, Quaternary Sci. Rev., 106, 14–28, https://doi.org/10.1016/j.quascirev.2014.09.007, 2014.
Richter, D., Richter, A., and Dornich, K.: Lexsyg – A new system for luminescence research, Geochronometria, 40, 220–228, https://doi.org/10.2478/s13386-013-0110-0, 2013.
Richter, D., Richter, A., and Dornich, K.: Lexsyg smart – a luminescence detection system for dosimetry, material research and dating application, Geochronometria, 42, 202–209, https://doi.org/10.1515/geochr-2015-0022, 2015.
Rittenour, T. M.: Dates and rates of earth-surface processes revealed using luminescence dating, Elements, 14, 21–26, https://doi.org/10.2138/gselements.14.1.21, 2018.
Roberts, H.: The development and application of luminescence dating to loess deposits: a perspective on the past, present and future, Boreas, 37, 483–507, https://doi.org/10.1111/j.1502-3885.2008.00057.x, 2008.
Roberts, H. M., Julie A Durcan, J. A., and Duller, G. A. T.: Exploring procedures for the rapid assessment of optically stimulated luminescence range-finder ages, Radiat. Meas., 44, 582–587, https://doi.org/10.1016/j.radmeas.2009.02.006, 2009.
Rotstein, Y. and Schaming, M.: The Upper Rhine Graben (URG) revisited: Miocene transtension and transpression account for the observed first-order structures, Tectonics, 30, TC3007, https://doi.org/10.1029/2010TC002767, 2011.
Schönhals, E., Rohdenburg, H., and Semmel, A.: Ergebnisse neuerer Untersuchungen zur Würmlöß-Gliederung in Hessen, E&G Quaternary Sci. J., 15, 199–206, https://doi.org/10.3285/eg.15.1.15, 1964.
Schulte, P., Lehmkuhl, F., Steininger, F., Loibl, D., Lockot, G., Protze, J., Fischer, P., and Stauch, G.: Influence of HCl pretreatment and organo-mineral complexes on laser diffraction measurement of loess–palaeosol-sequences, Catena, 137, 392–405, https://doi.org/10.1016/j.catena.2015.10.015, 2016.
Schulte, P., Sprafke, T., Rodrigues, L., and Fitzsimmons, K. E.: Are fixed grain size ratios useful proxies for loess sedimentation dynamics? Experiences from Remizovka, Kazakhstan, Aeolian Res., 31, 131–140, https://doi.org/10.1016/j.aeolia.2017.09.002, 2018.
Semmel, A.: Neue Fundstellen von vulkanischem Material in hessischen Lössen, Notizblatt hessisches Landesamt für Bodenforschung, 95, 10–108, 1967.
Sirocko, F., Knapp, H., Dreher, F., Förster, M. W., Albert, J., Brunck, H., Veres, D., Dietrich, S., Zech, M., Hambach, U., Röhner, M., Rudert, S., Schwibus, K., Adams, C., and Sigl, P.: The ELSA-Vegetation-Stack: Reconstruction of Landscape Evolution Zones (LEZ) from laminated Eifel maar sediments of the last 60 000 years, Global Planet. Change, 142, 108–135, https://doi.org/10.1016/j.gloplacha.2016.03.005, 2016.
Smalley, I.: Making the material: The formation of silt sized primary mineral particles for loess deposits, Quaternary Sci. Rev., 14, 645–651, https://doi.org/10.1016/0277-3791(95)00046-1, 1995.
Smalley, I. and Obreht I.: The formation of loess ground by the process of loessification: a history of the concept, Geologos, 24, 163–170, https://doi.org/10.2478/logos-2018-0015, 2018.
Smalley, I., O'Hara-Dhand, K., Wint, J., Machalett, B., Jary, Z., and Jefferson, I.: Rivers and loess: the significance of long river transportation in the complex event-sequence approach to loess deposit formation, Quatern. Int., 198, 7–18, https://doi.org/10.1016/j.quaint.2008.06.009, 2009.
Smalley, I. J., Krinsley, D. H., and Vita-Finzi C.: Observations on the Kaiserstuhl loess, Geol. Mag., 110, 29–36, https://doi.org/10.1017/S0016756800047269, 1973.
Sprafke, T.: Löss in Niederösterreich – Archiv quartärer Klima- und Landschaftsveränderungen, Würzburg University Press, 42–47, ISBN 978-3827409560, 2016.
Sprafke, T. and Obreht, I.: Loess: Rock, sediment or soil – What is missing for its definition?, Quatern. Int., 399, 198–207, https://doi.org/10.1016/j.quaint.2015.03.033, 2016.
Sprafke, T., Terhorst, B., Peticzka, R., and Thiel, C.: Paudorf locus typicus (Lower Austria) revisited: The potential of the classic loess outcrop for Middle to Late Pleistocene landscape reconstructions, E&G Quaternary Sci. J., 62, 59–72, https://doi.org/10.3285/eg.62.1.06, 2013.
Sprafke, T., Schulte, P., Meyer-Heintze, S., Händel, M., Einwögerer, T., Simon, U., Peticka, R., Schäfer, C., Lehmkuhl, F., and Terhorst, B.: Paleoenvironments from robust loess stratigraphy using high-resolution color and grain-size data of the last glacial Krems-Wachtberg record (NE Austria), Quaternary Sci. Rev., 248, 106602, https://doi.org/10.1016/j.quascirev.2020.106602, 2020.
Stahr, K., Kandeler, E., Herrmann, L. and Streck, T.: Bodenkunde und Standortlehre, 4th edn., Utb. Ulmer, Stuttgart, 327 pp., https://doi.org/10.36198/9783838553450, 2020.
Starnberger, R., Rodnight, H., and Spötl, C.: Chronology of the Last Glacial Maximum in the Salzach Palaeoglacier Area (Eastern Alps), J. Quaternary Sci., 26, 502–510, https://doi.org/10.1002/jqs.1477, 2011.
Steffen, D., Preusser, F., and Schlunegger, F.: OSL quartz age underestimation due to unstable signal components. Quat. Geochronol., 4, 353–362, https://doi.org/10.1016/j.quageo.2009.05.015, 2009.
Steup, R. and Fuchs, M.: The loess sequence at Münzenberg (Wetterau/Germany): A reinterpretation based on new luminescence dating results, Z. Geomorphol. Supp., 61, 101–120, https://doi.org/10.1127/zfg_suppl/2016/0408, 2017.
Stojakowits, P., Mayr, C., Ivy-Ochs, S., Preusser, F., Reitner, J., and Spötl, C.: Environments at the MIS 3/2 transition in the northern Alps and their foreland, Quatern. Int., 581/582, 99–113, https://doi.org/10.1016/j.quaint.2020.08.003, 2021.
Sun, D., Bloemendal, J., Rea, D.K., An, Z., Vandenberghe, J., Lu, H., Su, R., and Liu, T.: Bimodal grain-size distribution of Chinese loess, and its paleoclimatic implications, Catena, 55, 325–340. https://doi.org/10.1016/S0341-8162(03)00109-7, 2004.
Taylor, S. N. and Lagroix, F.: Magnetic anisotropy reveals the depositional and postdepositional history of a loess-paleosol sequence at Nussloch (Germany), J. Geophys. Res.-Sol. Ea., 120, 2859–2876, https://doi.org/10.1002/2014JB011803, 2015.
Terhorst, B., Sedov, S., Sprafke, T., Peticzka, R., Meyer-Heintze, S., Kühn, P., and Solleiro Rebolledo, E.: Austrian MIS 3/2 loess–palaeosol records – Key sites along a west–east transect, Palaeogeogr. Palaeocl., 418, 43–56, https://doi.org/10.1016/j.palaeo.2014.10.020, 2015.
Thomsen, K. J., Murray, A. S., Jain, M., and Bøtter-Jensen, L.: Laboratory fading rates of various luminescence signals from feldspar-rich sediment extracts, Radiat. Meas., 43, 1474–1486, https://doi.org/10.1016/j.radmeas.2008.06.002, 2008.
Viscarra Rossel, R. A., Walvoort, D. J. J., McBratney, A. B., Janik, L. J., and Skjemstad, J. O.: Visible, near infrared, mid infrared or combined diffuse reflectance spectroscopy for simultaneous assessment of various soil properties, Geoderma, 131, 59–75, https://doi.org/10.1016/j.geoderma.2005.03.007, 2006.
Vlaminck, S., Kehl, M., Rolf, C., Franz, S. O., Lauer, T., Lehndorff, E., Frechen, M., and Khormali, F.: Late Pleistocene dust dynamics and pedogenesis in Southern Eurasia - Detailed insights from the loess profile Toshan (NE Iran), Quaternary Sci. Rev., 180, 75–95, https://doi.org/10.1016/j.quascirev.2017.11.010, 2018.
Wintle, A. G.: Anomalous fading of thermoluminescence in mineral samples, Nature, 245, 143–144, https://doi.org/10.1038/245143a0, 1973.
Wright, J. S.: “Desert” loess versus “glacial” loess: quartz silt formation, source areas and sediment pathways in the formation of loess deposits, Geomorphology, 36, 231–256, https://doi.org/10.1016/S0169-555X(00)00060-X, 2001.
Yi, S., Buylaert, J-P., Murray, A. S., Lu, H., Thiel, C., and Zeng, L.: A detailed post-IR IRSL dating study of the Niuyangzigou loess site in northeastern China, Boreas, 45, 644–657, https://doi.org/10.1111/bor.12185, 2016.
Zeeden, C. and Hambach, U.: Magnetic susceptibility properties of loess from the Willendorf archaeological site: Implications for the syn/post-depositional interpretation of magnetic fabric, Front. Earth Sci., 8, 599491, https://doi.org/10.3389/feart.2020.599491, 2021.
Zeeden, C., Kels, H., Hambach, U., Schulte, P., Protze, J., Eckmeier, E., Markovic, S. B., Klasen, N., and Lehmkuhl, F.: Three climatic cycles recorded in a loess-palaeosol sequence at Semlac (Romania) – Implications for dust accumulation in south-eastern Europe, Quaternary Sci. Rev., 154, 130–142, https://doi.org/10.1016/j.quascirev.2016.11.002, 2016.
Zeeden, C., Dietze, M., and Kreutzer, S.: Discriminating luminescence age uncertainty composition for a robust Bayesian modelling, Quat. Geochronol., 43, 30–39, https://doi.org/10.1016/j.quageo.2017.10.001, 2018.
Zeeden, C., Mir, J. A., Vinnepand, M., Laag, C., Rolf, C., and Dar, R. A.: Local mineral dust transported by varying wind intensities forms the main substrate for loess in Kashmir, E&G Quaternary Sci. J., 70, 191–195, https://doi.org/10.5194/egqsj-70-191-2021, 2021.
Zhang, J.: Behavior of the electron trapping probability change in IRSL dating of K-feldspar: A dose recovery study, Quat. Geochronol., 44, 38–46, https://doi.org/10.1016/j.quageo.2017.12.001, 2018.
Zhang, J. and Li, S.-H.: Review of the Post-IR IRSL Dating Protocols of K-Feldspar, Methods and Protocols, 3, 7, https://doi.org/10.3390/mps3010007, 2020.
Zöller, L. and Wagner, G. A.: Thermoluminescence Dating of Loess – Recent Developments, Quatern. Int., 7/8, 119–128, https://doi.org/10.1016/1040-6182(90)90046-7, 1990.
Zöller, L., Stremme, H., and Wagner, G. A.: Thermolumineszenz-Datierung an Löss-Paläoboden-Sequenzen von Nieder-, Mittel- und Oberrhein/Bundesrepublik Deutschland, Chem. Geol., 73, 39–62, https://doi.org/10.1016/0168-9622(88)90020-6, 1988.
Zöller, L., Fischer, M., Jary, Z., Antoine, P., and Krawczyk, M.: Chronostratigraphic and geomorphologic challenges of last glacial loess in Poland in the light of new luminescence ages, E&G Quaternary Sci. J., 71, 59–81, https://doi.org/10.5194/egqsj-71-59-2022, 2022.