the Creative Commons Attribution 4.0 License.
the Creative Commons Attribution 4.0 License.
 | 01 Sep 2022
Two glaciers and one sedimentary sink: the competing role of the Aare and the Valais glaciers in filling an overdeepened trough inferred from provenance analysis
Michael A. Schwenk
Laura Stutenbecker
Patrick Schläfli
Dimitri Bandou
Fritz Schlunegger
Schwenk, M. A., Stutenbecker, L., Schläfli, P., Bandou, D., and Schlunegger, F.: Two glaciers and one sedimentary sink: the competing role of the Aare and the Valais glaciers in filling an overdeepened trough inferred from provenance analysis, E&G Quaternary Sci. J., 71, 163–190, https://doi.org/10.5194/egqsj-71-163-2022, 2022.
The extent and distribution of glaciers on the Swiss Plateau during the Last Glacial Maximum (LGM) can be determined from the geological record. However, similar reconstructions for the glaciations that preceded the LGM are far more difficult to be made due to the destruction of suitable sedimentary records through recurring glaciations or due to the inaccessibility of preserved records. Here, we explored Quaternary sediments that were deposited during the Marine Isotope Stage (MIS) 8 glaciation at least around 250 ka, and which were recovered in a drilling that was sunk into an overdeepened bedrock trough west of Bern (Switzerland). We analyzed the sediment bulk chemical composition of the deposits to investigate the supply of the material to the area by either the Aare Glacier, the Saane Glacier, or the Valais Glacier, and we complement this investigation with the results of heavy mineral analyses and geochemical information from detrital garnet. The potential confluence of the Valais and the Aare glaciers in the Bern area makes this location ideal for such an analysis. We determined the sediment bulk chemical signal of the various lithological units in the central Swiss Alps where the glaciers originated, which we used as endmembers for our provenance analysis. We then combined the results of this fingerprinting with the existing information on the sedimentary succession and its deposition history. This sedimentary suite is composed of two sequences, Sequence A (lower) and Sequence B (upper), both of which comprise a basal till that is overlain by lacustrine sediments. The till at the base of Sequence A was formed by the Aare Glacier. The overlying lacustrine deposits of an ice-contact lake were mainly supplied by the Aare Glacier. The basal till in Sequence B was also formed by the Aare Glacier. For the lacustrine deposits in Sequence B, the heavy mineral and garnet geochemical data indicate that the sediment was supplied by the Aare and the Saane glaciers. We use these findings for a paleogeographic reconstruction. During the time when Sequence A and the basal till in Sequence B were deposited, the Aare Glacier dominated the area. This strongly contrasts with the situation during the LGM, when the Aare Glacier was deflected by the Valais Glacier towards the northeast. The Valais Glacier was probably less extensive during MIS 8, but it was potentially present in the area, and it could have been essential for damming a lake in which the material supplied by the Aare and the Saane glaciers accumulated. In conclusion, combining provenance with sedimentological data, we could document how sediment was supplied to the investigated overdeepened basin during the MIS 8 glacial period and how glaciers were arranged in a way that was markedly different from the LGM.
Die Gletscherstände und die Verbreitung der Gletscher im Schweizer Mittelland während des letztglazialen Maximums (LGM) lassen sich aus den erhaltenen Ablagerungen und der Oberflächenmorphologie ableiten. Ähnliche Rekonstruktionen für die dem LGM vorangegangenen Vergletscherungen sind ungleich schwerer anzustellen, da entsprechende Ablagerungen durch die wiederkehrenden Gletschervorstöße zerstört wurden oder da entsprechende Sedimentsequenzen unzugänglich sind. In der vorliegenden Arbeit untersuchten wir Quartäre Sedimente, die während des marinen Isotopenstadiums (MIS) 8 abgelagert wurden. Erbohrt wurden diese Sedimente in einem übertieften Trog, der ins Molassegestein westlich von Bern (Schweiz) erodiert wurde. An diese Stelle konnte Sediment möglicherweise durch einen von drei Gletschern, den Aaregletscher, den Saanegletscher oder den Wallisergletscher transportiert werden. Um zu ermitteln, welche der Gletscher Sediment in den Trog lieferten, untersuchten wir die chemische Zusammensetzung der Ablagerungen und ergänzten diese Untersuchung mit Daten aus der Analyse der Schwermineralzusammensetzung sowie der Analyse detritischer Granate. Da hier möglicherweise der Aare– und der Wallisergletscher zusammenflossen, bietet sich die Gegend um Bern für eine solche Untersuchung an. Um den Ursprung des Sediments feststellen zu können, definierten wir verschiedene lithologische Einheiten der zentralen Schweizer Alpen, in denen die Gletscher sich bildeten, als Endglieder unserer Provenienzanalyse und bestimmten ebenfalls deren chemische Zusammensetzung. Die Ergebnisse aus der Untersuchung dieser chemischen Fingerabdrücke ergänzten wir anschließend mit den bereits vorhandenen Informationen über die Sedimentationsabfolge und deren Ablagerungsverhältnisse. In dieser Abfolge können zwei Sequenzen unterschieden werden, eine untere Sequenz A und eine obere Sequenz B. Beide Sequenzen bestehen aus einer Grundmoräne, die von lakustrischem Sediment überlagert wird. Der Aaregletscher lagerte die Moräne an der Basis der Sequenz A ab. Die Sedimente, die sich anschließend in einem Eisrandsee bildeten, wurden ebenfalls hauptsächlich vom Aaregletscher geliefert. Die basale Moräne der Sequenz B wurde ebenfalls durch den Aaregletscher gebildet. Daraufhin wurde das Seebecken mit Sediment aufgefüllt, das vermutlich durch den Aare– sowie den Saanegletscher herantransportiert wurde, wie die Schwermineralzusammensetzung und Granatgeochemie zeigen. Anhand dieser Ergebnisse erstellen wir eine paläogeographische Rekonstruktion. Es zeigt sich darin die Dominanz des Aaregletschers im Gebiet um Bern während des Ablagerungszeitraums der unteren Sequenz A sowie der Moräne an der Basis der Sequenz B. Dieses Bild der Verbreitung der Gletscher im Raum Bern steht in starkem Kontrast zur Situation während des LGM, als der Aaregletscher vom Wallisergletscher in Richtung Nordost abgedrängt wurde. Augenscheinlich war der Wallisergletscher während der MIS 8 Vergletscherung weniger weit ausgedehnt. Jedoch kann hier die vollständige Abwesenheit des Wallisergletschers nicht ausgeschlossen werden und möglicherweise war er sogar essenziell, um einen See in der Gegend um Bern aufzustauen, in welchen der Aare– und der Saanegletscher ihr mitgeführtes Material schütteten. Letztlich zeichnen die hier präsentierten Ergebnisse, eine Kombination aus Provenienzanalyse und sedimentologischen Daten, ein Bild des Sedimenttransportes in den hier untersuchten übertieften Trog während des MIS 8 Glazials, und den deutlichen Unterschied zur Gletscherverbreitung während des LGM.
- Article
(12184 KB) - Full-text XML
-
Supplement
(456 KB) - BibTeX
- EndNote


Provenance analysis is a common tool in geology used to determine the origin of sediments and sedimentary rocks, as well as to quantify the relative contribution of material from different parent rocks to the sediment mixture (Weltje and von Eynatten, 2004). Provenance analysis can be used to investigate present-day catchment-wide erosion patterns in fluvial landscapes and the human impact on them (Stutenbecker et al., 2018; Lizaga et al., 2019), and the results offer the basis to infer large-scale denudation patterns and to analyze the resulting impact on the evolution of landscapes (von Eynatten, 2003; Tatzel et al., 2017).
Provenance analysis has been applied in glacial geology, where the lithology of erratic boulders and gravel clasts in glacigenic deposits yields information on the lithologic source of the material and its geographic location. Such information can then be used to identify the motion of ice sheets and the flow patterns of glaciers during past glaciations (e.g., Kjær et al., 2003; Sandroni and Talarico, 2011; Busfield et al., 2015; Braakhekke et al., 2020). Related reconstructions are often based on components that are large enough to allow a petrographic description and the identification of their lithology. However, glacigenic deposits can be entirely composed of silt and sand, which hampers the determination of the provenance by macroscopic tools. Furthermore, the amount of material available for an analysis particularly from drill cores is very limited. In such an instance, where fine-grained glacial deposits have been recovered from a borehole, the source of the material can be determined based on its chemical composition. This has been exemplified by studies that were conducted on the partially fine-grained glacial material recovered from McMurdo Sound in Antarctica (Pompilio et al., 2007; Giorgetti et al., 2009; Sandroni and Talarico, 2011; Monien et al., 2012).
Among the various fingerprinting proxies in the field of sedimentary petrology, such as heavy mineral assemblages, bulk petrography, and geochronological parameters, the analysis of the sediment bulk chemistry provides a geochemical proxy for inferring the origin of sediments (Weltje and von Eynatten, 2004; Garzanti et al., 2012; Vermeesch and Garzanti, 2015; Stutenbecker et al., 2018, 2019). The sediment bulk chemistry is practical in provenance analyses because (i) it can be obtained efficiently so that the smallest aliquots of a sample can be measured quickly with high accuracy and reproducibility, (ii) the chemical analysis of geological samples is an established standard method for commercial applications largely independent from bias such as the operator's experience, and (iii) the statistical analysis of the resulting compositional data can be readily accomplished using various R packages designed specifically to deal with the constant-sum character of such data (Pawlowsky-Glahn and Egozcue, 2006; Vermeesch et al., 2016; Lizaga et al., 2020). Hence, the investigation of the sediment bulk chemistry can be used on large sample sets with high accuracy and swiftness, and related analyses can be utilized on fine-grained material such as glaciolacustrine deposits.
Large amounts of Quaternary glacial deposits of a widely unknown provenance are accumulated in glacially overdeepened valleys, or so-called overdeepenings, in and around the European Alps, including the central Swiss Alps (Preusser et al., 2010). Overdeepenings are bedrock troughs with their thalwegs below the present-day base level, and they can have a U-shaped cross-sectional geometry (Bandou et al., 2022). Hence, they are thought to have formed through glacial rather than fluvial erosion (Cook and Swift, 2012). After the glaciers retreated from the bedrock troughs, these local basins offered accommodation space for sediment to accumulate during glacial and interglacial periods (Buechi et al., 2017). Throughout the Quaternary, the Alpine overdeepenings were repeatedly occupied by glaciers that partially excavated the infill of the overdeepened basins, and thus the sedimentary records within the troughs probably chronicled several of the late Quaternary glaciations during the past 1 million years (Preusser et al., 2010).

Figure 1These two logs display the sedimentary succession recovered (left) in the Rehhag drill core with a ca. 40 m extension upsection based on outcrop data (Schwenk et al., 2022) and (right) in the Meikirch drill core (modified from Preusser et al., 2005). In the Rehhag sedimentary suite we focus on the drilled section and the facies assemblages (FA) 1 through 4 (Fig. 5). The inset on the bottom right shows the position of the two scientific drillings, together with the MAV–OD (black hatching). Elevation data from NASA/METI/AIST/Japan Spacesystems and U.S./Japan ASTER Science Team (2019).
Such an overdeepened valley, referred to as the Middle Aare Valley overdeepening (MAV–OD), is located in the Bern area (Swiss Plateau) on the northern side of the Alps. Recently, a scientific drill was sunk into the > 200 m deep Bümpliz trough (Rehhag drilling; WGS84: 46.9326∘ N, 7.3760∘ E), which is a lateral trough west of the main MAV–OD. The drilling recovered a 208.5 m long suite of unconsolidated sediment and an additional 3 m thick succession of Molasse bedrock at the base. Schwenk et al. (2022) reported that subglacial till and glaciolacustrine and lacustrine deposits accumulated in this trough during a glaciation between 250 and 300 ka (based on feldspar luminescence dating), which is a period that is equivalent to the global cooling during Marine Isotope Stage (MIS) 8 (Fig. 1). Although the depositional setting has been analyzed in-depth and a general chronology has been established for this succession, the provenance of these sediments and the detailed environmental history are unknown. Particularly, information about the sediment supply by glaciers to the Bern area during glaciations other than the Last Glacial Maximum (LGM) is missing, and such information would be most relevant for the reconstruction of pre-LGM glacial advances. The target region is exceptionally suitable for such reconstructions due to its position in the confluence area of the Aare and the Valais glaciers that originated in different parts of the central Swiss Alps (Bini et al., 2009; Ehlers et al., 2011). It is thus plausible that the sedimentary record in the MAV–OD chronicled the erosion and supply of material by either or both of these glaciers, which we intend to explore through this provenance study.
Here, we present the results of this analysis that we conducted on the predominantly silty and sandy Quaternary deposits encountered in the Rehhag drill core. We determined the bulk (geo-)chemical composition of the drilled sedimentary succession. We then compared the chemical composition of the cored material with the bulk chemical composition obtained from source sediment samples that we collected in tributaries of the modern Aare and Rhône rivers. This comparison built the basis for determining the provenance of the sedimentary suite encountered in the drilling. We hypothesize that changes in glacial erosion within the Aare and the Rhône valleys, where the Aare and the Valais glaciers were sourced, respectively, should be reflected in the composition of the sediment in the Bümpliz trough. Our goal is to determine the competing role of these two large Alpine glaciers on the sediment supply and on the filling of this trough. Finally, the provenance information will also be used to reconstruct the details of the paleogeography in the confluence area of the Aare and the Valais glaciers.
2.1 Sedimentological framework of the Rehhag drill core
The Quaternary succession encountered in the Rehhag drilling consists of two sedimentary packages referred to as Sequences A and B, each of which starts with a glacial till (Fig. 1; Schwenk et al., 2022). The basal facies assemblage (FA) 1.1 of Sequence A, composed of a subglacial traction till and intercalated sand layers that were deposited in subglacial conduits, is overlain by cross-bedded and steeply inclined sand, gravel, and diamictic beds referred to as FA 2 & 3. The sedimentary fabric of these latter assemblages was used to infer a deposition from density currents in a subaqueous ice-contact fan environment within a proglacial lake. Furthermore, whereas FA 2 was considered to record a backstepping of the glacier that accumulated the basal till, the overlying “flow–till” deposits of FA 3 were interpreted to indicate a readvance of the same glacier, resulting in the establishment of a proximal ice-contact fan environment (Fig. 1). The overlying Sequence B starts with an assemblage of sedimentary beds containing a subglacial till (FA 1.2), which is overlain by a fining-upward suite of turbidite layers where the bed frequency and thickness decrease upsection (FA 4). Sequence B was considered to have been deposited in a prodelta setting that gradually developed into a delta plain. Although an unconformity that is manifested in the emplacement of a basal till cutting off the underlying inclined beds separates Sequence B from the underlying Sequence A, Schwenk et al. (2022) could neither confirm nor disprove that both sequences were deposited either during two different glacial cycles or the same cycle. Finally, the uppermost deposits at the Rehhag site recorded the transition from the lacustrine setting through a paleo-base level into a fluvial environment (FA 5; Fig. 1). Furthermore, the very low organic carbon content and the absence of pollen grains in Sequence B led Schwenk et al. (2022) to conclude that the lake sediments recorded a depositional environment that was too dynamic for the accumulation of pollen and organic material.

Figure 2This map depicts the effect in which the topographic raster of the bedrock surface (Bundesamt für Landestopografie swisstopo, 2021a) is filled with water to an elevation of 580 m a.s.l. It reveals two passages through which a lake in the Aare Valley would drain. Accordingly, these passages need to be blocked to allow such a lake to form. The water level is equivalent to the elevation of the paleo-base level that was determined in the scientific drilling at the Rehhag site and inferred for the Meikirch sedimentary succession (Fig. 1; Schwenk et al., 2022). Elevation data from NASA/METI/AIST/Japan Spacesystems and U.S./Japan ASTER Science Team (2019).
Another scientific drilling was conducted in the Meikirch trough ca. 10 km north of the Rehhag drill site in the 1980s. This drilling regained attention when the yet ambiguous age assignment that resulted from a palynological investigation (Welten, 1982, 1988) was reinterpreted based on luminescence dating. The respective geochronometric investigation (Preusser et al., 2005), together with a recent reevaluation of the pollen record (Schläfli et al., 2021), uncovered that the Meikirch sedimentary succession was most likely deposited during a time interval that spans a phase of ice advance around 270 ka (MIS 8), the subsequent interglacial (MIS 7), and the following glacial period (MIS 6). Furthermore, the sedimentary suites recovered in the Rehhag and the Meikirch drillings both show a transition from a lacustrine environment into a fluvial setting, which is recorded at both locations at an elevation of ca. 580 m a.s.l. (Fig. 1). Schwenk et al. (2022) used this similarity in the development of the sequences to (i) infer the presence of a lake that formed the local base level during the late MIS 8 and to (ii) underpin the luminescence ages obtained at the Rehhag drill site. The records that inform about the extent of this inferred lake have been obscured by the repeated glacial overprinting of the region. Therefore, reconstructions of the spatial extension of this inferred lake can be perceived as speculative, yet this idea has been a long-standing one in the literature about the Quaternary deposits of the region (Gerber, 1923; Beck, 1938). Such a reconstruction of a paleo-lake, which is based on the bedrock topography map of the region by Reber and Schlunegger (2016), is displayed in Fig. 2. This reconstruction shows that two possible outflows north and west of Bern have to be considered to understand the formation of the inferred base level at that time (see “Discussion” below).
2.2 Quaternary glaciations
The European Alps and their adjacent lowlands have been repeatedly affected by glaciations throughout the Quaternary. During these glacial periods, two major ice streams referred to as the Valais and the Aare glaciers advanced into the Bern area multiple times and probably converged perpendicular to each other (Fig. 3; Bachmann, 1870; Favre, 1884; Baltzer, 1896; Schlüchter, 1989; Bini et al., 2009; Preusser et al., 2011; Jouvet et al., 2017). Both glaciers originated in a different part of the Swiss Alps. The ice of the Valais Glacier accumulated in the tributaries of the Rhône Valley in the central Swiss Alps, whereas the Aare Glacier had its sources in the Aare Valley on the northern margin of the Swiss Alps. A third rather small glacier, referred to as the Saane Glacier, originated in an isolated catchment between the Aare and the Rhône valleys on the northern margin of the Alps, and it merged with the Valais Glacier west of Bern (Fig. 3; Favre, 1884; Gilliéron, 1885; Baltzer, 1896; Bini et al., 2009; Ehlers et al., 2011; Becker et al., 2017). Accordingly, this glacier could also have supplied material to the Bümpliz trough.
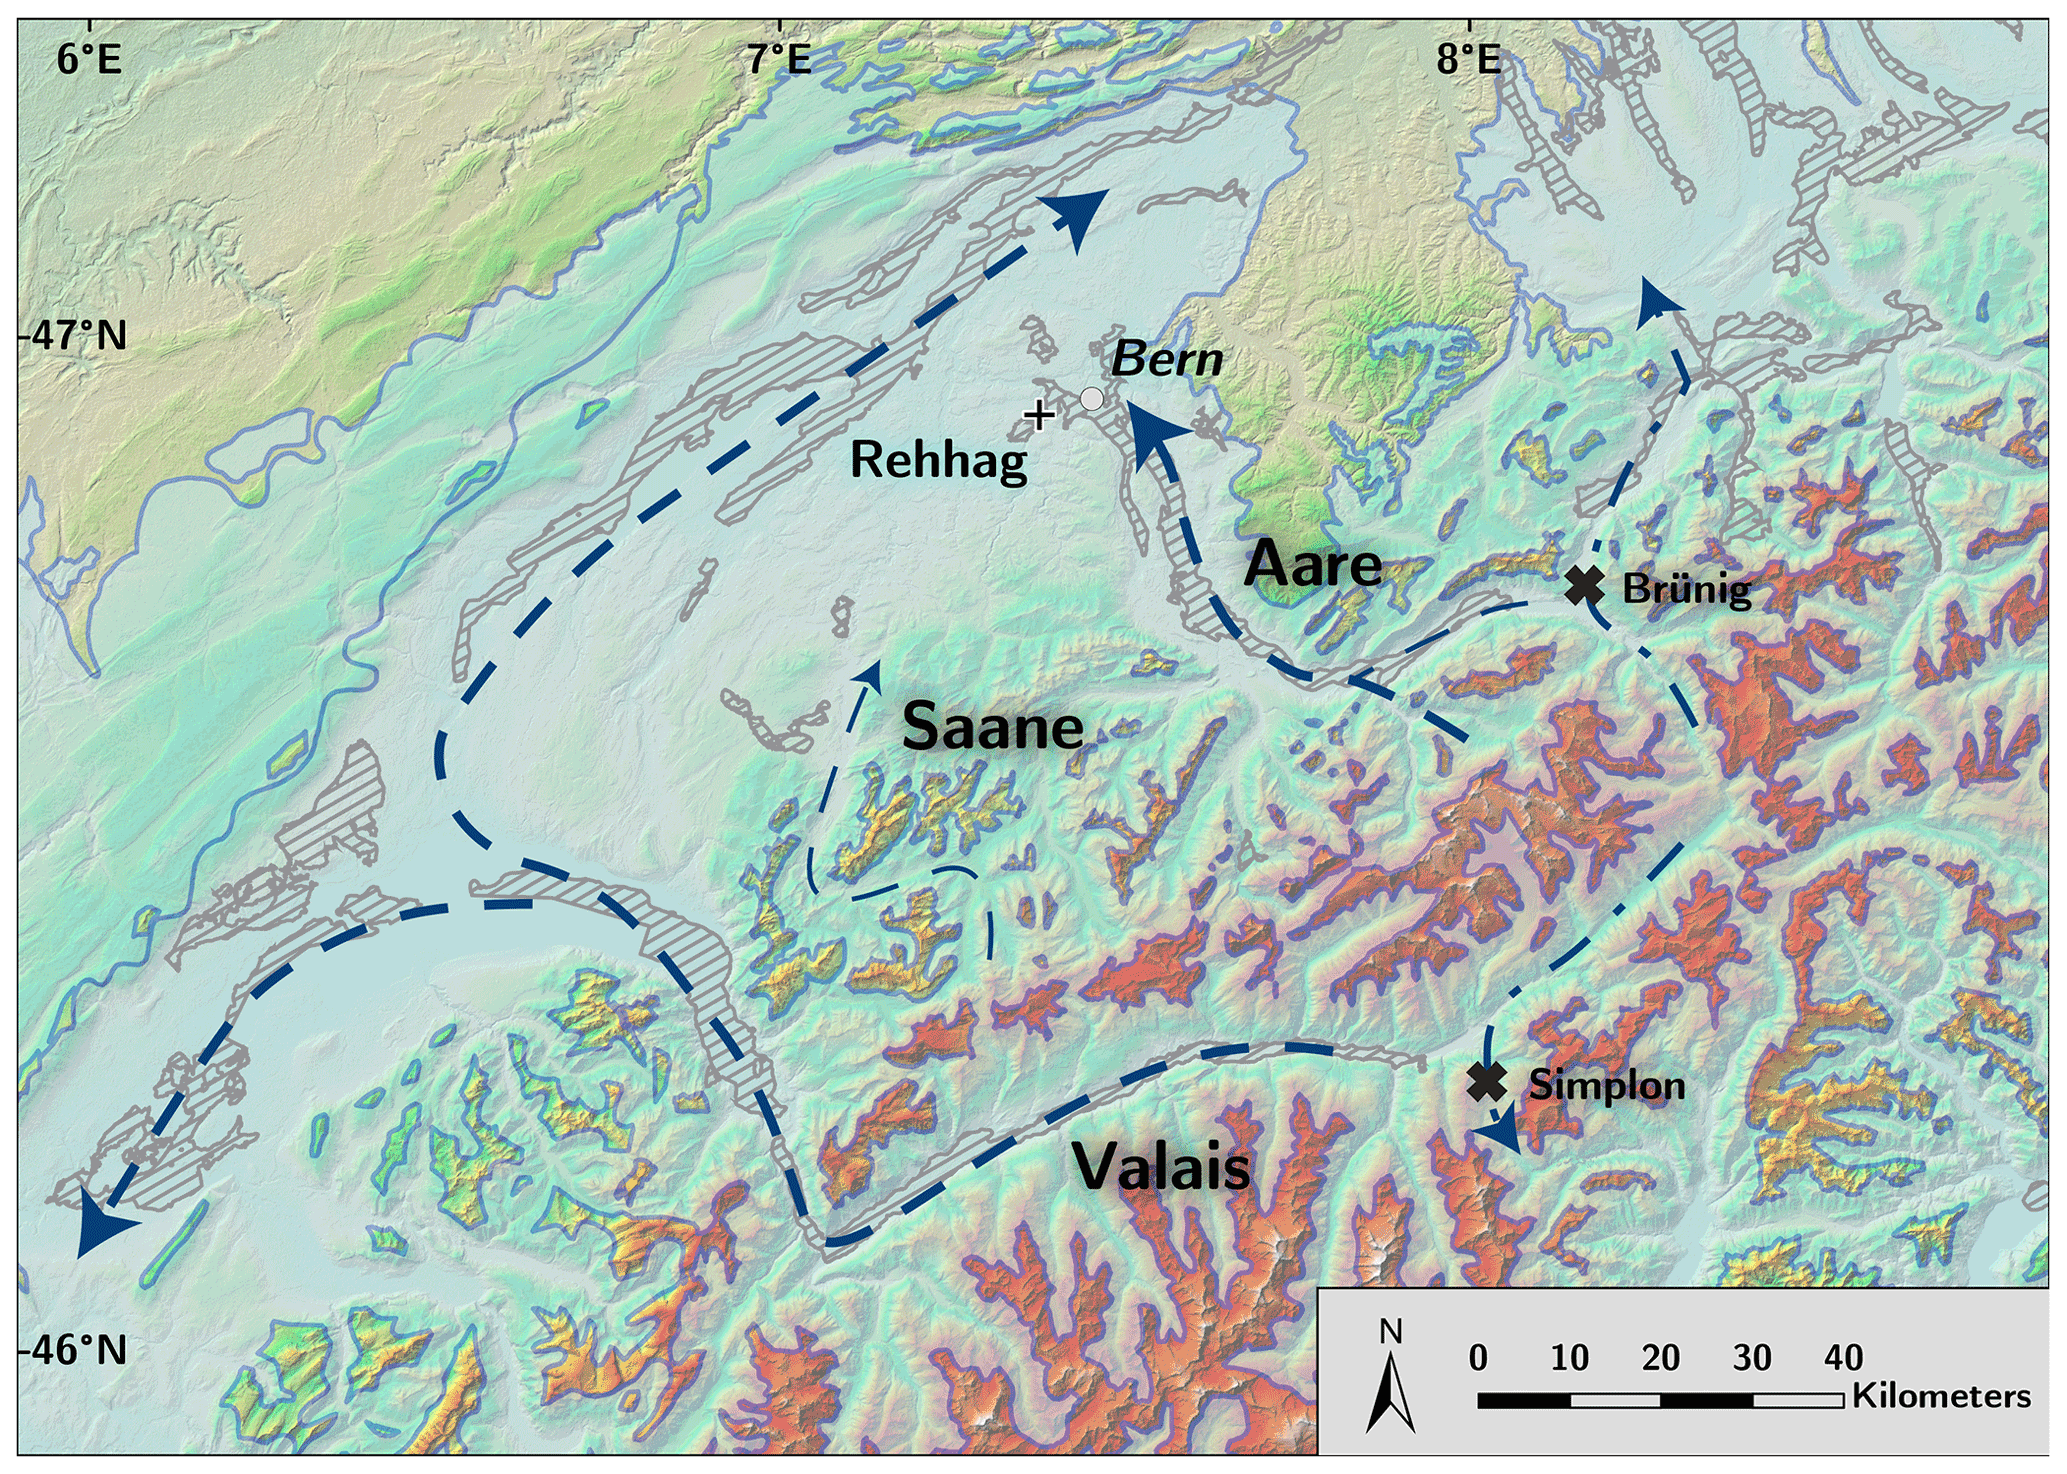
Figure 3Map of the ice cover in the central Swiss Alps and their northern lowlands during the LGM (Ehlers et al., 2011). Blue arrows indicate the flow patterns of the ice streams. Dashed lines indicate ice flow relevant for sediment transport to the Bern area. Dashed-dotted lines indicate where the ice flow diverged from the main flow (Kelly et al., 2004; Reber et al., 2014; Becker et al., 2017). The Simplon and the Brünig passes, the ice transfluences, are marked with bold crosses. Shaded grey areas indicate the position of overdeepenings in and around the central Swiss Alps (available via Bundesamt für Landestopografie swisstopo, 2021a). Elevation data from NASA/METI/AIST/Japan Spacesystems and U.S./Japan ASTER Science Team (2019).
Reconstructions of the ice distribution and the ice flow during the LGM showed that several ice transfluences existed in the central Swiss Alps (e.g., Kelly et al., 2004; Bini et al., 2009). In the Rhône and the Aare valleys such transfluences were located at the Simplon Pass (Kelly et al., 2004) and the Brünig Pass (e.g., Favre, 1884; Baltzer, 1896; Preusser et al., 2011; Reber et al., 2014), respectively (Fig. 3). In the past years, various authors have used field observations from the Swiss Alps, such as glacial landforms and erosional features, as well as the provenance of erratic boulders, to constrain computer models that calculated the ice extent and ice flow during the LGM (Becker et al., 2017; Jouvet et al., 2017; Seguinot et al., 2018). Both field observations and modeling results suggest that the Valais Glacier in the Bern area was mainly sourced from the lower western part of the Rhône Valley and that the Aare Glacier stretching towards the Bern area was originating from the northwestern part of the Bernese Alps (Fig. 3). Furthermore, these results can be used to explore the distribution of glacier ice and to infer differences in the climate conditions between glaciations, as well as glacials and interglacials (Florineth and Schlüchter, 2000; Becker et al., 2016; Reber and Schlunegger, 2016). In this context and based on the investigation of the bedrock topography in the Bern area, Reber and Schlunegger (2016) suggest that erosion in subglacial conduits below an unobstructed, i.e., free-end, Aare Glacier could effectively contribute to the formation of the MAV–OD. Hence, the aforementioned authors concluded that the Aare and the Valais glaciers were not in an LGM-like arrangement when the MAV–OD was formed and that consequently the climate at that time must have been different from the LGM climate.
2.3 Lithotectonic architecture of the Alpine source area of the target glaciers
The lithotectonic architecture of the Alps is characterized by a large variety of exposed rocks, which offers ideal conditions for allocating the source of the sediments encountered in the Rehhag drilling through fingerprinting. The history of this orogen started with the Mesozoic phase of continental spreading leading to the formation of the Valais and the Piedmont–Liguria oceans (Alpine–Tethys; Stampfli, 2000) with different sedimentary basins, and it culminated in the subsequent closure of these troughs and the following collision of the European, Iberian, and African continental plates (Schmid et al., 2004). Accordingly, in the central part of the Swiss Alps six major lithotectonic units can be distinguished which are relevant in this study. These are from north to south as follows: (i) remnants of the southern stretched margin of the European plate which are referred to as Helvetic units and which are mainly composed of limestone, (ii) the basement of the European plate made up of gneisses and metagranites, (iii) clastic rocks, referred to as flysch and calcshists that accumulated in the Valais and in the Piedmont–Liguria oceans, (iv) limestone sequences that accumulated on the Briançon terrane (part of the Iberian plate), (v) ophiolites and schists that formed in the Piedmont–Liguria ocean between the Iberian and the African plates, and (vi) the basement of the Iberian plate composed of gneisses and mica schists. The closure of these oceans, the subsequent collision of the continental plates, and the metamorphic overprinting of a large portion of the Alps resulted in a significant rearrangement of the lithotectonic units (Hänni and Pfiffner, 2001; Wissing and Pfiffner, 2002; Schmid et al., 2004). The positioning of these lithotectonic units in the source areas, as well as along the course of the Aare, the Saane, and the Valais glaciers, makes them relevant for determining the geochemical fingerprint of each of these glaciers (Fig. 4). In particular, medium-grade metamorphic basement rocks of the Iberian plate, which are referred to as the Penninic crystalline rocks, and ophiolites of the Piedmont–Liguria ocean can mainly be found on the southern flank of the western Rhône Valley and thus form a unit of parent rocks for material that was transported only by the Valais Glacier (Figs. 3 and 4). We here refer to both units as the Penninic domain for simplicity. In contrast, the clastic sedimentary units and limestones of the Valais ocean, the Briançon terrane, and the Piedmont–Liguria ocean were detached from their basement, thrust northward, and currently occur as the so-called Klippen domain on the northwestern margin of the Swiss Alps where they served as parent rocks for the material that was mainly transported by the Saane Glacier. The sedimentary limestone suites of the European margin occur as Helvetic thrust nappes, and either they are exposed on the northern flank of the Rhône Valley and thus in the source area of the Valais Glacier or they delineate the northern Alpine margin to the east of the Klippen belt. There, the Helvetic thrust nappes dominate the source area of the Aare Glacier (Figs. 3 and 4). Finally, crystalline basement rocks of the stretched margin of the European plate occur in the External massifs. These massifs are located in the upstream region of the Rhône and the Aare valleys, yet they probably served as parent rock for material that was mainly transported by the Aare Glacier due to the ice flow setting outlined above (Figs. 3 and 4). The External massifs of the Mont Blanc area (southwest Rhône Valley) probably contributed to the material transported by the Valais Glacier towards the Bern area (Favre, 1884; Baltzer, 1896; Jouvet et al., 2017). However, the fingerprint of the Mont Blanc and the Aiguilles Rouges massifs is most probably accompanied by the fingerprinting signal of the Penninic domain. Because both form a redundancy in the identification of the Valais Glacier provenance signal, we rely on the fingerprint of the Penninic domain to identify material transported by the Valais Glacier. Only small patches of the basement from the African plate are preserved as isolated klippen (Dent Blanche) on top of the Penninic unit. This unit has a very limited areal extent and is thus not relevant for the present study. Table 1 presents an overview of the relative area covered by the respective lithotectonic units in the major catchments that are relevant for this study.
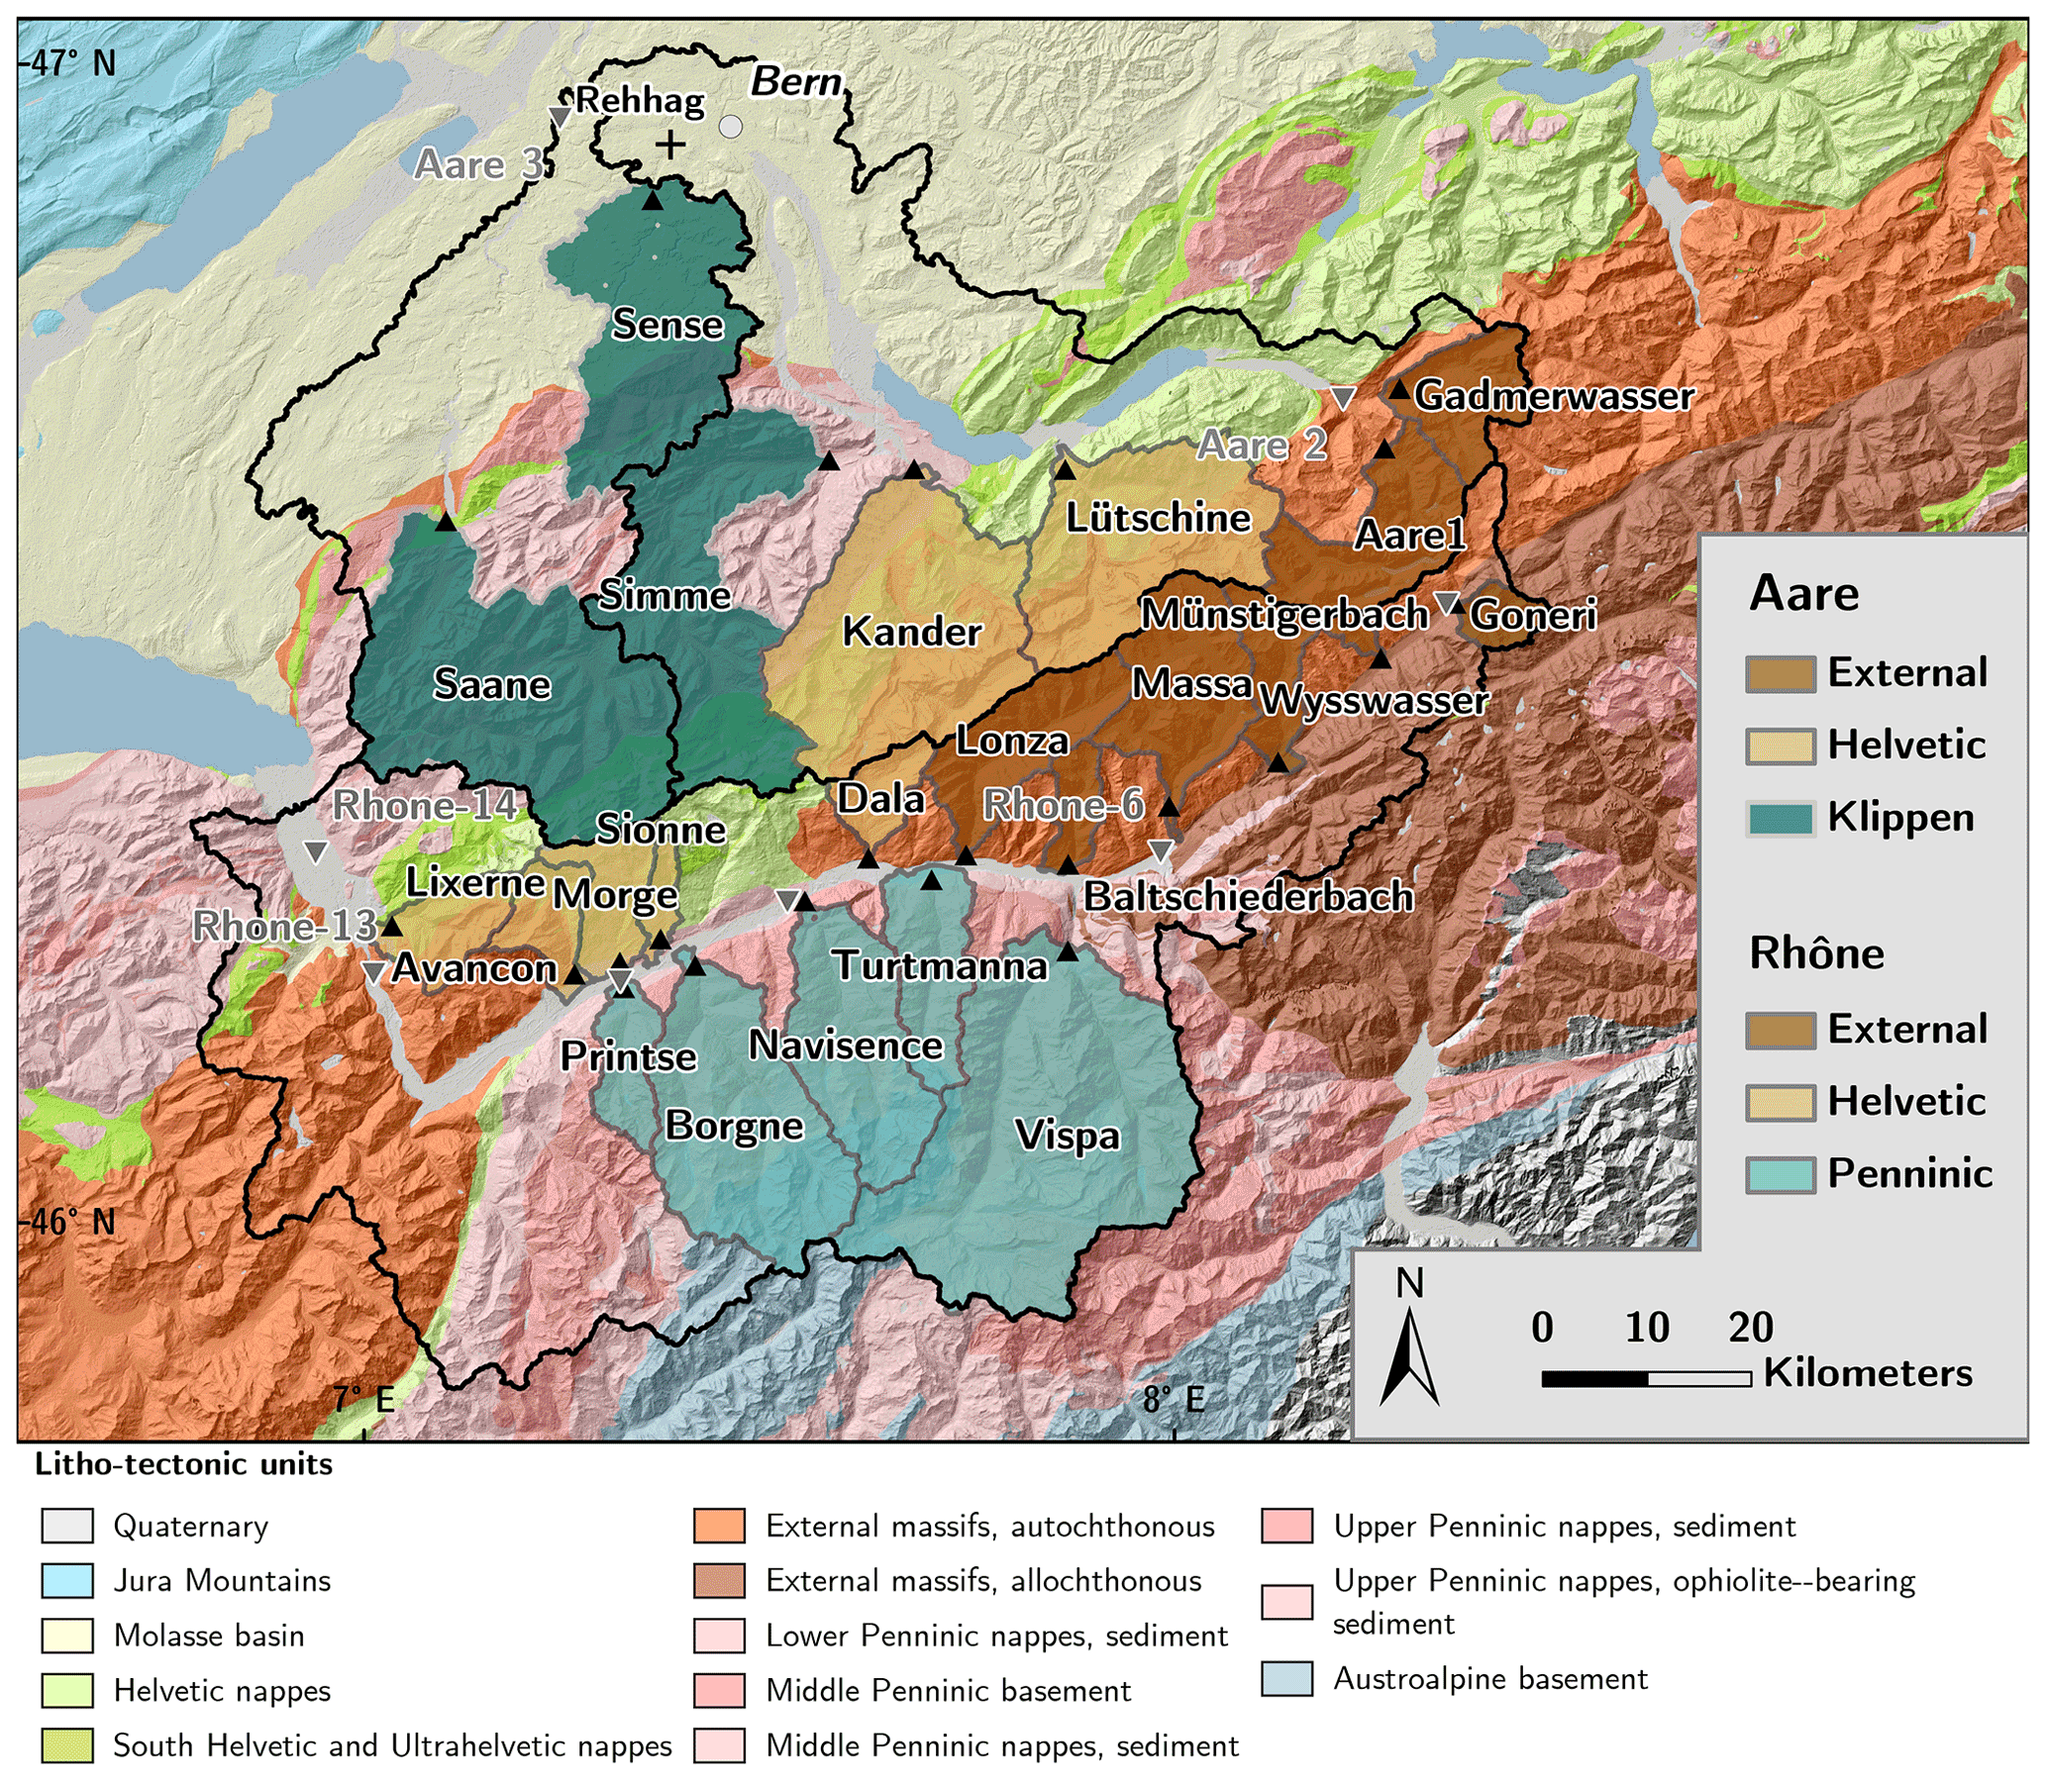
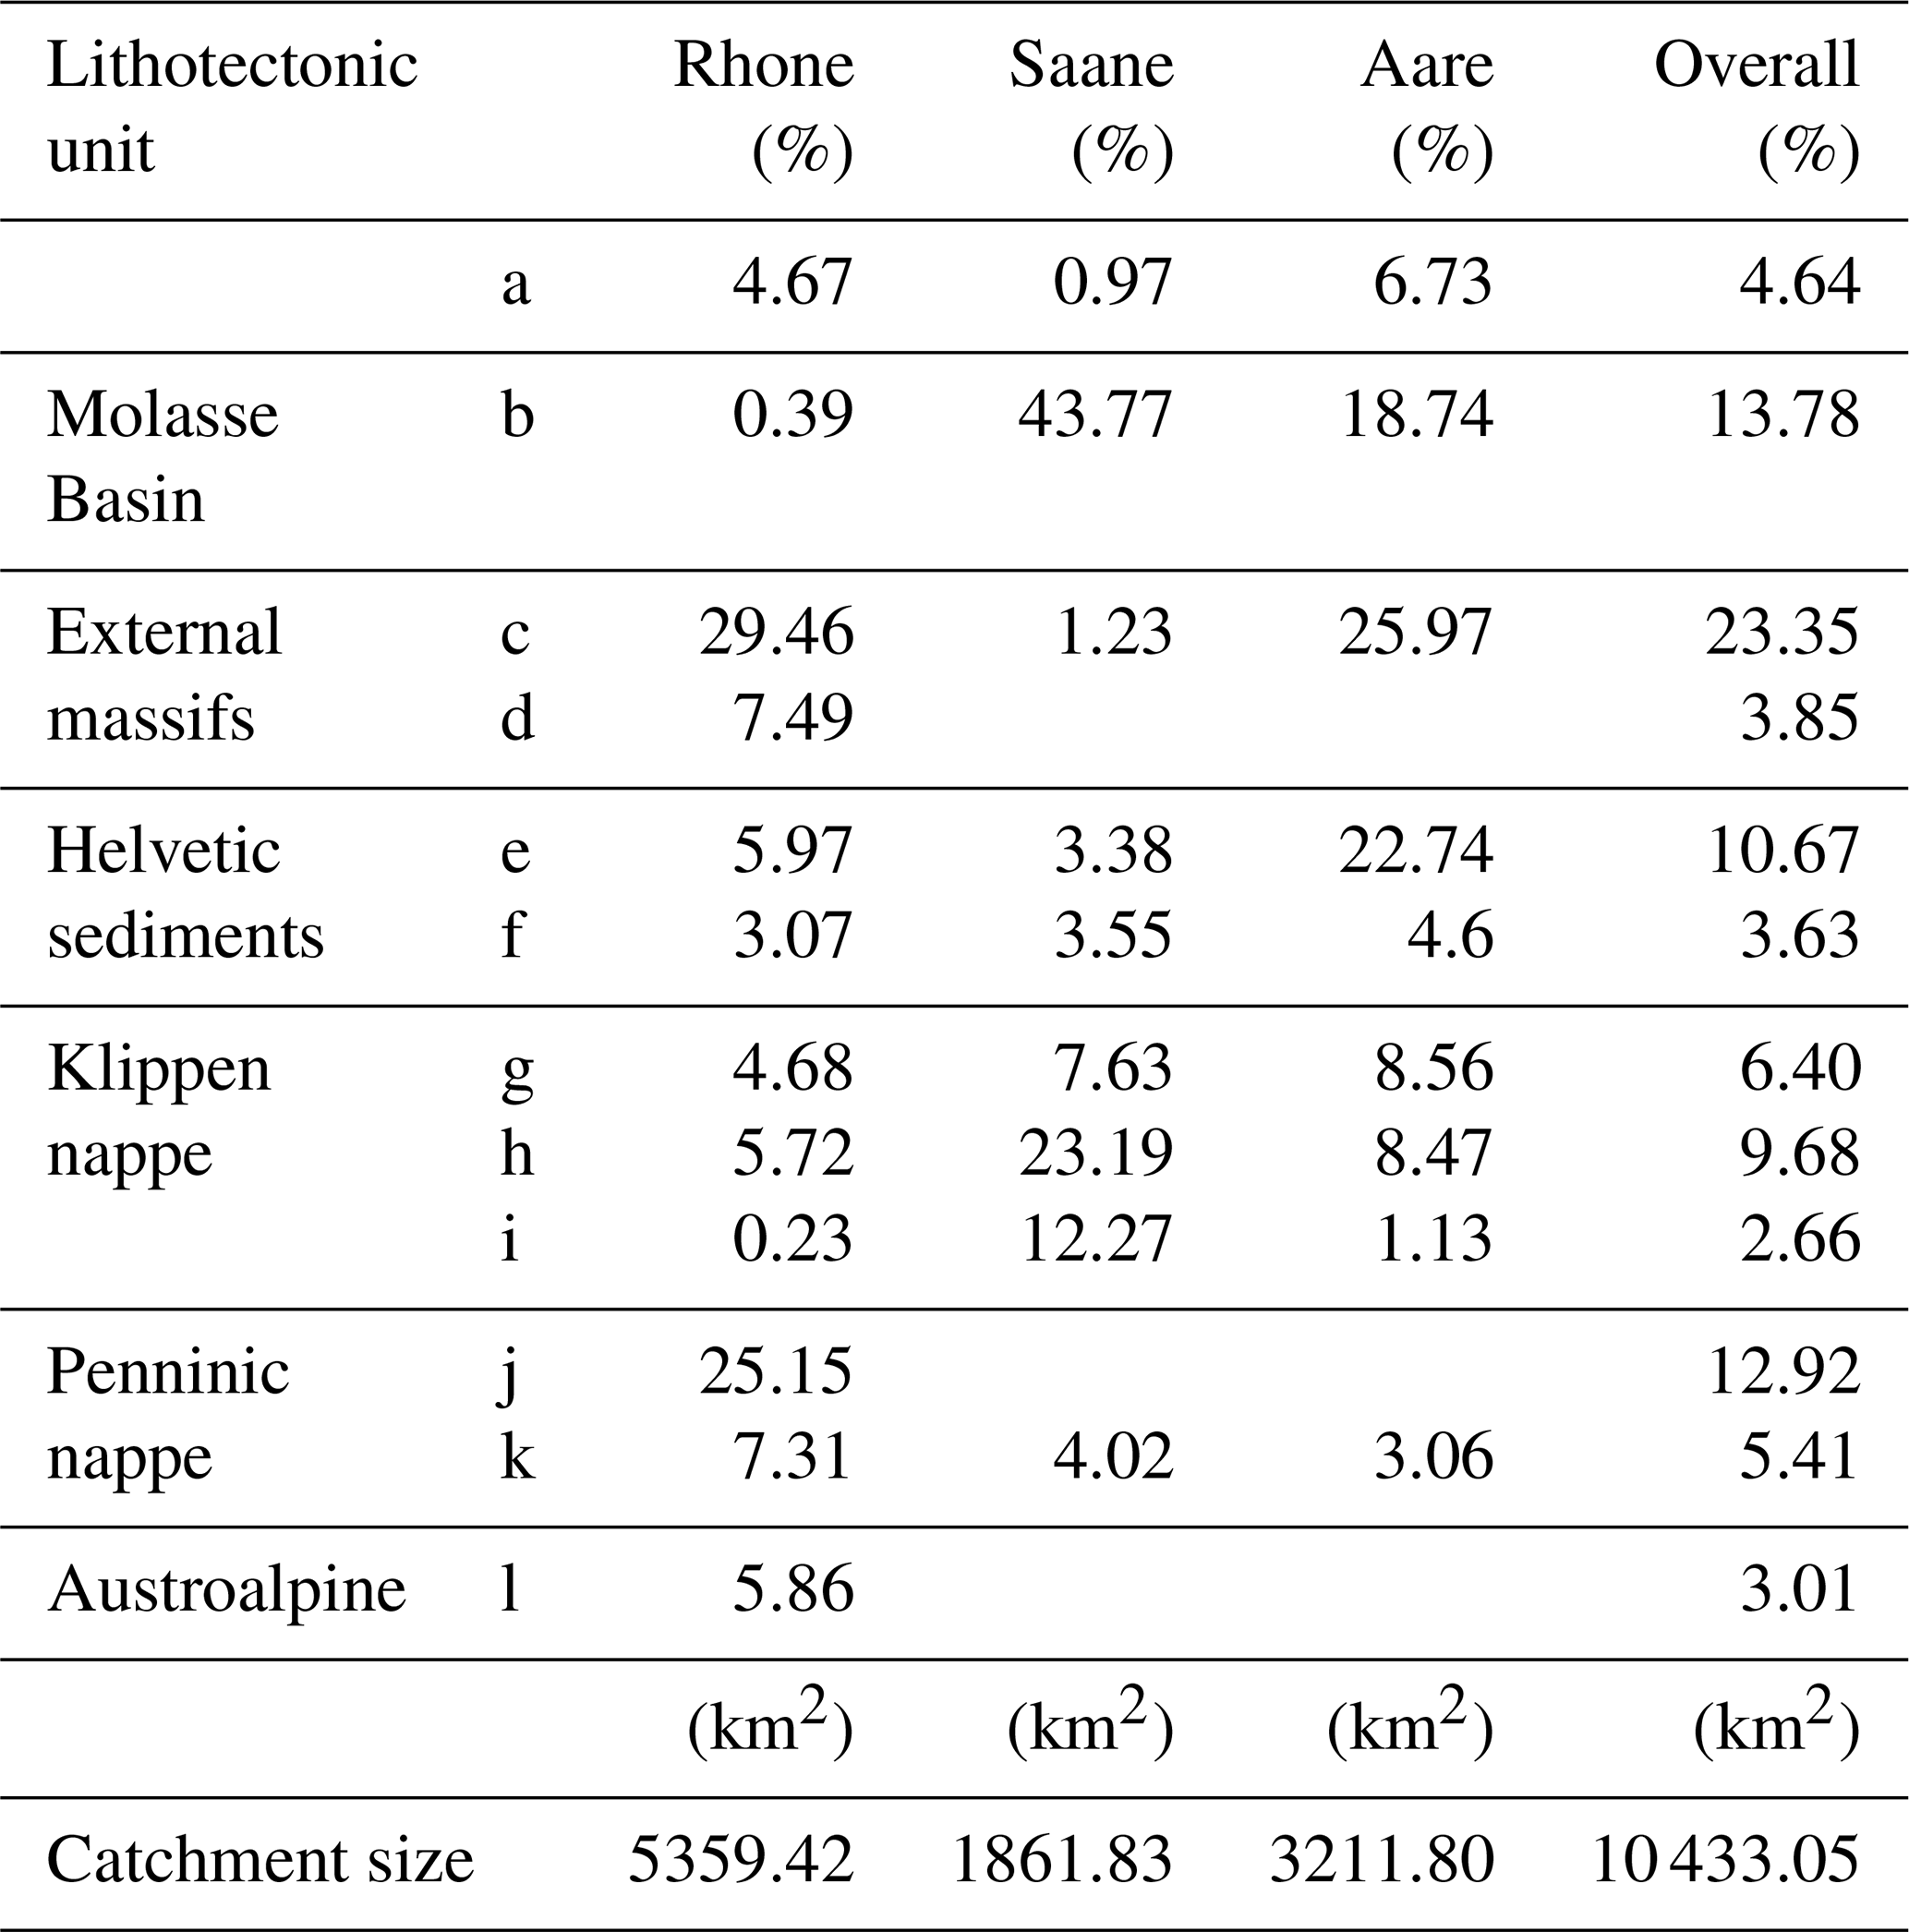
Figure 4Overview map showing the possible source lithologies for the sediment deposited at the Rehhag drill site in the Bümpliz trough. The major catchments are outlined in black, and within these the minor tributaries are colored according to their attribution to one of the four lithotectonic units. Triangles indicate the locations where samples were collected in the tributary streams (black) and in the Rhône and Aare trunk streams (grey). The location of the Rehhag drill site is marked by a cross. Rhône (Stutenbecker et al., 2018): Gon – Goneri, Mün – Münstigerbach, Wys – Wysswasser, Mas – Massa, Vis – Vispa, Bal – Baltschiederbach, Lon – Lonza, Tur – Turtmanna, Dal – Dala, Nav – Navisence, Bor – Borgne, Sio – Sionne, Mor – Morge, Pri – Printse, Lix – Lixerne, Ava – Avancon; Aare (this study): Gad – Gadmerwasser, Aa1 – Aare 1, Lue – Lütschine, Kan – Kander, Sim – Simme, Sen – Sense, San – Saane. Geological data of the official map (Institut für Geologie, Universität Bern and Bundesamt für Wasser und Geologie, 2005; Bundesamt für Landestopografie swisstopo, 2021b). Elevation data from NASA/METI/AIST/Japan Spacesystems and U.S./Japan ASTER Science Team (2019).
Table 1Overview of the major lithotectonic units and their relative areal cover of the respective catchments. Additionally, an overview of the absolute catchment sizes is provided. a – Quaternary; b – Molasse Basin; c – External massifs, autochthonous; d – External massifs, allochthonous; e – Helvetic nappes; f – South Helvetic and Ultrahelvetic nappes; g – Lower Penninic nappes, sediment; h – Middle Penninic nappes, sediment; i – Upper Penninic nappes, sediment; j – Middle Penninic basement; k – Upper Penninic nappes, ophiolite-bearing sediment; l – Austroalpine basement.
Between the Late Oligocene to Early Miocene, synorogenic Alpine detritus was transported to the northern foreland basin, including the Bern area, where it accumulated to form the clastic sediments of the Swiss Molasse (Fig. 4; e.g., Sinclair and Allen, 1992; Schlunegger et al., 1996; Strunck and Matter, 2002; von Eynatten, 2003). During glacial advances, the surface of the Molasse bedrock was heavily reshaped through subglacial erosion (e.g., Reber and Schlunegger, 2016) and consequently the Molasse provided a sediment source for material transported by both the Aare and the Valais glaciers (Table 1). Provenance tracing revealed that the rocks of Iberian, African, and Piedmont origin constituted the major sediment sources for the Molasse sequences that were deposited in the Bern area (Spiegel et al., 2000, 2001, 2002; von Eynatten, 2003). In contrast, material from the European External massifs was supplied to the Molasse Basin only after their exhumation around 14 Ma (Stutenbecker et al., 2019; Anfinson et al., 2020). Therefore, material derived from the External massifs is absent in the Molasse sequences in the Bern area. The Rhône catchment was separated from the Rhine–Aare system during the latest stage of the Alpine orogeny in the Late Pliocene (ca. 2.9 Ma; Berger et al., 2005; Ziegler and Fraefel, 2009). Since then, material from the Rhône Valley cannot be supplied to the Bern area by fluvial transport, yet a material supply by glaciers (Valais Glacier) did occur during glacial periods (Graf et al., 2015; Jouvet et al., 2017).
3.1 Sample collection, preparation, and geochemical analysis
As outlined above, the sedimentary succession in the overdeepened Bümpliz trough is composed of glacial deposits that could have been supplied by one or multiple glaciers, namely the Valais, the Saane, and the Aare glaciers (Fig. 3). These glaciers are expected to have transported material of markedly different composition with distinct bulk chemical signals, which depends on the lithotectonic units (Penninic, Klippen, External, Helvetic) that constitute the parent rocks in the respective source areas. In order to quantify the contribution of the four source units to the Bümpliz sedimentary succession, their chemical fingerprints were established in a first step. We benefited from the availability of a sediment bulk chemistry data set obtained by Stutenbecker et al. (2018) from modern stream samples collected in 16 tributary basins in the Rhône Valley (Fig. 4), which provides an endmember fingerprint of the Valais Glacier. We complemented this data set by collecting riverine material in seven tributaries (Gadmerwasser, Aare 1, Lütschine, Kander, Simme, Sense, and Saane) on the northern side of the Alps to characterize the geochemical fingerprinting signals of the Aare and the Saane glaciers (Fig. 4). We followed closely the sampling strategy of Stutenbecker et al. (2018) to ensure the comparability of our results. In particular, the employed sampling strategy is a tributary sampling approach which relies on the natural mixture of sediment within a tributary and which is tailored towards determining the large-scale provenance of sedimentary material (Garzanti et al., 2012; Vale et al., 2016; Stutenbecker et al., 2018). Thus, this sampling strategy does not yield fingerprints of individual lithologies but allows the combined fingerprint of all lithologies in a tributary to be assessed. Accordingly, the target catchments were chosen such that the bedrock in the respective area consists predominantly of one main lithotectonic unit (Fig. 4). As a second step, we extracted samples from the Rehhag core in intervals < 5 m, yielding a total of 52 samples (Table 2). These 52 core samples, together with the seven riverine samples from the northern part of the Alps, were prepared for the measurement of their sediment bulk chemical composition. The samples were wet-sieved to extract the grain size fraction < 63 µm in accordance with Stutenbecker et al. (2018). Subsequently we also followed the aforementioned authors in the sample analysis to ensure comparability with their data set. The dried samples were analyzed in a whole-rock procedure using a lithium borate fusion coupled with an ICP–ES (inductively coupled plasma emission spectrometer) at Bureau Veritas (Canada). The content of the oxides SiO2, Al2O3, Fe2O3, MgO, CaO, Na2O, K2O, TiO2, P2O5, MnO, and Cr2O3, as well as of the elements Ba, Ni, Sr, Zr, Y, Nb, and Sc, was measured. The results were corrected for the loss on ignition (LOI). The relative contribution from the four source units (Penninic, Klippen, External, Helvetic) to each of the core samples was determined using the respective fingerprints.
Table 2The names of all samples collected from the drill core, the according depth along the drill core, and the final set of unmixing results. Please note that the core number and the derived sample names are not exactly equivalent to the depth in the drilling because individual core sections were drilled in 0.5 m intervals. The unmixing results were calculated by the fingerPro unmix() function. For every sample, the proportion of sediment derived from the respective lithotectonic unit is provided along with the goodness of fit (GOF). These results were plotted to facilitate the comparison with the sedimentary log; see Figs. 5 and 7.

3.2 Data analysis and unmixing model
The data were analyzed with the software environment R (v4.1.1; R Core Team, 2022). We used standard packages, as well as the packages fingerPro (v1.1; Lizaga et al., 2020) and provenance (v4.0; Vermeesch et al., 2016), that were written for the use in provenance analyses. An R script was written to ensure the reproducibility of the results and of each analytical step.
Each of the core samples had to be investigated in the context of all riverine samples to determine the changes in the sediment provenance throughout the cored succession.
Thus, 52 temporary processing data sets were automatically aggregated
from the data sets of the riverine and the core samples. Each of the processing data sets contained the data on the bulk chemical composition of the 23 riverine samples and 1 core sample. The provenance analysis was then performed on each of the 52 individual processing data sets, and
the results were combined into a final overview to reveal trends in the sediment composition.
We used two approaches to prepare the 52 processing data sets and to assess how the selection of variables influences the discrimination between potential source areas. As a first approach, we determined an optimum selection of variables (i.e., oxides and elements) for each processing data set that allows the parent rock domains to be discriminated best. This was achieved through a standard statistical procedure that applies the conservation criterion for each variable, an H test following Kruskal–Wallis (Kruskal and Wallis, 1952), and a stepwise linear discrimination analysis (LDA; e.g., Stutenbecker et al., 2018; Lizaga et al., 2020). This approach yielded a provenance result in one run, and the result is tailored towards each individual core sample. As a second approach, we first determined the variables from the riverine data sets that allowed us to best discriminate between the possible source signals before we explored how different combinations of these source signals could explain the bulk chemical composition of the core samples. In contrast to the first approach, a stepwise LDA was performed on the data from all tributaries (i.e., without the core samples) to identify and remove dispensable variables. Additionally, data of individual tributaries were removed if they were recognized as potential outliers in the respective group of source rocks. These outliers were identified in the PCA (principal component analysis) biplots which were generated for a visual assessment of the data. The data were converted with a centered log-ratio transformation before the PCA. This was a reiterative approach, and a variety of provenance analyses were conducted in different runs.
The processing data sets that resulted from either approach were finally analyzed with the fingerPro unmix() function (Lizaga et al., 2020). This function determines the contribution of the potential parent rock groups to the relative composition of each core sample.
The function applies the following linear multivariate mixing model:
where bi is the observed relative contribution of one variable i (e.g., SiO2; i=1 to n) to the sediment mixture (i.e., a core sample), ai,j is the observation of the variable i in the source type j (e.g., Helvetic; j=1 to m), ωj is the unknown relative contribution of the source type j to the sediment mixture, m is the number of sediment sources (i.e., Helvetic, External, Penninic, and Klippen), and n is the number of observed variables that are allowed in the unmixing procedure (i.e., sediment bulk chemistry measurements). The results of the respective runs were exported to spread sheets and plotted for visual comparison. The unmixing results were plotted in a downhole log in a final step. The unmix() function calculates the goodness of fit (GOF) to evaluate the unmixing results and to return the best unmixing solution. An average GOF was determined for each of the 52 processing data sets, and these averages vary with the number of input variables and catchments. Thus, we compared the average GOF of the different runs to evaluate how well the unmixing performed. The final unmixing results were compiled according to the sample position within the stratigraphic succession, and the respective mean values and their standard deviation were calculated.
3.3 Elemental correlations
We additionally used the carbon–nitrogen–sulfur (CNS) data, namely the carbonate content derived from the total inorganic carbon (TIC) and the total organic carbon (TOC) content, as well as the material magnetic susceptibility (MS) data presented in Schwenk et al. (2022). Note that the respective data are available in Schwenk et al. (2021). The unmixing results were then compared to these data to investigate possible correlations. Furthermore, we plotted ratios of measured compounds and elements to facilitate the interpretation of the unmixing results. Additionally, we added the CNS and the multi-sensor core logger (MSCL) data to explore possible correlations with the unmixing results. We selected those compound ratios that were considered by von Eynatten (2003) as diagnostic for fingerprinting the potential sources of Alpine Molasse sediments. According to von Eynatten (2003), the following ratios can be correlated to different parent rock groups: (i) Cr2O3:Ba and Ni:Ba, which allow sources situated in ultramafic rocks to be identified (i.e., ophiolites in the Penninic); (ii) Na2O:SiO2, which correlates with the input of material from granitoid source rocks; (iii) MgO:SiO2, which correlates with the relative contribution of material from dolomitic source rocks; and (iv) the Cr2O3:Ni ratio, in which a high value (up to 16), caused by the stable and therefore relatively enriched heavy mineral Cr spinel, reflects a flysch source rock component, and in which lower values between 1.2 and 3.5 indicate first-cycle sources in the Penninic domain. We additionally considered the CaO:SiO2 ratio to investigate possible correlations between the results of the ICP–ES measurements and the TIC-derived carbonate contents. We displayed the data in scatter plots to visually assess the correlation between the four components of the unmixing results and the respective compound ratios. Furthermore, we compared the SiO2:Al2O3 ratio to the amplitude of the MS measurements because they are positively correlated to larger grain sizes in the sediment (Weltje and von Eynatten, 2004). Finally, we considered the TOC content in the sedimentary succession because TOC values between 0.1 % and 0.6 % indicate low production rates of autochthonous organic material and point towards a detrital supply of the organic material (Meyers and Teranes, 2001; Larsen et al., 2011).
3.4 Heavy mineral analysis
In addition to the geochemical analysis of the mostly fine-grained sediment fraction, we conducted a heavy mineral analysis on selected samples from the sandy intervals of the drill core. Heavy mineral analysis was used extensively on Pleistocene sediments and their Mesozoic to Cenozoic sedimentary bedrock in the Swiss Alpine foreland, thus providing a large database for comparison (e.g., Gasser and Nabholz, 1969; Schlunegger et al., 1993; von Eynatten, 2003). In the Pleistocene in particular, heavy mineral spectra have been used to infer the provenance of glaciofluvial deposits (Graf, 1993). However, the heavy mineral spectra supplied by the Aare and the Valais glaciers are very similar, with the only difference of blue sodic amphibole (glaucophane) commonly being attributed to the Valais Glacier source region and titanite being attributed to the Aare Glacier source region. Titanite, however, also occurs in the source area of the Valais Glacier (Stutenbecker et al., 2018). The important contribution of Molasse recycling from the underlying bedrock is further impeding the assignment of heavy minerals to specific source regions (Gasser and Nabholz, 1969).
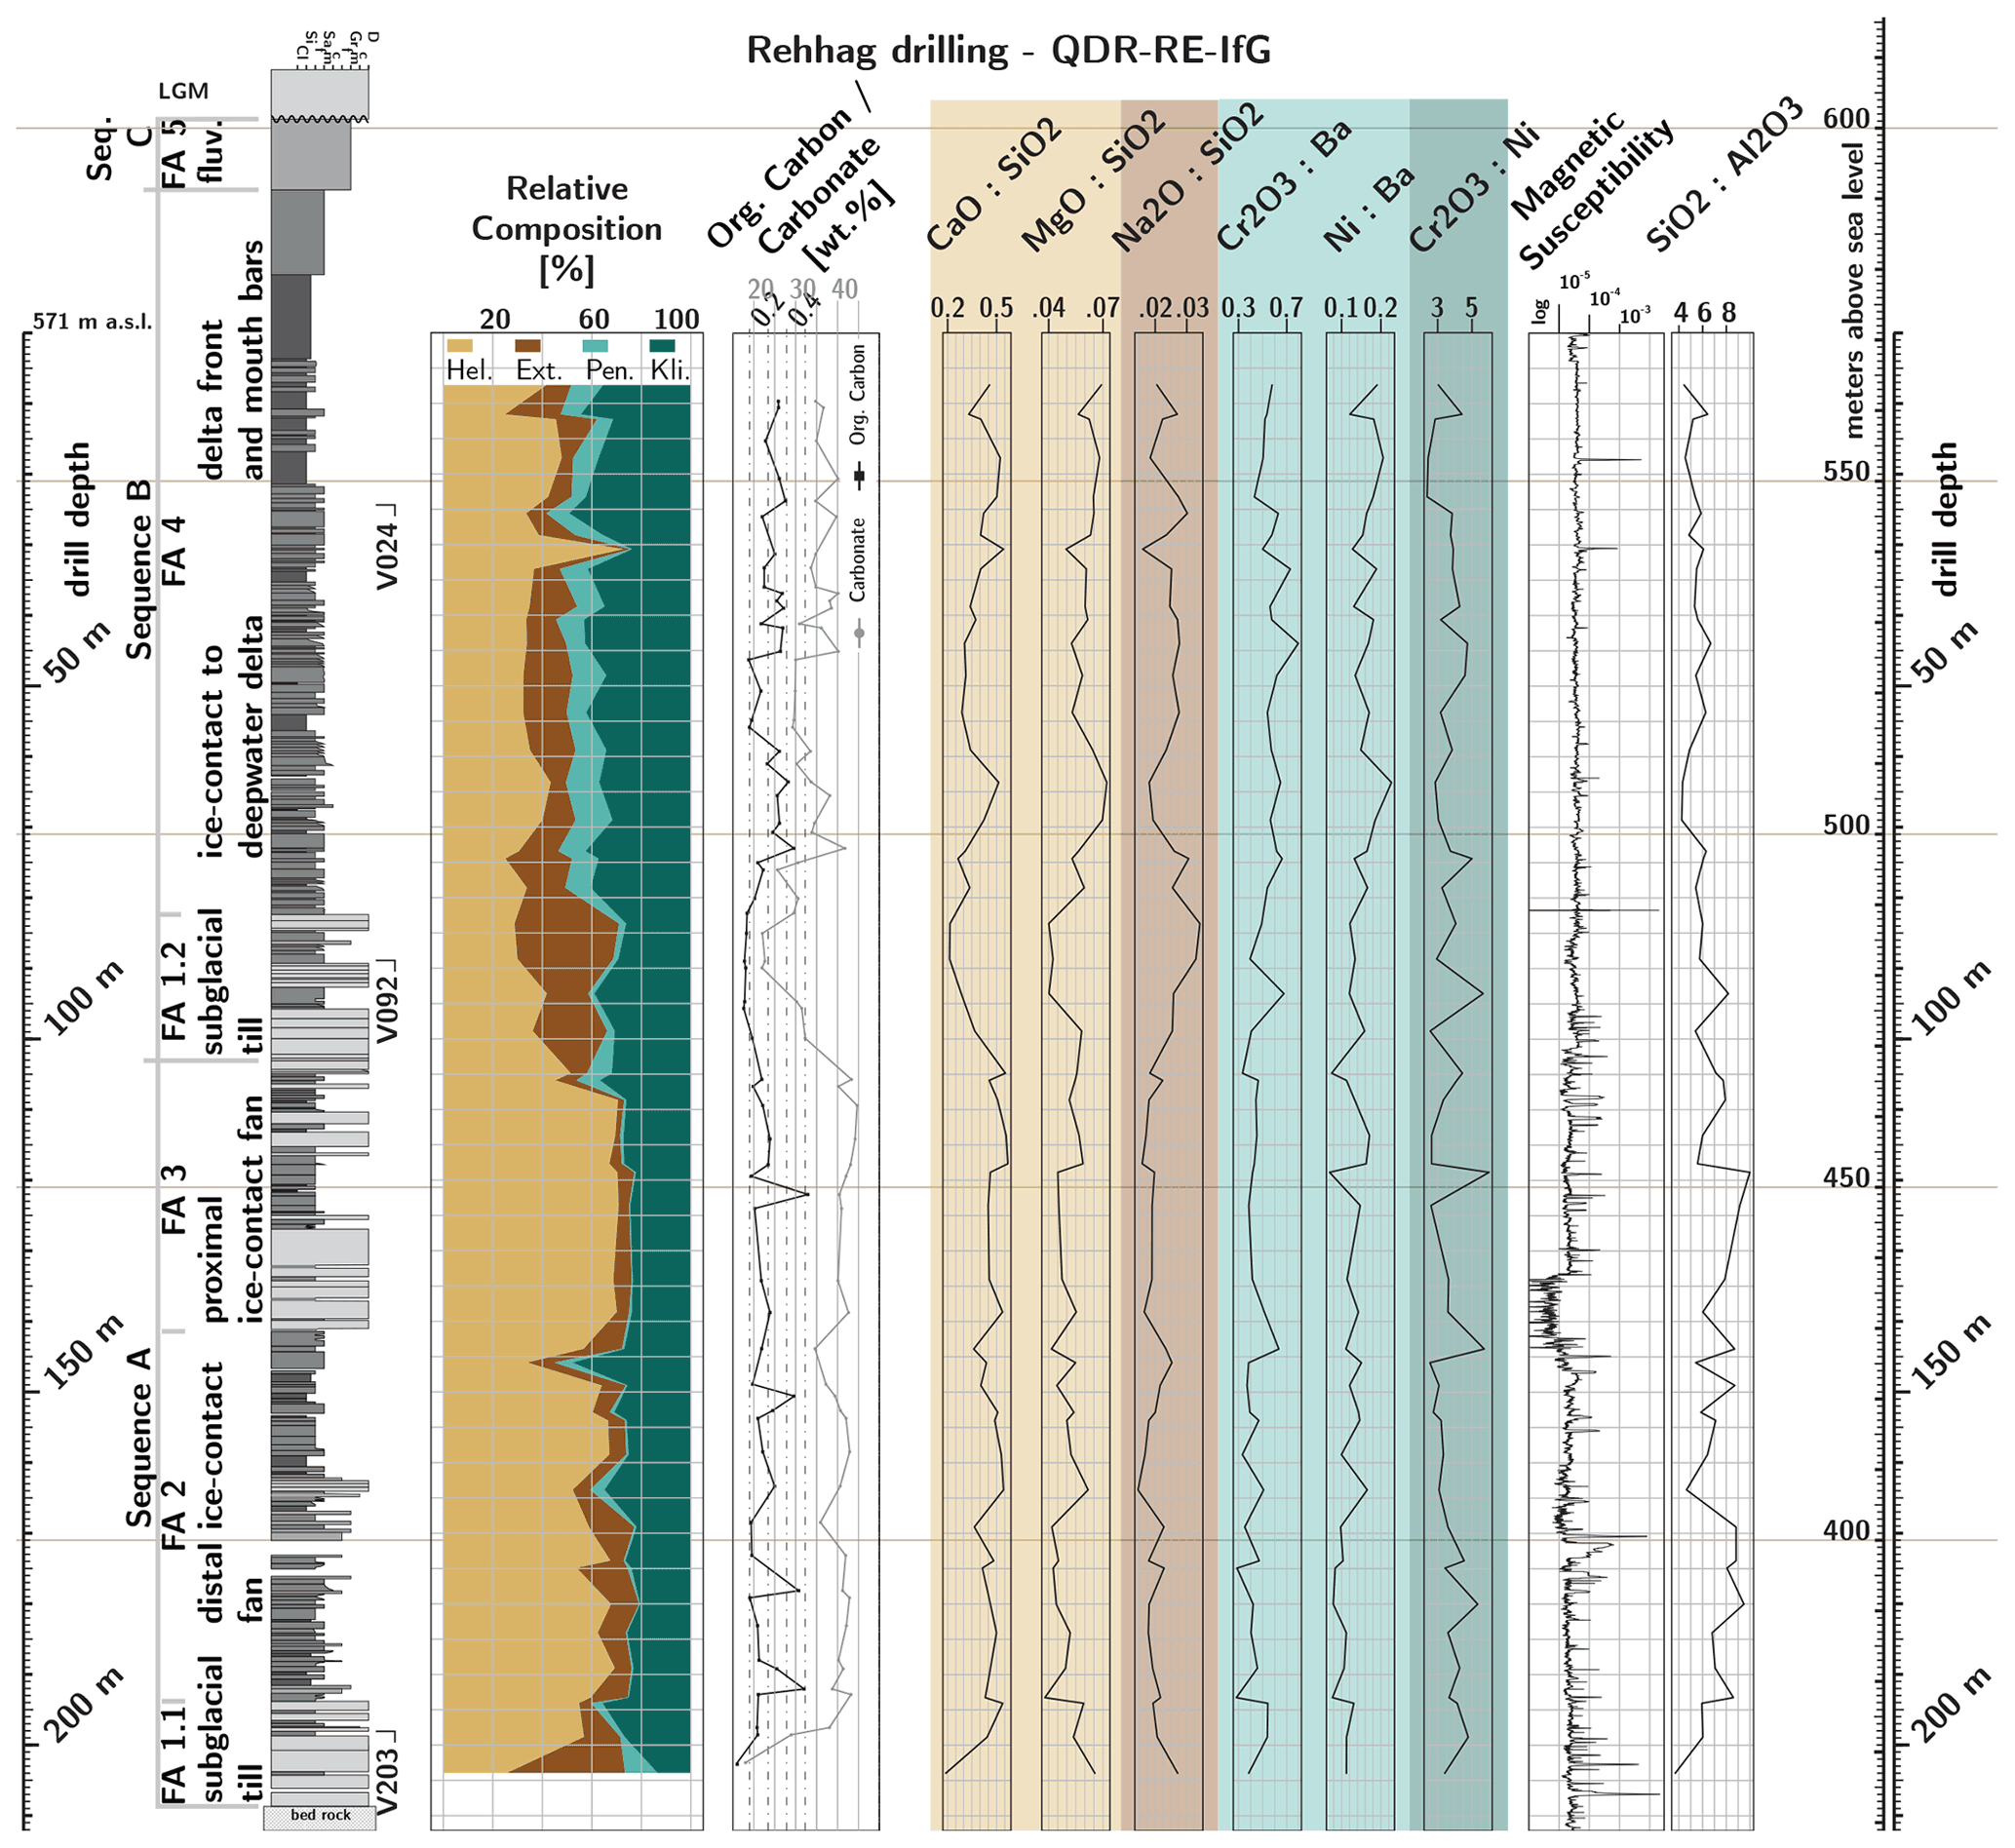
Figure 5Illustration of the unmixing results presented in Table 2, together with the log of the sedimentary succession recovered in the scientific drilling at the Rehhag site (Schwenk et al., 2022). The sampling depths of the heavy mineral and garnet samples are indicated alongside the log. Additionally, the results of the CNS analysis (TOC and carbonate content) are presented along with the readings of the magnetic susceptibility (MS) that had been reported by the aforementioned authors. Furthermore, the variation in compound ratios that were used to distinguish different source lithologies in the provenance analysis of Swiss Molasse sandstones (von Eynatten, 2003) is presented. The compound ratios are sorted and colored to reflect the lithotectonic units that can potentially be linked to in the sediment mixture. The MS of the sediment and the SiO2:Al2O3 ratio in the sediment mixture can be used to infer the grain size in the respective core sections. Please refer to the text for a detailed discussion.
Because of this complication, we additionally performed single-grain analysis on garnet (Morton, 1985). Detrital garnet geochemistry has been shown to successfully discriminate between source regions of different metamorphic grade and lithology in the Swiss Alps and is particularly effective in distinguishing detritus from the External massifs from that of Penninic origin (Stutenbecker et al., 2017). We chose samples V024, V092, and V203 to represent FA 4, FA 1.2 (both Sequence B), and FA 1.1 (Sequence A), respectively (Fig. 5). Following the approach of Stutenbecker et al. (2018) the grain size fractions 63–250 µm were used to separate heavy minerals. We applied standard heavy mineral separation techniques as outlined in Andò (2020). The heavy minerals were identified using a polarization microscope, and around 200 transparent heavy mineral grains were counted using a Pelcon point counter and an evenly spaced square grid of 0.3 mm step length (Garzanti and Andò, 2019).
From the remaining heavy mineral concentrate, around 100 garnet grains were handpicked using a binocular. The obtained grains were mounted in epoxy resin grain mounts, ground, polished, and analyzed at the University of Tübingen (Germany) using an Agilent 7900 inductively coupled plasma mass spectrometer (ICP–MS) coupled with an Applied Spectra RESOlution-SE laser ablation system with a A155 sample cell. The laser energy was 5 J cm−2, and we used a laser spot size of 30 µm diameter. The ICP–MS was tuned with the NIST SRM612 glass standard. The analysis was time resolved with a total integration time of ca. 0.57 s. The background was measured for 20 s, followed by 30 s of sample measurement. The raw data were cleaned and reduced with an internal software from the University of Tübingen. The garnets were classified using the random forest classification by Schönig et al. (2021) that assigns host rock types based on the concentrations (in wt %) of the element oxides SiO2, TiO2, Al2O3, Cr2O3, FeO total, MnO, MgO, and CaO. The three main host rock types are metamorphic (MM), igneous (IG), and metasomatic (MS). For metamorphic host rocks (MM), the garnets can be further subdivided into those of blueschist/greenschist facies (BS/GS), amphibolite facies (AM), granulite facies (GR), and eclogite facies/ultrahigh-pressure (EC/UHP) metamorphic grade. All three host rock types are furthermore assigned subclasses that in our case fall into three compositional categories: mafic (M), intermediate felsic/sedimentary (IF/S), or calcsilicate (CS). Accordingly, each garnet grain is assigned a combined class consisting of three single abbreviations, e.g., MM GR IF/S refers to a garnet formed in a metamorphic (MM), granulite facies rock (GR) of intermediate felsic or sedimentary composition (IF/S).
(Garzanti et al., 2012; Stutenbecker et al., 2018)(Stutenbecker et al., 2017)Garzanti et al., 2012Stutenbecker et al., 2018(Stutenbecker et al., 2017)Frasson (1947)Strunck and Matter (2002)(Gurnigel flysch; Stutenbecker et al., 2019)(Lüthy et al., 1963)(Füchtbauer, 1964)Table 3Database from the Central Alps used for the comparison of heavy mineral and detrital garnet data.
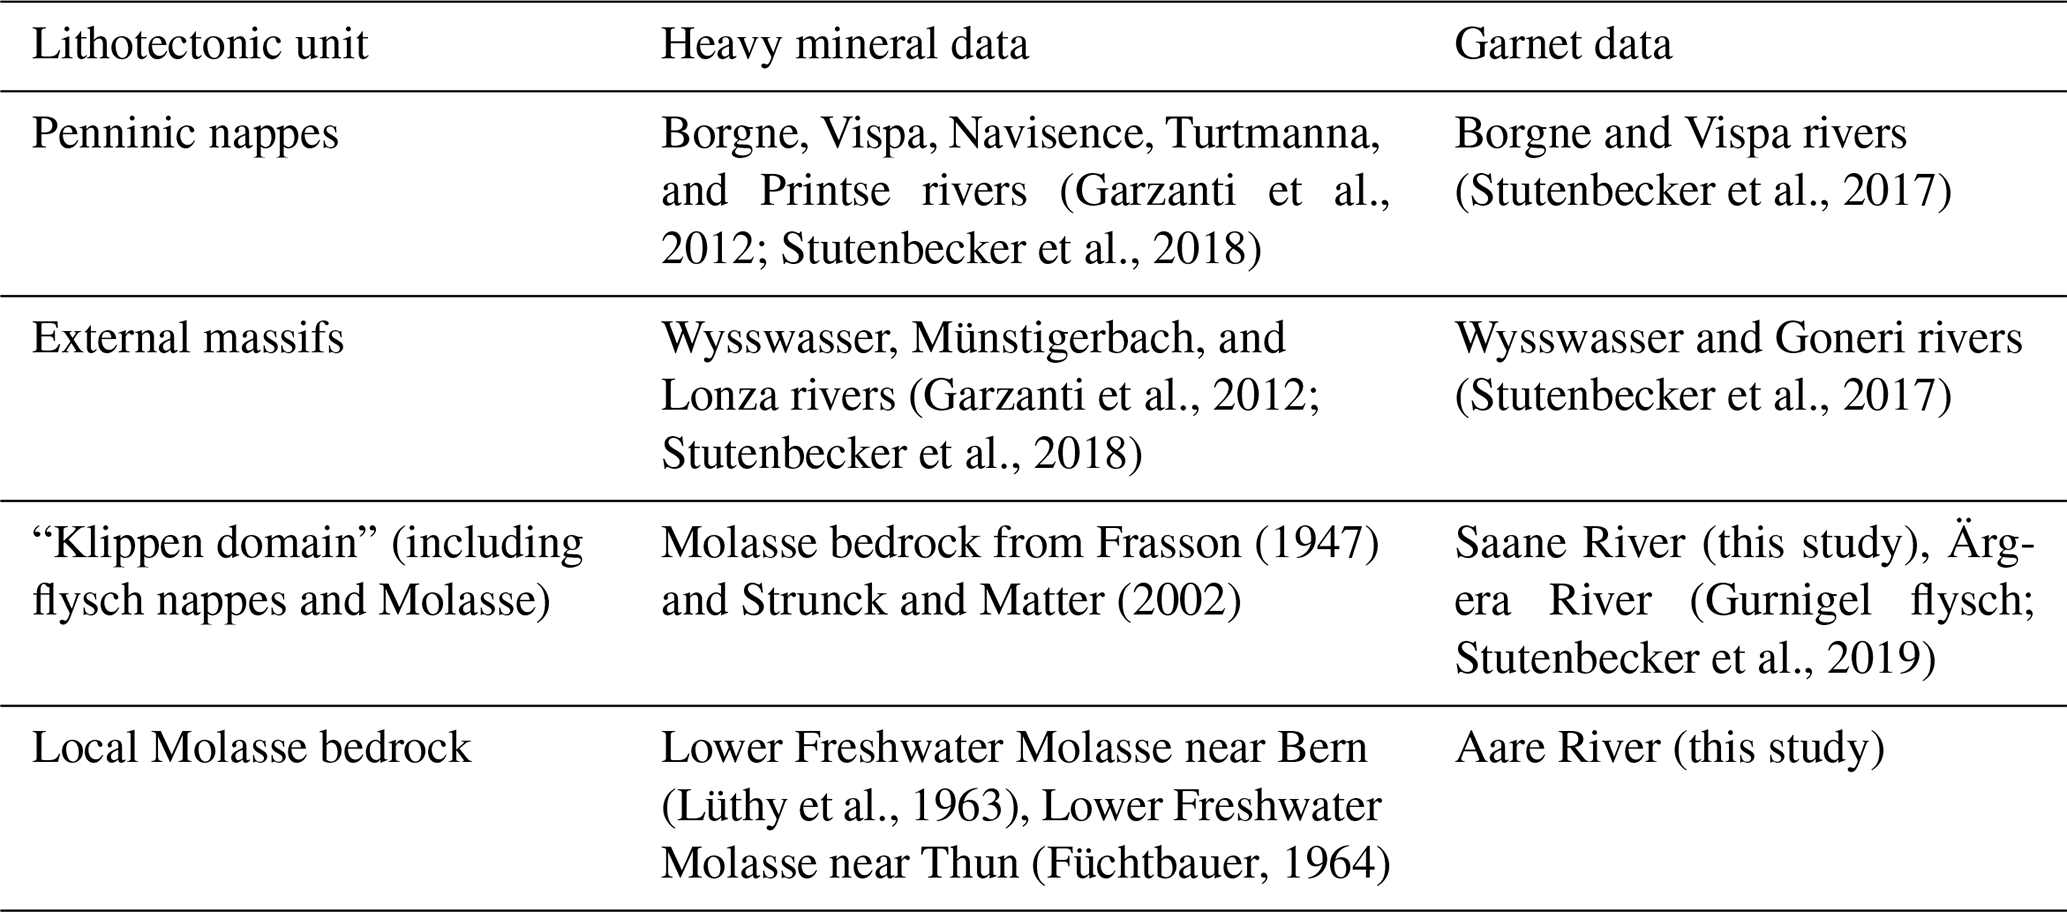
In order to compare the obtained heavy mineral and garnet data from the drill core to potential source rock units, we used data from the literature as provided in Table 3. Similar to the geochemistry approach, we defined the Penninic domain and External massifs as endmember sources, and their heavy mineral and detrital garnet signature is provided by modern rivers draining those units (Garzanti et al., 2012; Stutenbecker et al., 2018). The Helvetic nappes were excluded since they have extremely low heavy mineral fertility (Stutenbecker et al., 2018) and are therefore not likely to significantly contribute heavy minerals to the deposits in the Bümpliz trough. The limestones of the Klippen domain are expected to have equally low heavy mineral fertilities; however, this source area also contains garnet-bearing Cretaceous–Eocene flysch (most prominently the so-called Gurnigel flysch; Wildi, 1985), as well as Molasse rocks (Strunck and Matter, 2002). We complemented the existing data with two more samples from the modern Aare and Saane rivers that are expected to provide a fingerprint of the local Molasse around Bern and the mixed flysch/Molasse rocks of the Klippen domain, respectively.
For visual examination of the similarity of the drill core and source rock data, we used the nonmetric multidimensional scaling (MDS) function of Vermeesch et al. (2016).
4.1 Geochemistry
The results of the ICP–ES measurements are available in the Supplement. These data reflect the bulk chemical composition of the individual samples and are the basis for the conducted provenance analysis.
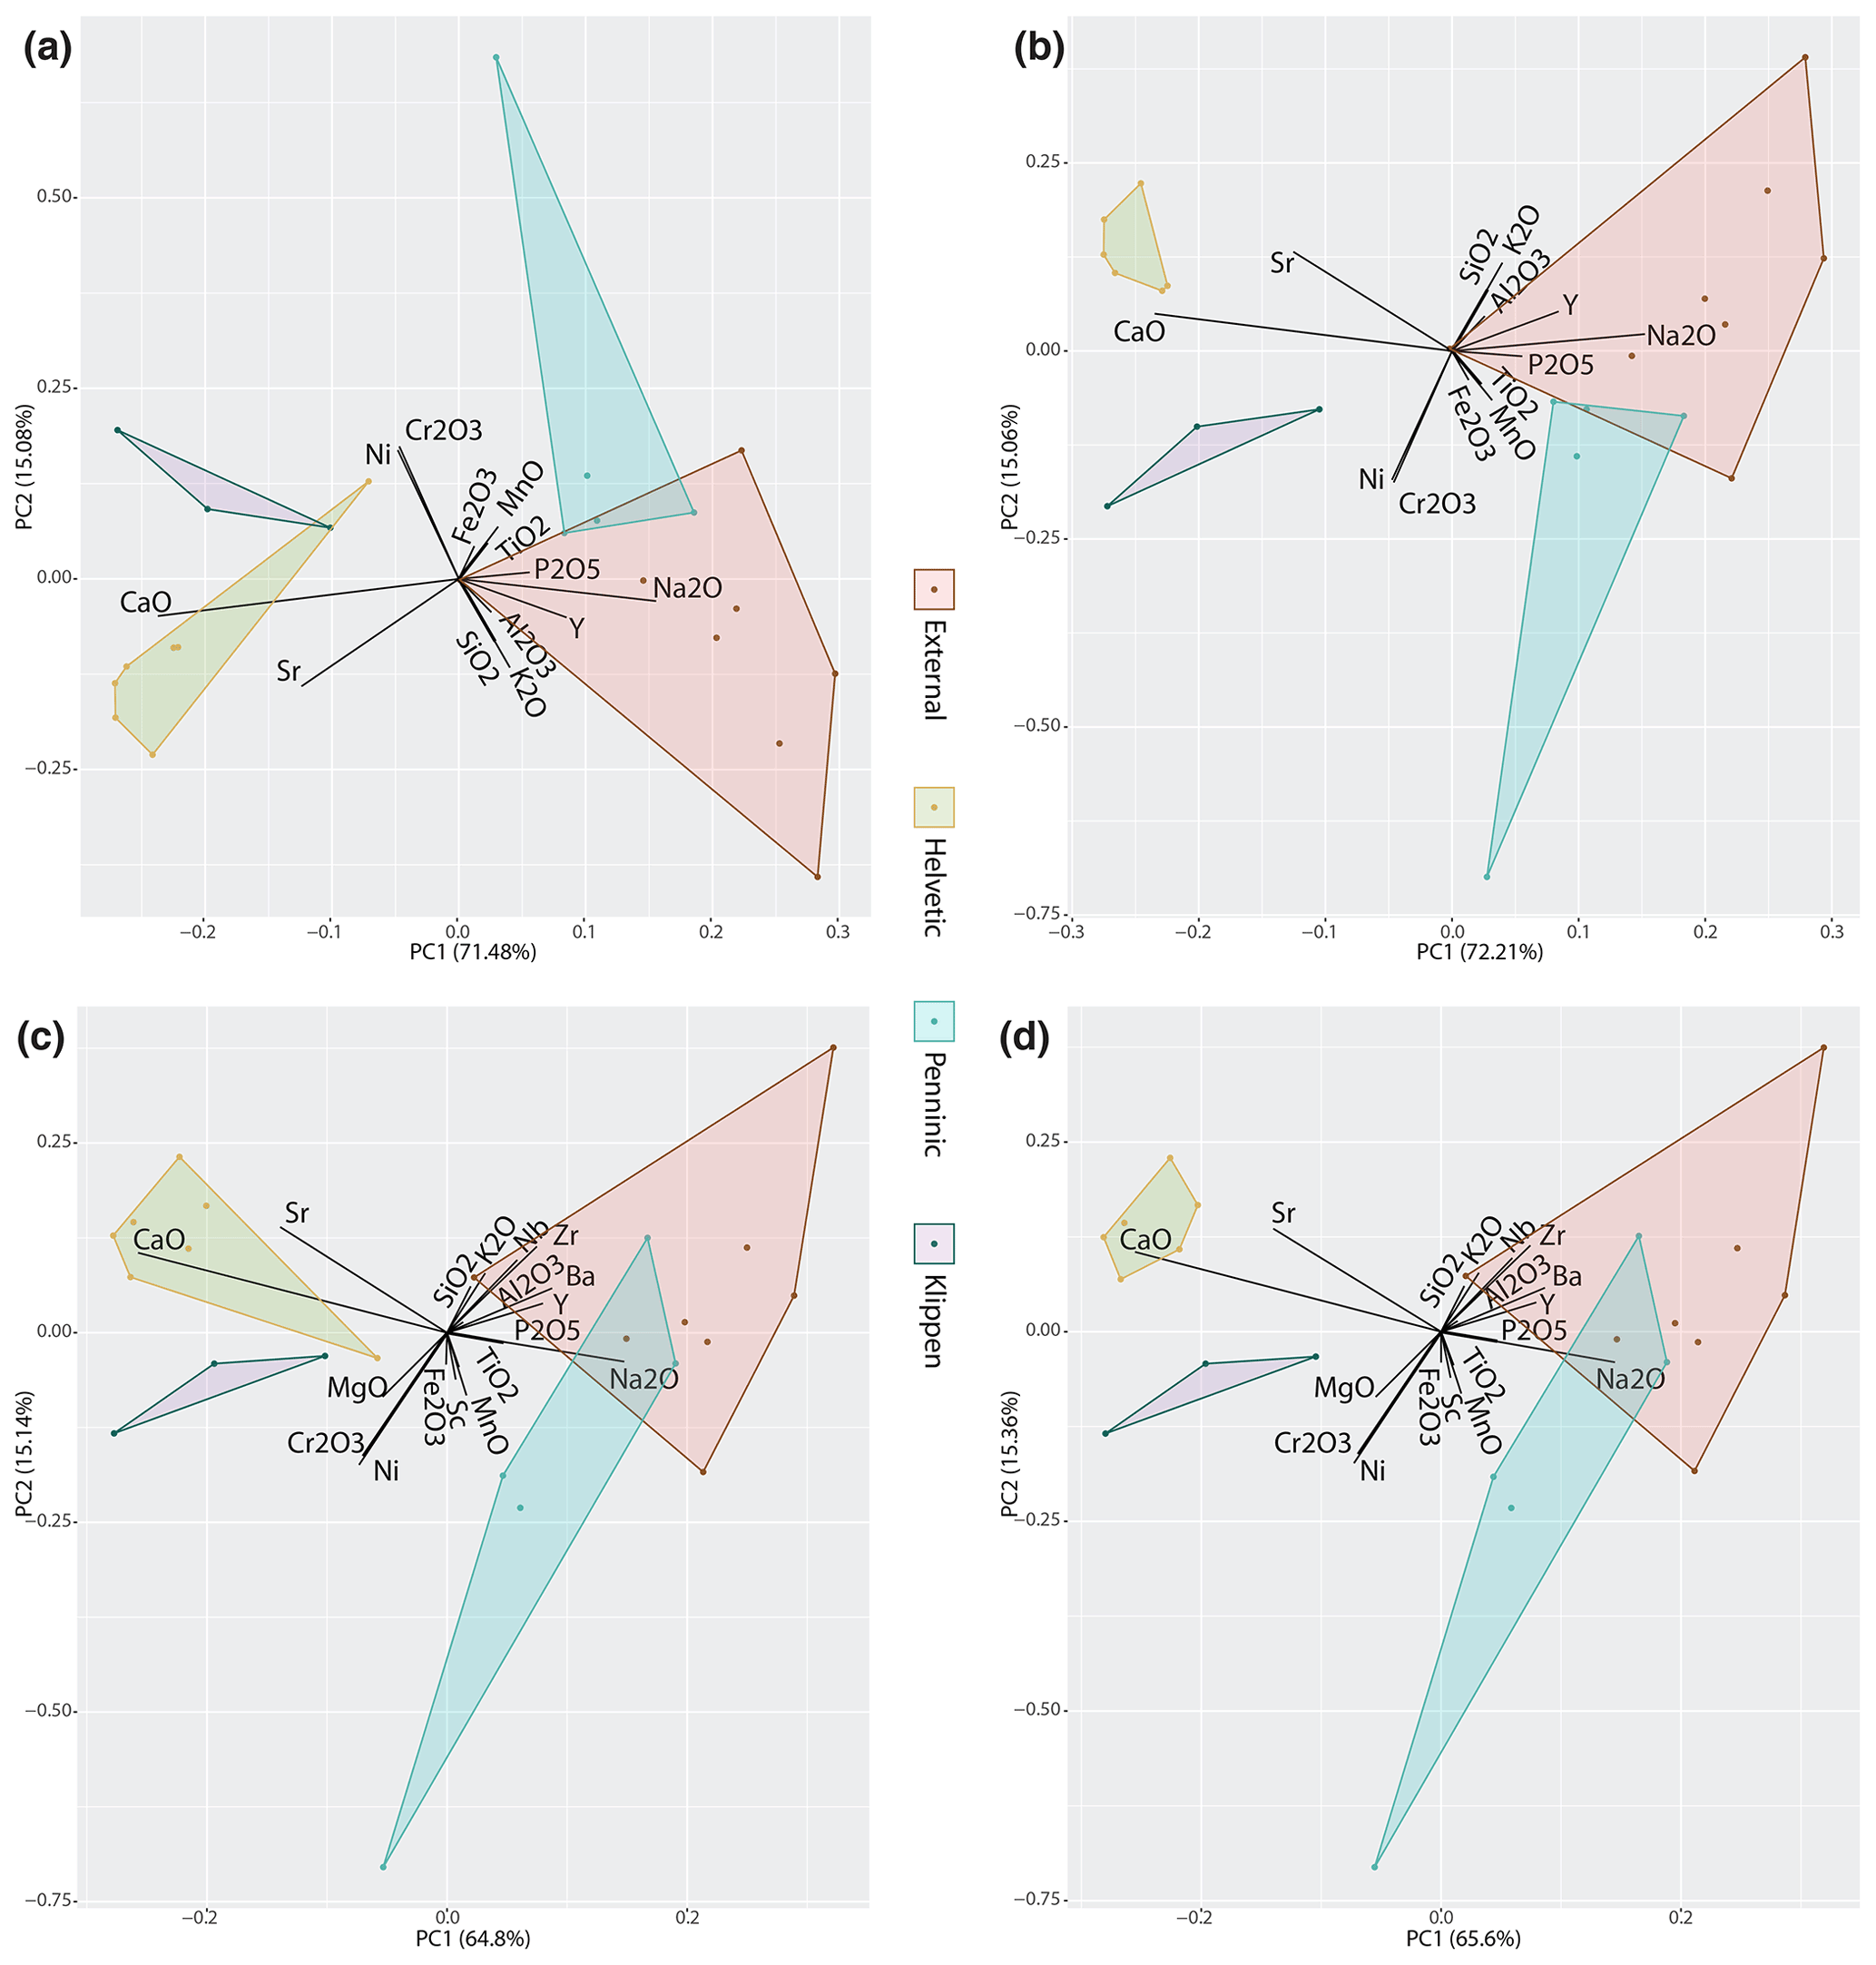
Figure 6Results of the principal component analyses (PCA) performed exemplarily on four different data sets. The total number of variables was reduced from 18 to 13 in (a) and (b) by removing MgO, Ba, Zr, Nb, and Sc. The full set of variables was used in (c) and (d). The data set of one tributary (Lue – Lütschine) in the Helvetic group was removed in (b) and (d). Therefore, the plot in (c) shows the PCA results based on the complete data set.
Table 4The goodness of fit (GOF) of the unmixing performed with different input data sets. The first GOF value was returned for the unmixing results using the first approach. The remaining six GOF values were returned by the unmixing step in the second approach. The acronyms indicate the number of input variables or if all variables were used (av) and if one catchment was removed (woLue) or if all catchments were used (ac).
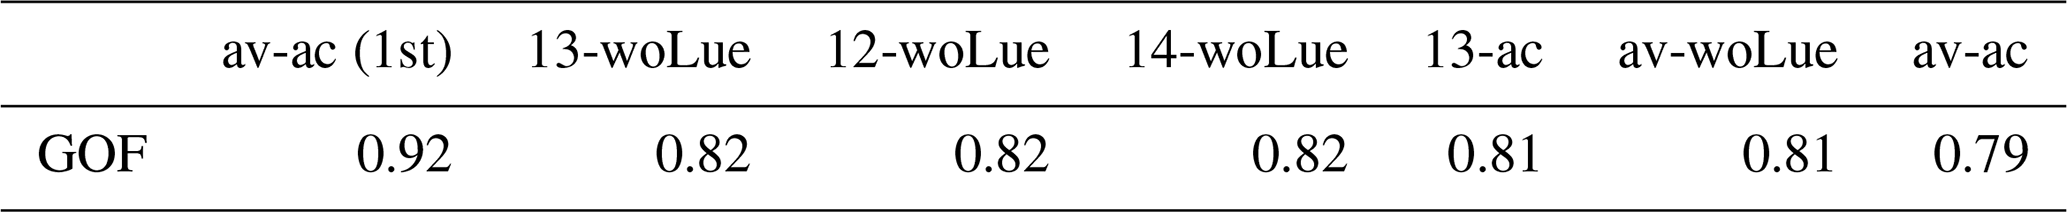
Figure 6 shows the PCA results from four different runs (i.e., combinations of variables and tributaries) for which the second approach described above was employed. Overall, the discrimination between the four source groups (lithotectonic units) is good for any of the data sets. The plots in Fig. 6a and c show that one catchment sample in each of the External, the Helvetic, and the Penninic domains is located far off the center of the respective groups, and that these samples could be considered outliers. The discrimination becomes considerably better when individual variables are removed from the analysis. , and Sc are missing in Fig. 6a, b and lead to a better discrimination in the first principle component (PC1) which is the major axis to distinguish sedimentary from crustal source rocks (Helvetic/Klippen vs. External/Penninic). The removal of individual catchments, for example from the Helvetic group (Fig. 6b, d), does not change the results significantly. Nevertheless, the data set with a reduced set of variables and with one missing catchment is most discriminative in the PCA (Fig. 6b). This finding is corroborated by the comparison of the average GOF that resulted from the unmixing of different data set combinations, the results of which are presented in Table 4.
4.2 Unmixing
The unmixing results in Fig. 7a to d were obtained through the procedure described above as the second approach. The unmixing results of the data set that was considered as most representative are presented in Table 2 and Fig. 7c. An account of the variations in the unmixing results with regard to the distinguished Sequences A and B as well as to the different FAs is presented in Table 5. All these plots reveal a significant change in the sediment composition from 99 to 105 m depth that separates the drilled suite in two distinct sections. The lower half is dominated by material derived from the Helvetic sources (65 %). The Klippen nappe contributes a stable background (25 %) to the mixture. A single peak in Klippen material (ca. 40 %) is detected at 145 m depth. The contribution of Penninic material to the mixture (< 3 %) is too low to determine any trends. Material input from the External massifs is prominent at depths > 143 m. A third significant peak of material input from the External massifs can be found at a depth of 203 m. There, between 55 % and 65 % of the material is derived from External sources alone. This 10 % difference is compensated for by material from Penninic sources, yet this depends on the choice of the input variables for the unmixing step. Throughout the lower half of the drilled sedimentary suite the material input from External sources decreases upsection, whereas the relative abundance of sediment from Helvetic sources increases. Between depths of 108 and 139 m the unmixing results show the lowest variability in the sediment composition. The upper half of the drilled suite shows a greater influence of the External, Klippen, and Penninic sources. Between depths of 74 and 99 m material from the External massifs visually dominates the sediment mixture (ca. 32 %), although the material is derived from External, Helvetic, and Klippen sources in about equal proportions. At depths between 7 and 74 m the Penninic and External contribution is relatively stable, and most of the variance is caused by changes in the contribution from Klippen and Helvetic sources. In the same section, the relative abundance of sediment from Penninic sources reaches the highest value (10 %) in all of the sections. A single peak in Helvetic material (ca. 75 %) at a depth of 30 m is counterbalanced by equivalent reductions of material contributions from Klippen and External sources.
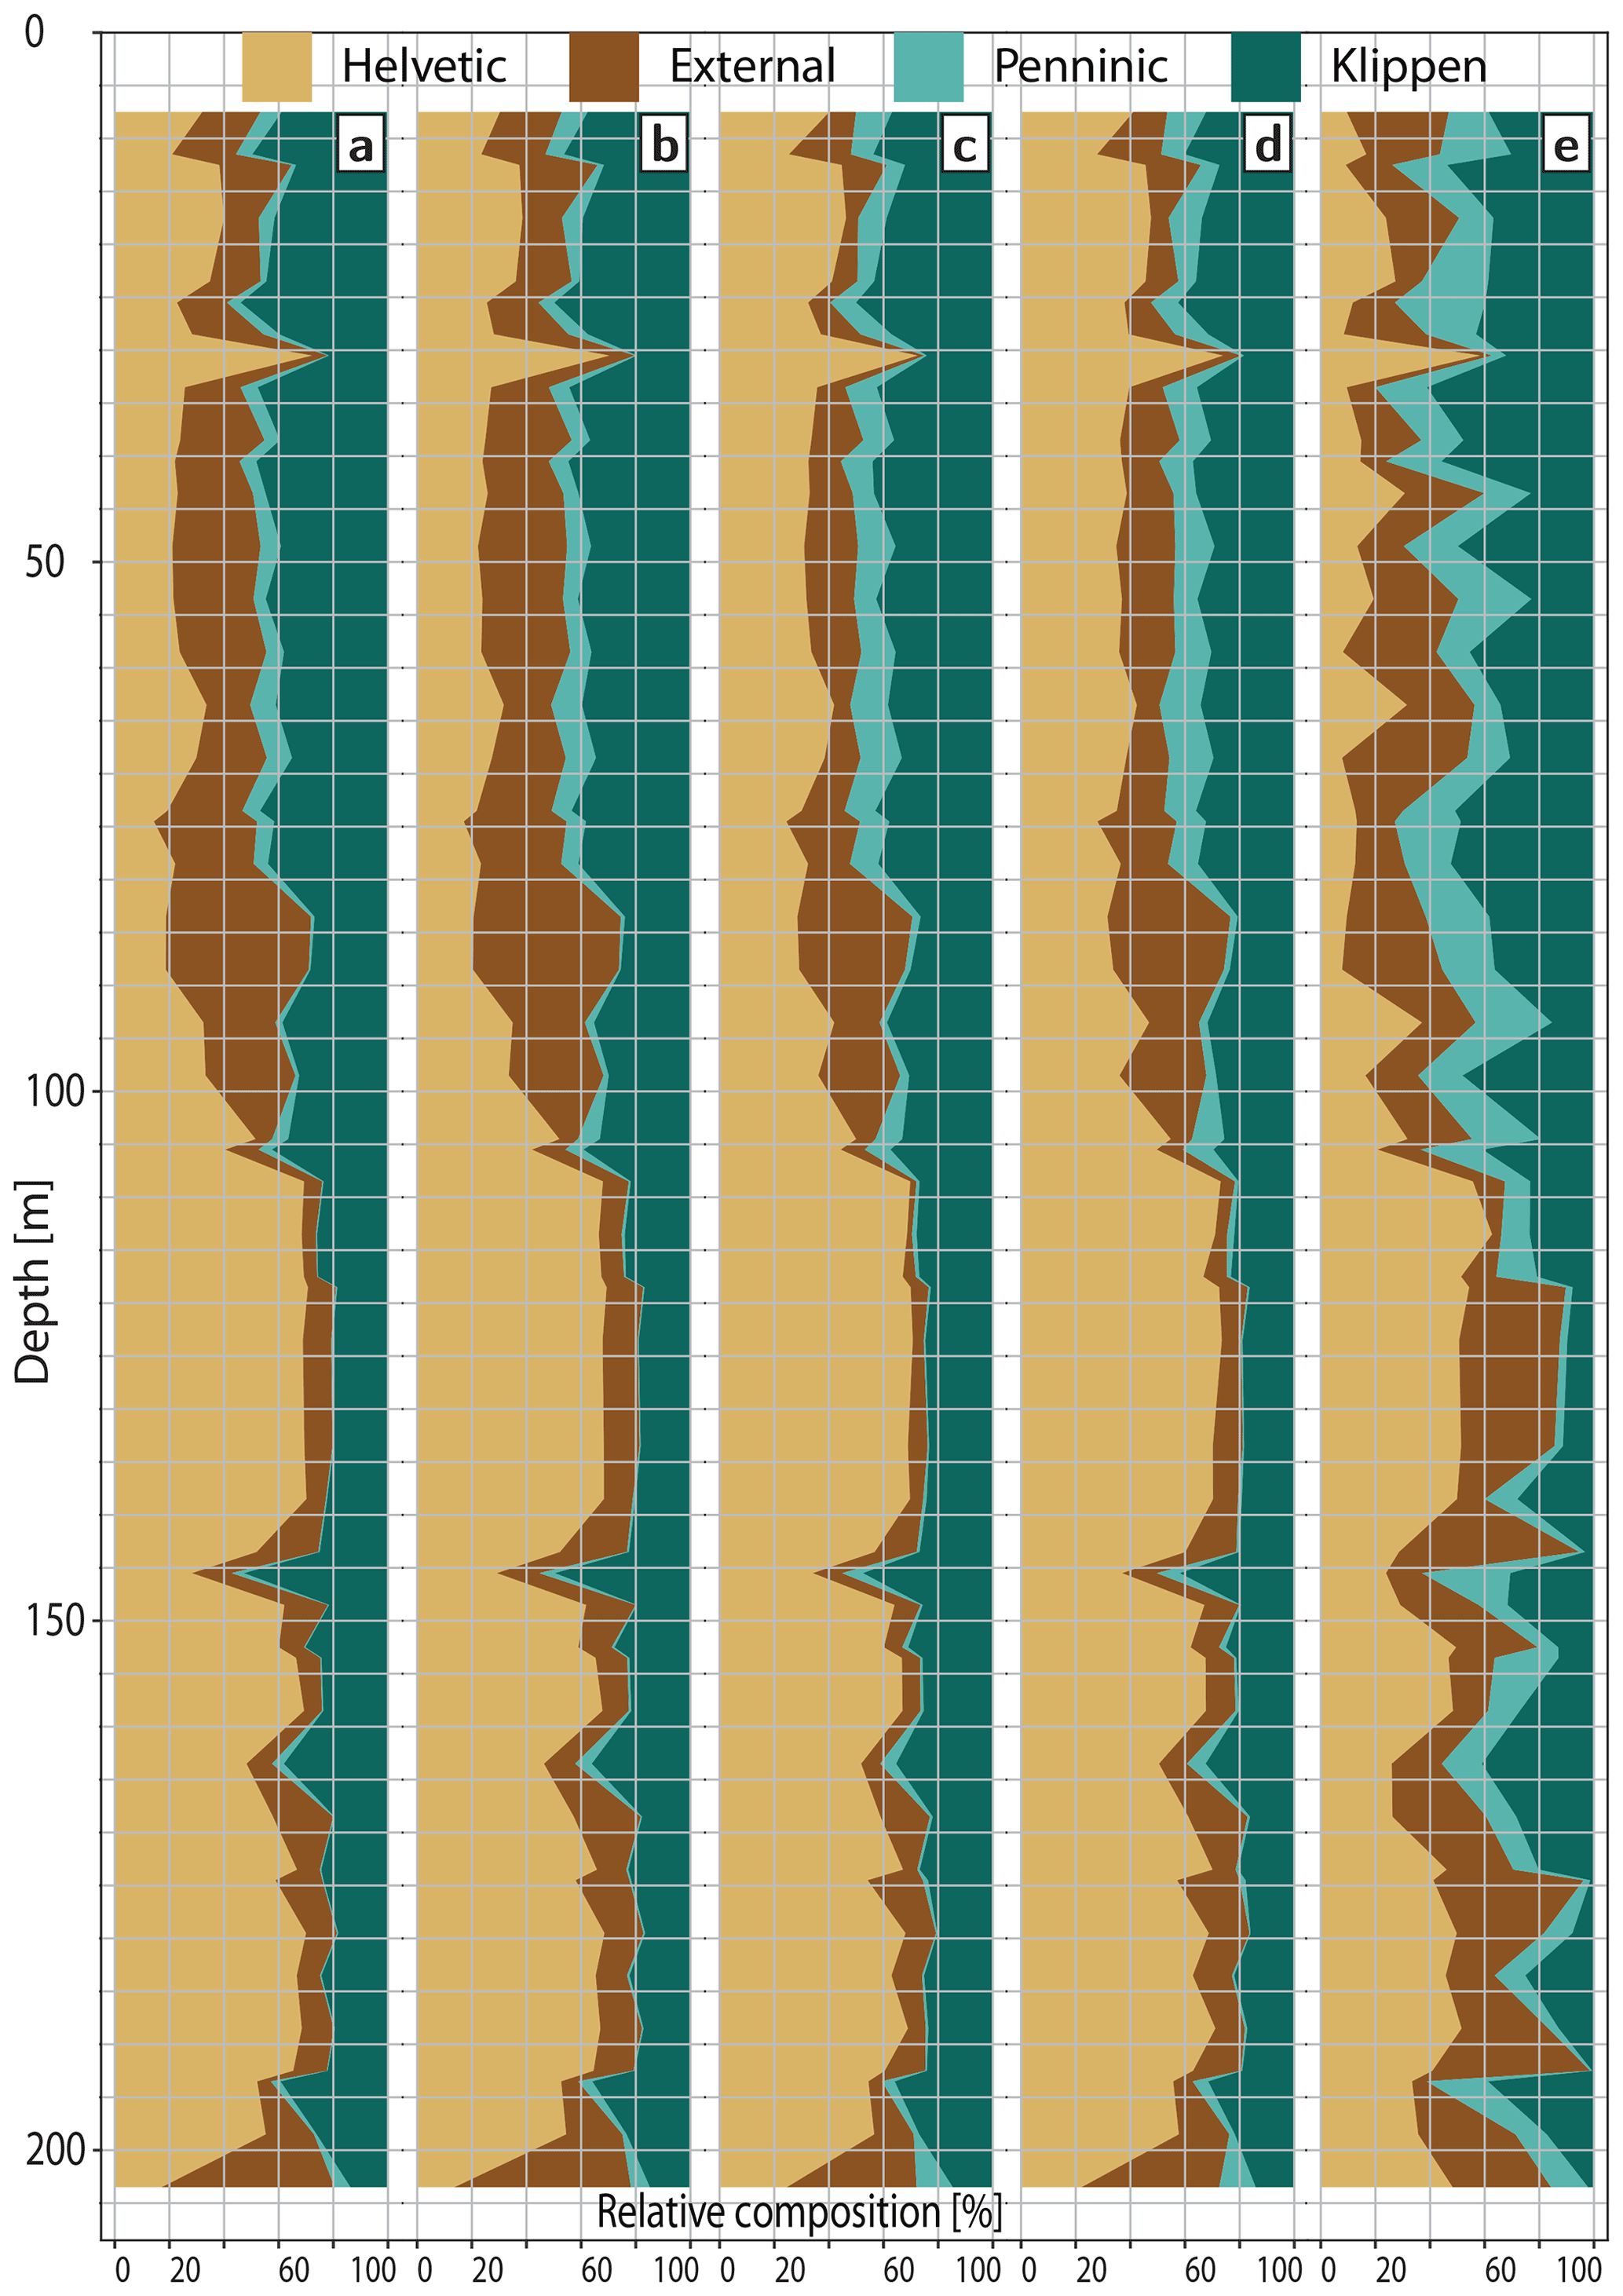
Figure 7Results of the unmixing step. The graphs in (a) through (d) are based on the data sets used in their equivalents in Fig. 6. Panel (e) shows the results of the procedure described in Sect. 3 as the first approach. The plot in (c) shows the results that are finally discussed and that are presented alongside the sedimentary log in Fig. 5.
Table 5Mean and standard deviation of the unmixing results determined from the samples in the two sequences and in the five facies assemblages (FAs) distinguished in the sedimentary succession. Similarly, the mean and standard deviation of distinctive compound ratios were determined in the same units to evaluate the unmixing results. Please refer to the text for further descriptions.

Figure 7e depicts the results of the unmixing process based on data that were compiled and analyzed following the first approach outlined above. In this solution, the sediment composition is much more variable. Overall, the contribution of Penninic sources is more pronounced. The trends that were described for the plots in Fig. 7a through d are vaguely present in this fifth plot, yet these trends are attenuated by the large variability in sediment composition determined in the unmixing step. Nevertheless, in this approach the average GOF for all 52 unmixing results was 0.92 (Table 4).
Figure 5 reveals that the unconformity between Sequences A and B at a depth of 103 m is also reflected by a change in the sediment composition. Likewise, transitions between the distinguished facies assemblages at 83, 141, and 194 m depth correspond well with the described changes in the sediment composition. Henceforth, we describe the results taking into account the unconformity between Sequences A and B.
4.3 Element correlations
Figure 5 additionally displays different compound ratios that can be used to assess the unmixing results (see correlation plots in Appendix Fig. A1). The variability of these compound ratios with regard to the distinguished Sequences A and B as well as to the FAs is presented in Table 5. The carbonate content in the recovered sediment, the CaO:SiO2 ratio, and the calculated input from the Helvetic units are positively correlated. In contrast, the CaO:SiO2 ratio is not correlated to the portion of material derived from the Klippen domain. The correlation between the MgO:SiO2 ratio and the relative abundance of material derived from Helvetic units in Sequences A and B is negative or very weak, respectively. Although the apparent input of material from Helvetic sources is higher in Sequence A than in Sequence B, the contrary is the case for the MgO:SiO2 ratio, which is higher in the upper part. For the entire core, a weak positive correlation exists between the MgO:SiO2 ratio and material derived from the Klippen domain. Furthermore, in Sequences A and B the MgO:SiO2 ratio is positively correlated to the portion of material of Penninic origin. However, in Sequence A the calculated contribution from Penninic sources is less than 3 % on average and mostly below 1 %. The Na2O:SiO2 ratio, which is considered to be representative for the portion of sediment derived from the External units, increases significantly across the unconformity between Sequences A and B. Overall, the Na2O:SiO2 ratio is positively correlated with the portion of material from the External massifs throughout the core. The Cr2O3:Ba and Ni:Ba ratios in Sequence A do not correlate with the input of material from Penninic sources, yet a slight positive correlation is present in Sequence B. The Cr2O3:Ni ratio cannot be used to infer the input of material from Klippen sources as the ratio is in the range of 2 to 5 and thus too low to make an inference on such an input. Furthermore, this ratio is not correlated with the abundance of material derived from Penninic sources. In Sequence A, the SiO2:Al2O3 ratio is significantly higher than in Sequence B, and likewise the MS amplitude is notably higher in the lower than in the upper half of the core. Hence, the MS amplitude and the SiO2:Al2O3 ratio correlate well, indicating that the sediment in Sequence A is composed of larger clasts than Sequence B, which is consistent with the occurrence of a large number of gravel and diamictic beds in the log. Finally, the low TOC content between 0.2 % and 0.4 % observed in the sediment indicates that the organic material was most likely not produced within the lake itself. This points to the supply of organic material from recycled older sediments or from the bedrock.
4.4 Heavy mineral analysis
The three selected sand samples have heavy mineral concentrations of 1 %–2 % (“moderately poor” following Garzanti and Andò, 2007). The heavy mineral spectra (Fig. 8) of the three selected sand samples are all dominated by epidote group minerals (over 60 %; including epidote, clinozoisite, and rarely zoisite) with moderate contents of garnet (7 %–22 %), hornblende (4 %–11 %), and apatite (3 %–6 %) and minor contents (< 5 %) of staurolite, titanite, zircon, tourmaline, rutile, blue sodic amphibole, chloritoid, and sillimanite. Spurious grains (Garzanti and Andò, 2007) encountered in the concentrates include chlorite, ankerite–dolomite, biotite, and glauconite. Although the three samples are relatively similar in their heavy mineral content, we noted a slight increase in hornblende from the lowermost sample (V203, 4 %) to the uppermost sample (V024, 11 %). Blue sodic amphibole is only present in samples V092 and V024, whereas chloritoid is found in samples V203 and V024 but not in sample V092.
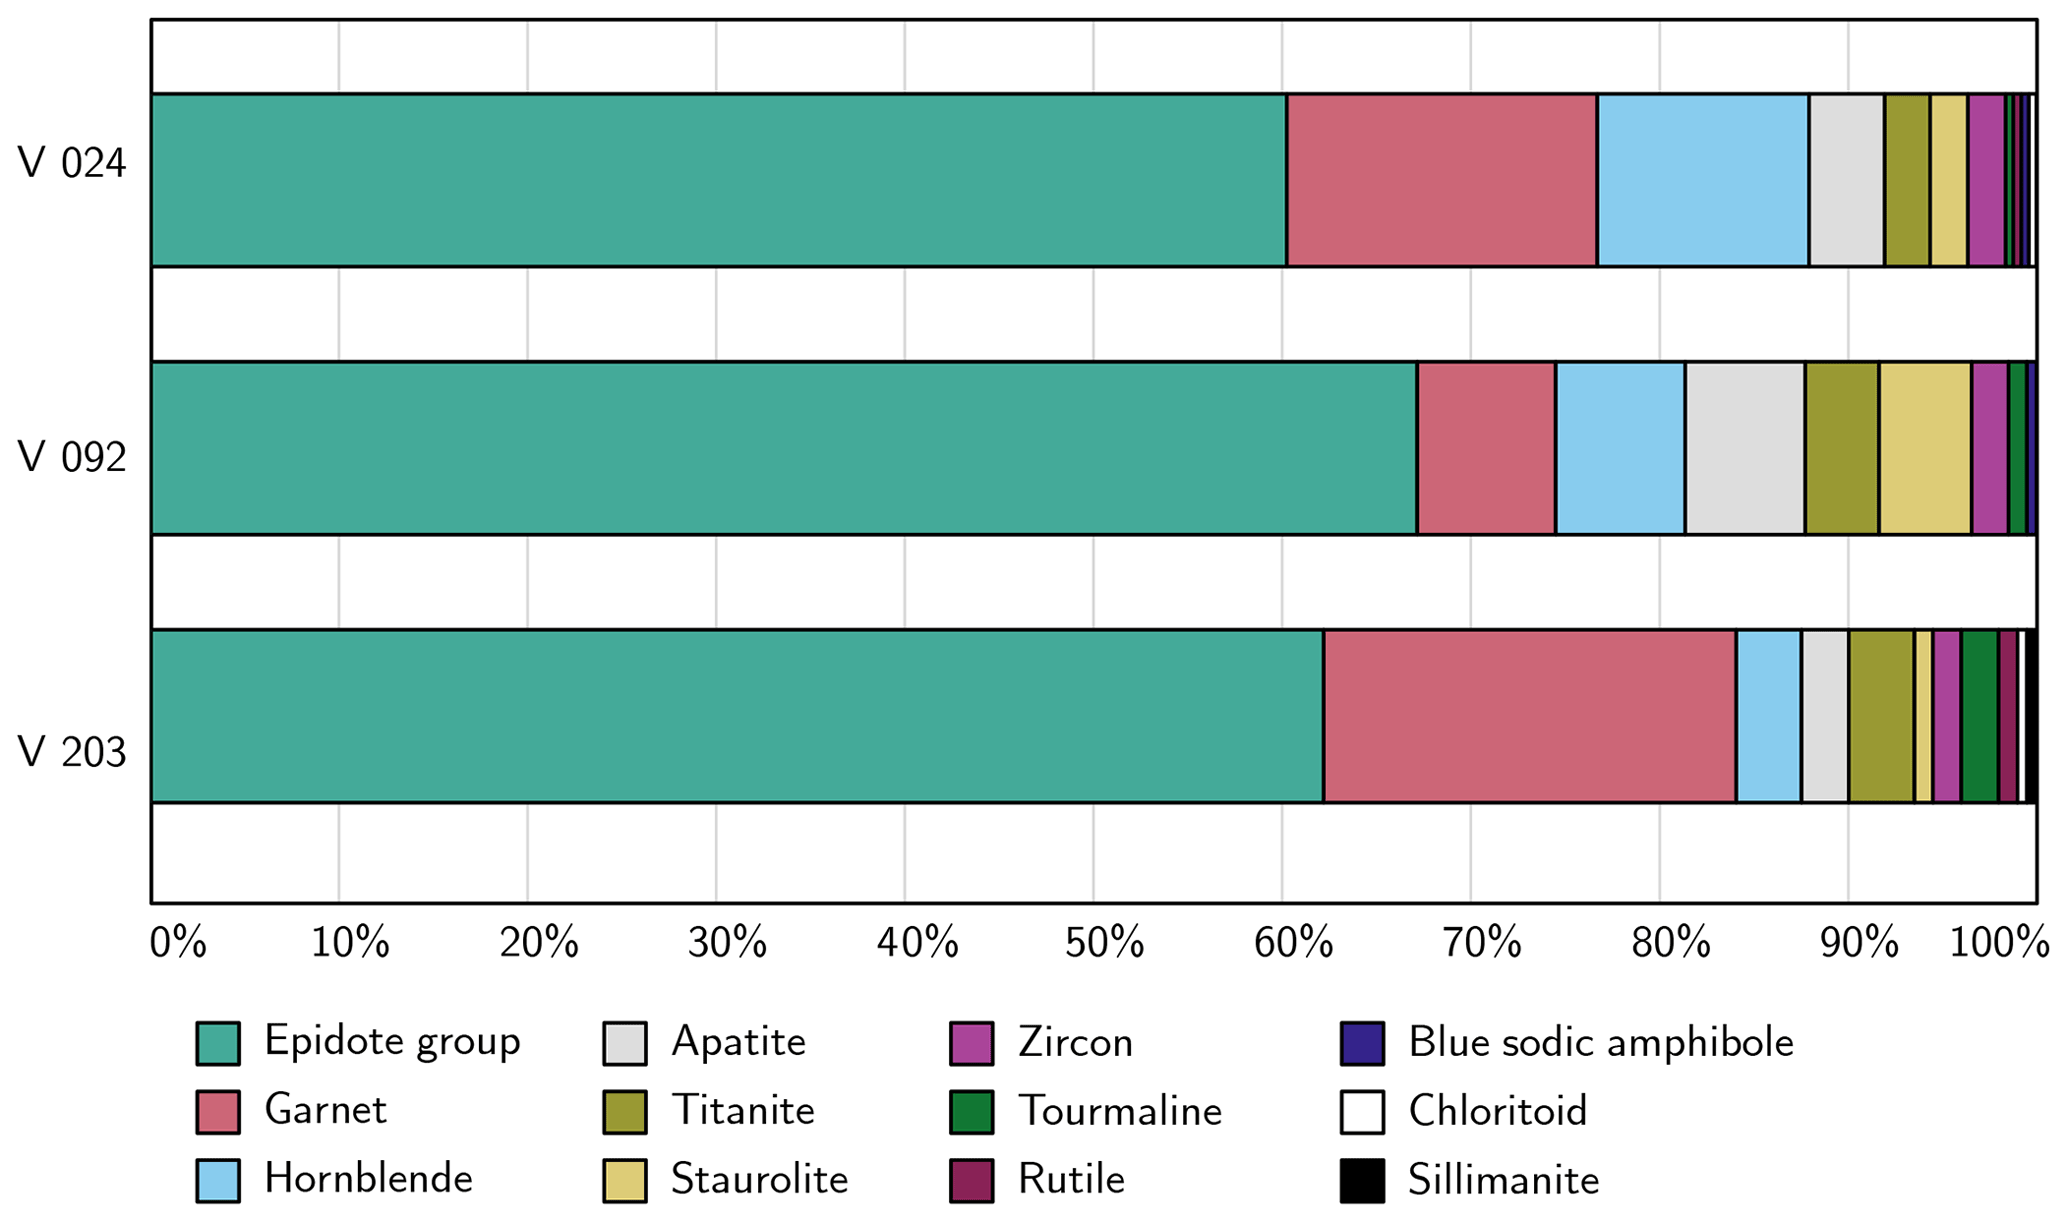
Figure 8Heavy mineral composition of the three core samples in stratigraphic order. The sampling depth of each of the samples is shown in Fig. 5.
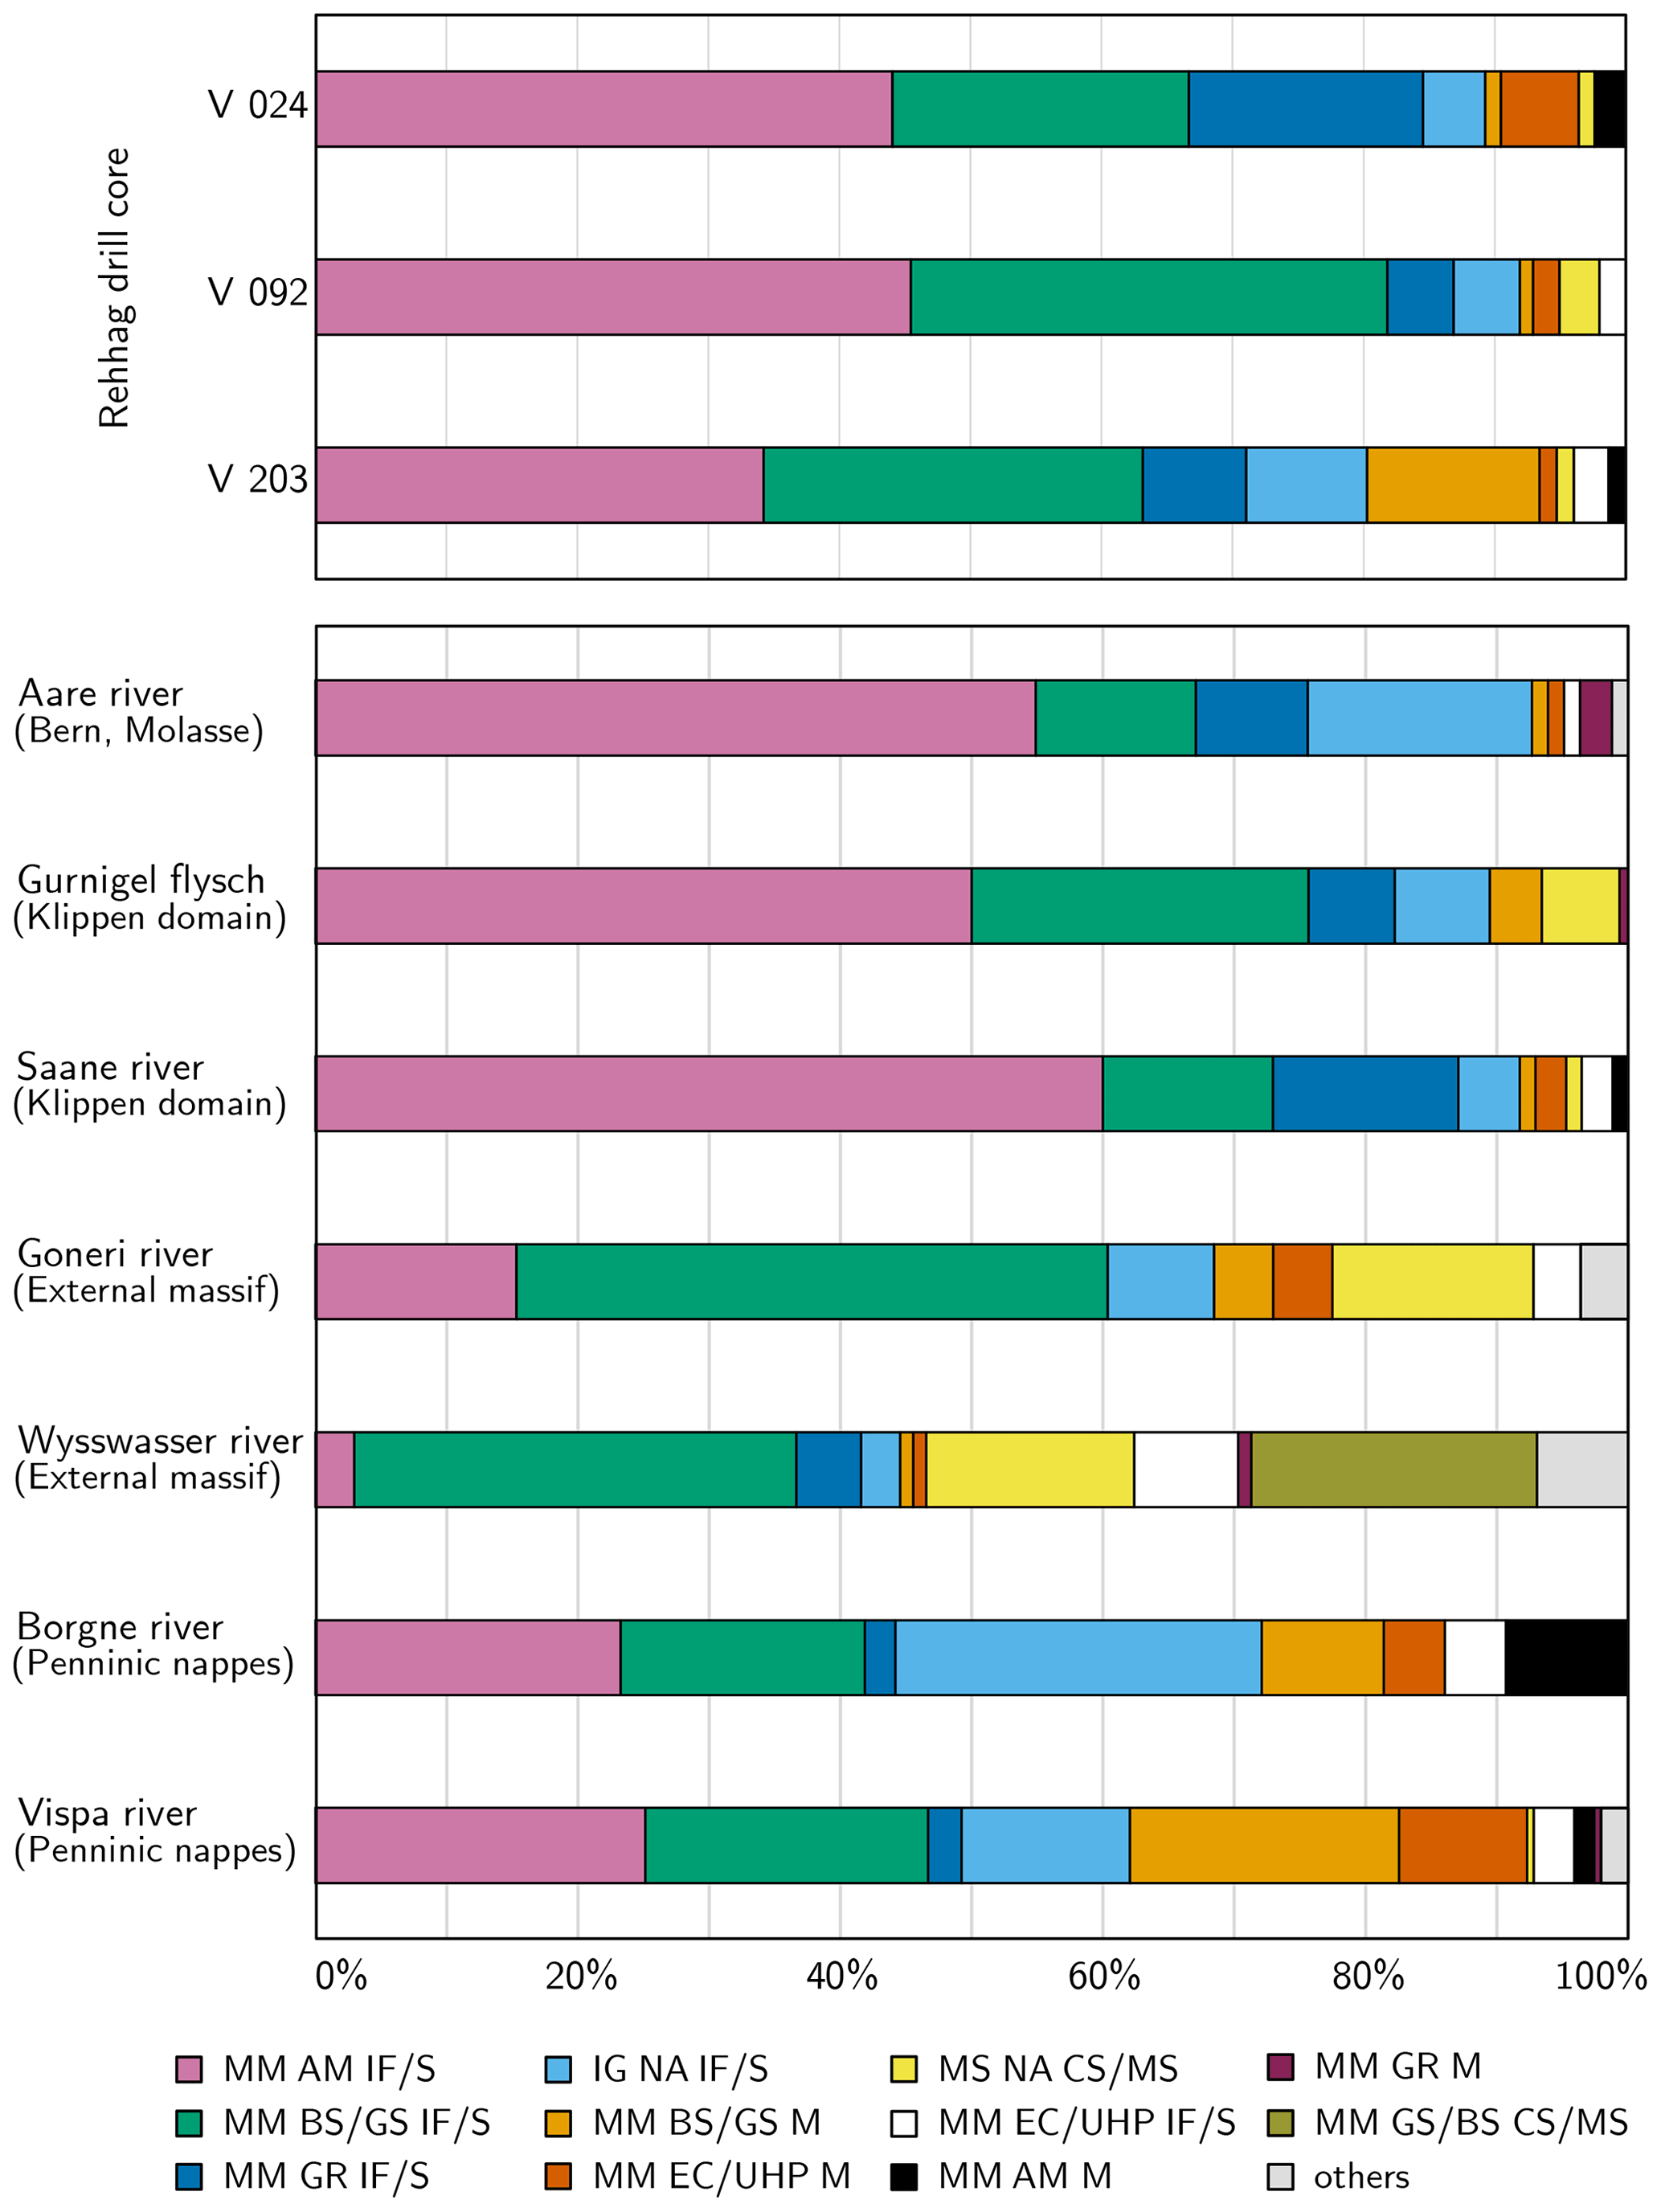
Figure 9Classification results of detrital garnet based on geochemistry in the core samples and seven reference tributaries located in the possible source rocks. The sampling depth of each of the core samples is shown in Fig. 5. The garnet classes are composed of the abbreviations of the three groups (host rock, metamorphic grade, and composition) as defined by Schönig et al. (2021); MM – metamorphic, IG – igneous, MS – metasomatic, AM – amphibolite facies, GR – granulite facies, BS/GS – blueschist/greenschist facies, EC/UHP – eclogite facies/ultrahigh-pressure, NA – not defined (for rocks without metamorphic overprint), M – mafic, IF/S – intermediate felsic/sedimentary, CS/MS – calcsilicate/metasomatic.
Figure 9 shows the results from the study of the single-grain garnet variety. In all three core samples, more than 60 % of garnets are derived from intermediate felsic/metasedimentary rocks of amphibolite and blue-/greenschist facies metamorphism (classes MM AM IF/S and MM BS/GS IF/S). From the base (V203) to the top (V024) of the core, the portion of eclogite facies metamorphic mafic garnet (MM EC/UHP M), as well as granulite facies metamorphic garnet (class MM GR IF/S), increases, whereas the amount of blue-/greenschist facies metamorphic mafic garnet (class MM BS/GS M) decreases.
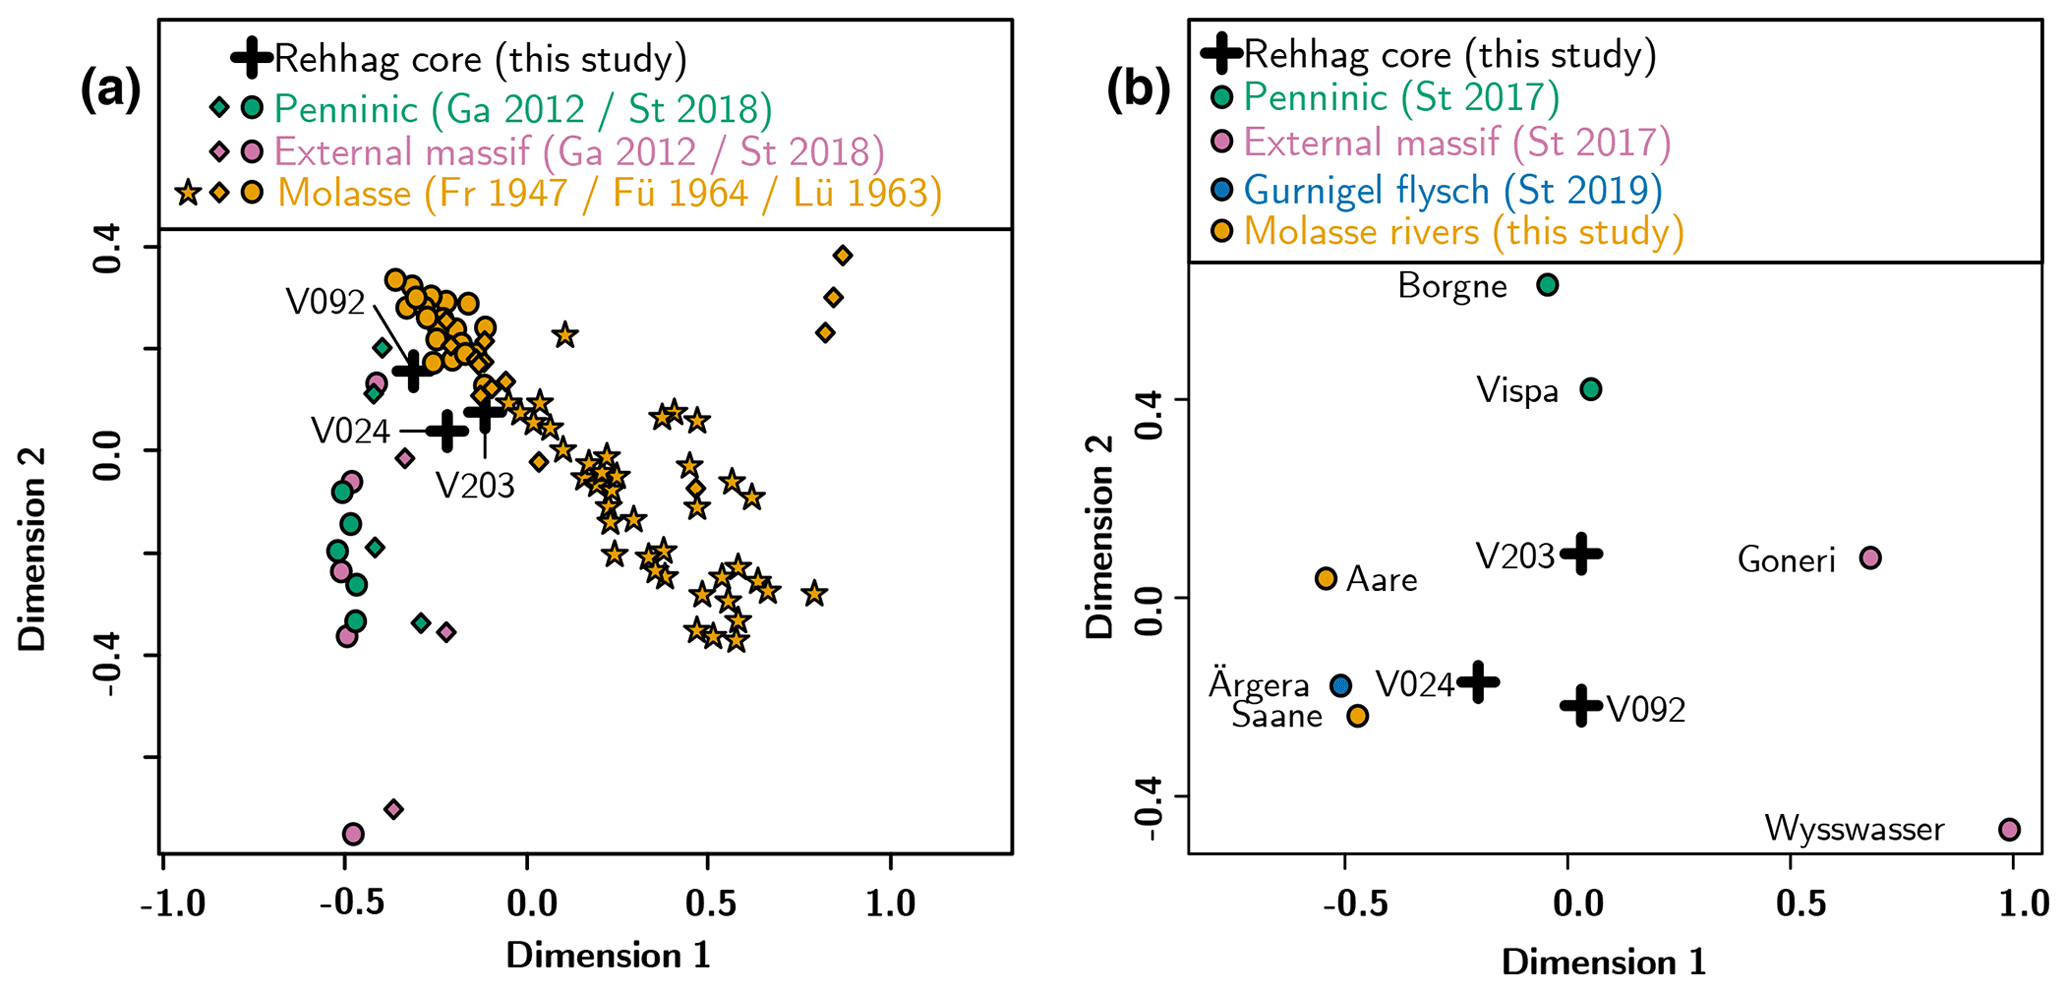
Figure 10Results of the multidimensional scaling (MDS) of (a) the heavy mineral composition and (b) the garnet geochemical composition of three core samples compared to a database aggregated from published literature (see Table 3). The sampling depth of each of the core samples is shown in Fig. 5. The abbreviations of the literature used refer to Ga 2012 – Garzanti et al. (2012); St 2017, 2018, 2019 – Stutenbecker et al. (2017, 2018, 2019); Fr 1947 – Frasson (1947); Fü 1964 – Füchtbauer (1964); Lü 1963 – Lüthy et al. (1963).
Figure 10 shows the similarity of our data and the literature data (Table 3) as obtained by multidimensional scaling. The comparison of heavy mineral data (Fig. 10a) shows that the three selected core samples plot close together and somewhat in between the two clusters formed by the local Molasse bedrock and the modern streams draining the External massifs and Penninic nappes. The Penninic and External heavy mineral signatures are similar, and the two lithotectonic units are therefore not distinguishable. The detrital garnet data (Fig. 10b), in contrast, allow a distinction of garnets derived from the three considered source units (External massifs, Penninic, Molasse/flysch). Sample V203 is equally similar to all three possible sources, sample V092 plots in between the External massifs and Molasse/flysch sources, and sample V024 is markedly more similar to the Molasse/flysch sources.
5.1 The selection of tributaries and variables for the unmixing model
The first approach yielded the combinations of most discriminative variables in each of the 52 processing data sets which in turn resulted in the observed clear distinction of the parent rock groups in the individual core samples and accordingly resulted in a very good fitting during the unmixing step (GOF 0.92). Although the trend in the sediment composition that was obtained using the second approach (Fig. 7a through d) is present in the unmixing results of the first approach (Fig. 7e), we disregard the results of the first approach as the solution appears to be overly specific to the individual core samples.
The choice of a distinct set of variables has an impact on the discrimination between the four domains of parent rocks (Fig. 6). In our case, however, the exclusion of specific variables or specific tributary data sets has no distinct advantage for the calculation of the relative composition in the unmixing process and for the calculated level of the unmixing results. This is visible in Fig. 7a through d and also in the minor changes in the GOF as presented in Table 4. In contrast, the unmixing results that were calculated from a reduced set of variables apparently were deprived of their potential to identify Penninic sources, as exemplified by the plots in Fig. 7a and b. Hence, we use the unmixing results from the complete data set (all variables and all tributaries; Figs. 6c, 7c, Table 2) in the following discussion.
5.2 Assessment of the geochemical data and the unmixing results
The unmixing results calculated from the complete set of available chemical data had an average GOF of 0.79. The highest GOF in all data sets which were compiled and analyzed with the second approach was 0.82. However, the dedicated selection of variables and tributaries had minor effects on the unmixing results. Moreover, the SiO2:Al2O3 ratio and the MS data correlate positively, which we regard as evidence that the sediment bulk chemical data in general are related to the sedimentary facies. Furthermore, the comparison of our unmixing results with provenance markers used by von Eynatten (2003) showed a good correlation. The positive correlation between the CaO:SiO2 ratio and both the relative contribution of the Helvetic component in the provenance signal and the measured carbonate content indicates that most of the carbonate in the sediment was probably derived from the Helvetic source rocks. Due to the absence of a correlation, the carbonate was not derived from the Klippen domain. A slight correlation between the MgO:SiO2 ratio and the abundance of the Helvetic component is present in Sequence A. However, in the deposits of Sequence B, where more material of Penninic and less detritus of Helvetic provenance were supplied, the MgO:SiO2 ratio is correlated to the abundance of the Penninic component. The positive correlation between material from Penninic sources and the MgO:SiO2 ratio in Sequence A should not be overstated due to the very low input from the Penninic domain. The weak positive correlation of the MgO:SiO2 ratio and the Klippen component indicates a low yet continuous contribution from the latter domain. In combination, this suggests that the MgO:SiO2 ratio reflects the input of material derived from dolomitic source rocks (Klippen, Helvetic) in Sequence A, yet in Sequence B the ratio might reflect a combined contribution of magnesium-rich minerals derived from the ophiolite-bearing bedrock that occurs in the Penninic domain and dolomitic source rocks mainly located in the Klippen domain (cf. von Eynatten, 2003). The positive correlation between the Na2O:SiO2 ratio and the relative abundance of the External component probably indicates that most of the sodium in the sediment mixture was derived from felsic and feldspar-rich granitoid parent rocks in the External massifs. Both the Cr2O3:Ba and the Ni:Ba ratios show a weak correlation with the abundance of the Penninic component in the provenance signal in Sequence B. Hence, we suggest that nickel and chromium in Sequence B were mainly derived from the ophiolite-bearing parent rocks in the Penninic units, where the ophiolitic bedrock is known to contain chrome spinel and Ni-rich serpentinites. As outlined above, the Cr2O3:Ni ratio in our data can apparently not be used as a proxy for the relative abundance of material derived from the flysch sediments in the Klippen domain. Generally, ratios between 1.2 and 3.5 can be considered as indicative of material derived from ultramafic and metabasaltic rocks located in the Penninic domain (see von Eynatten, 2003, and sources therein). However, the Cr2O3:Ni ratio does not show a particular trend or a correlation with the relative abundance of the Penninic component in the unmixing results. Accordingly, all but one of the geochemical proxies (i.e., compound ratios) that were used by von Eynatten (2003) to distinguish parent rock units in the central Swiss Alps could be used to distinguish between the four domains of parent rocks as material sources for the drilled core. This is a good indicator that the presented sediment bulk chemical data contain a provenance signal that is actually reflected by the unmixing results.
5.3 Provenance interpretation
Henceforth, we use the ice flow patterns of the LGM to infer the possible material composition that was transported by the Valais, the Saane, and the Aare glaciers. During the LGM, the ice streams were arranged in a way that probably impeded the supply of material from the External massifs in the upper Rhône Valley to the Bern area (Fig. 3). Hence, material of Penninic provenance could only be transported by the Valais Glacier, whereas material of External provenance, namely from the Aar Massif, could only have been provided by the Aare Glacier. Please note that the admixture of material derived from the Mont Blanc Massif to the sediment transported by the Valais Glacier would result in a signal that contains both an External and a Penninic component. As a consequence, for sections (such as Sequence A) where a Penninic signal is missing, we can confidently attribute the material derived from the External domain to the Aare Glacier. In the same sense, material from Helvetic sources was most likely also transported by the Aare Glacier as can be deduced from the abundance of this lithotectonic unit within the Aare catchment (Table 1). Therefore, we interpret the admixture of material from External and Penninic sources as evidence for the sediment supply by the Aare Glacier or the Valais Glacier, respectively. The Klippen domain could effectively contribute material to either ice stream; however, this part of the Alps was occupied by the Saane Glacier to a large extent during the LGM (Fig. 3). Consequently, this glacier is expected to transport a sediment mixture dominated by material of Klippen provenance (Table 1). Furthermore, reconstructions imply that in a full glacial setting such as during the LGM (Fig. 3) or any preceding glaciation, the Aare Glacier was pushed and deflected in a northeast direction upon its confluence with the Valais Glacier. In such a case, material from the Klippen domain could probably only be supplied by the Valais and mainly the Saane glaciers, and correspondingly a provenance signal from the Aare Valley would be missing in the sediment composition. Conversely, the absence of material of Penninic origin could indicate that the Valais Glacier did not advance to the Bern area and that material from Klippen sources was probably supplied by the Aare Glacier and mainly by the Saane Glacier. Finally, the bedrock that underlies the Quaternary succession at the Rehhag drill site consists of the Lower Freshwater Molasse (Schwenk et al., 2022), which is composed of the clastic sediment that was derived from the Klippen and the Penninic domains during the Late Oligocene and the Early Miocene (Schlunegger et al., 1993; Spiegel et al., 2002; von Eynatten, 2003; Anfinson et al., 2020). Therefore, it is likely that the distinction between a first-cycle Klippen and Penninic source signal and a Molasse signal is not straightforward if only the unmixing results are used.
However, heavy mineral analysis provides important insights into the role of Molasse recycling. Modern sediment supplied by most Alpine units, including the External massifs and Penninic nappes, carries abundant hornblende (usually 20 %–30 %; Garzanti et al., 2012; Stutenbecker et al., 2018). In contrast, hornblende rarely makes up more than 1 % of the heavy mineral spectra in the Swiss Molasse (Füchtbauer, 1964; Schlunegger et al., 1993; von Eynatten, 2003). The low percentage of hornblende in the lowermost core sample V203 indicates an important contribution from the hornblende-poor Molasse, which is confirmed by the overall similarity of its heavy mineral spectrum to that of the local bedrock in the Bern area (Fig. 10a). The higher hornblende content in the upper samples V092 and V024 (Fig. 8) points toward an increasingly important input of first-cycle sediment from hornblende-rich sources. Based on the heavy mineral data alone, the origin of this first-cycle detritus remains ambiguous, since the External massifs and Penninic nappes supply indistinguishable heavy mineral spectra (Fig. 10a; Stutenbecker et al., 2018). However, the similarity of the detrital garnet spectra (Fig. 10b) suggests that this first-cycle material in samples V092 and V024 was derived from the External massifs rather than from the Penninic nappes. Nevertheless, the garnet data suggest an evident contribution from (local) Molasse bedrock, especially in sample V024.
5.4 Combining the sedimentary processes and the provenance signals
Here, we combine information provided by the provenance signals with the sedimentary information elaborated by Schwenk et al. (2022) to develop a scenario of how the different glaciers contributed to the filling of the targeted trough.
5.4.1 Subglacial till in Sequence A
The geological history recorded by the sedimentary succession started with the deposition of the till assemblage at the base of Sequence A (FA 1.1), which shows the lowest admixture of the Helvetic and Klippen components and an apparent exceptional contribution of External and Penninic material. However we consider the Penninic signal as a record of recycled material derived from the Molasse bedrock and not as a first-cycle signal from the Central Alps on the basis of the heavy mineral spectra and the following three sedimentological observations (Schwenk et al., 2022): (i) the till beds overlying the bedrock contact (in FA 1.1) contain large rafts of the Lower Freshwater Molasse bedrock, (ii) the color of the till resembles that of the bedrock, and (iii) the FA1.1 sediments are depleted in carbonate content similar to the Molasse bedrock (Fig. 5; 0 %–20 %; Blaser et al., 1994). Furthermore, the large portion (> 45 %) of material from the External massifs encountered in the basal till of FA 1.1 suggests that this till was most likely supplied by the Aare Glacier and not by the Valais Glacier. Farther upsection, yet within the lower till assemblage (i.e., upper FA 1.1), where the sediment was probably deposited in subglacial conduits (Schwenk et al., 2022), the input from the Molasse bedrock apparently decreased. This section is similar in composition to the overlying assemblages.
5.4.2 Ice-contact fan deposits in Sequence A
The unmixing results show that the Aare Glacier was likely the main source of material during the deposition of the upper section of FA 1.1 and the deposition in the following proglacial lake setting recorded by FA 2 & 3. Overall, a stable background signal (> 25 %) related to the material supply of apparently Klippen provenance suggests that the sediment could have been supplied by the Aare Glacier, as well as by the Saane Glacier. Material supply to the lacustrine deposits by the Valais Glacier or input of detritus from the Molasse bedrock is unlikely due to the absence of a Penninic component in the provenance signal throughout most of FA 2 & 3. Isolated peaks pointing towards an occasional input of material with a Penninic origin and of more material with a Klippen origin (meters 175, 164, 153, 146, and 116 to 106) could indicate that a limited connection existed between the Bümpliz trough and the Valais Glacier, or alternatively it could point to an occasional supply of material from the surrounding Molasse bedrock. In general, the stable signal of Aare Valley provenance (Helvetic and External > 60 %) throughout FA 2 & 3 implies that the material supply was dominated by the initially retreating and then readvancing Aare Glacier.
5.4.3 Subglacial till in Sequence B
The Aare Glacier was also the ice stream that dominated the formation of the till assemblage (FA 1.2) at the base of Sequence B. In contrast to the underlying deposits of the ice-contact fan, this till contains a relatively large portion of material derived from the External massifs (> 40 %). Similar to the lower till, a Penninic contribution suggests an admixture of either Molasse material or material from the Valais Glacier. The heavy mineral spectra, as well as the detrital garnet data of sample V092, suggest no first-cycle Penninic source but rather a mixed contribution from External sources and Molasse recycling. We explain the stable Klippen background signal (> 25 %), which is also present in this assemblage, by the input of material through the Aare Glacier with a contribution from reworked sedimentary substratum. Combining the sedimentological evidence and the unmixing results, we suggest that the second till assemblage had most probably been formed by the Aare Glacier.
5.4.4 Lacustrine sediments in Sequence B
The provenance signal in the sediment of FA 4 is significantly different from the underlying assemblages. Within FA 4, the unmixing results imply material input from Helvetic and External sources which is > 50 % on average, and material from Klippen sources is at the highest level with an average of 38 %. Based on the occurrence of these three components, we interpret the material supply to have been strongly controlled by the Aare Glacier and the Saane Glacier. Furthermore, the highest admixture (ca. 10 %) of material with a Penninic origin in this section is most relevant because it could only have been supplied to the depositional site through the transport by the Valais Glacier or in response to a substantial increase in material derived from the Molasse bedrock. The heavy mineral and garnet data of sample V024 favor an origin from Molasse and possibly flysch sources in the Klippen domain that may have been supplied by the Saane Glacier.
5.5 Landscape evolution during the shallowing-up period of the Bümpliz trough
Because the Valais Glacier was not involved in the formation of the till at the base of Sequence A, we propose that the Aare Glacier was the dominant glacier in the Bern area. Accordingly, we envision a scenario in which the Valais Glacier had not reached the Bern area and did not deflect the Aare Glacier towards the northeast (Fig. 11a), which is different from the situation proposed for the LGM (Fig. 3; Favre, 1884; Baltzer, 1896; Bini et al., 2009; Ehlers et al., 2011).
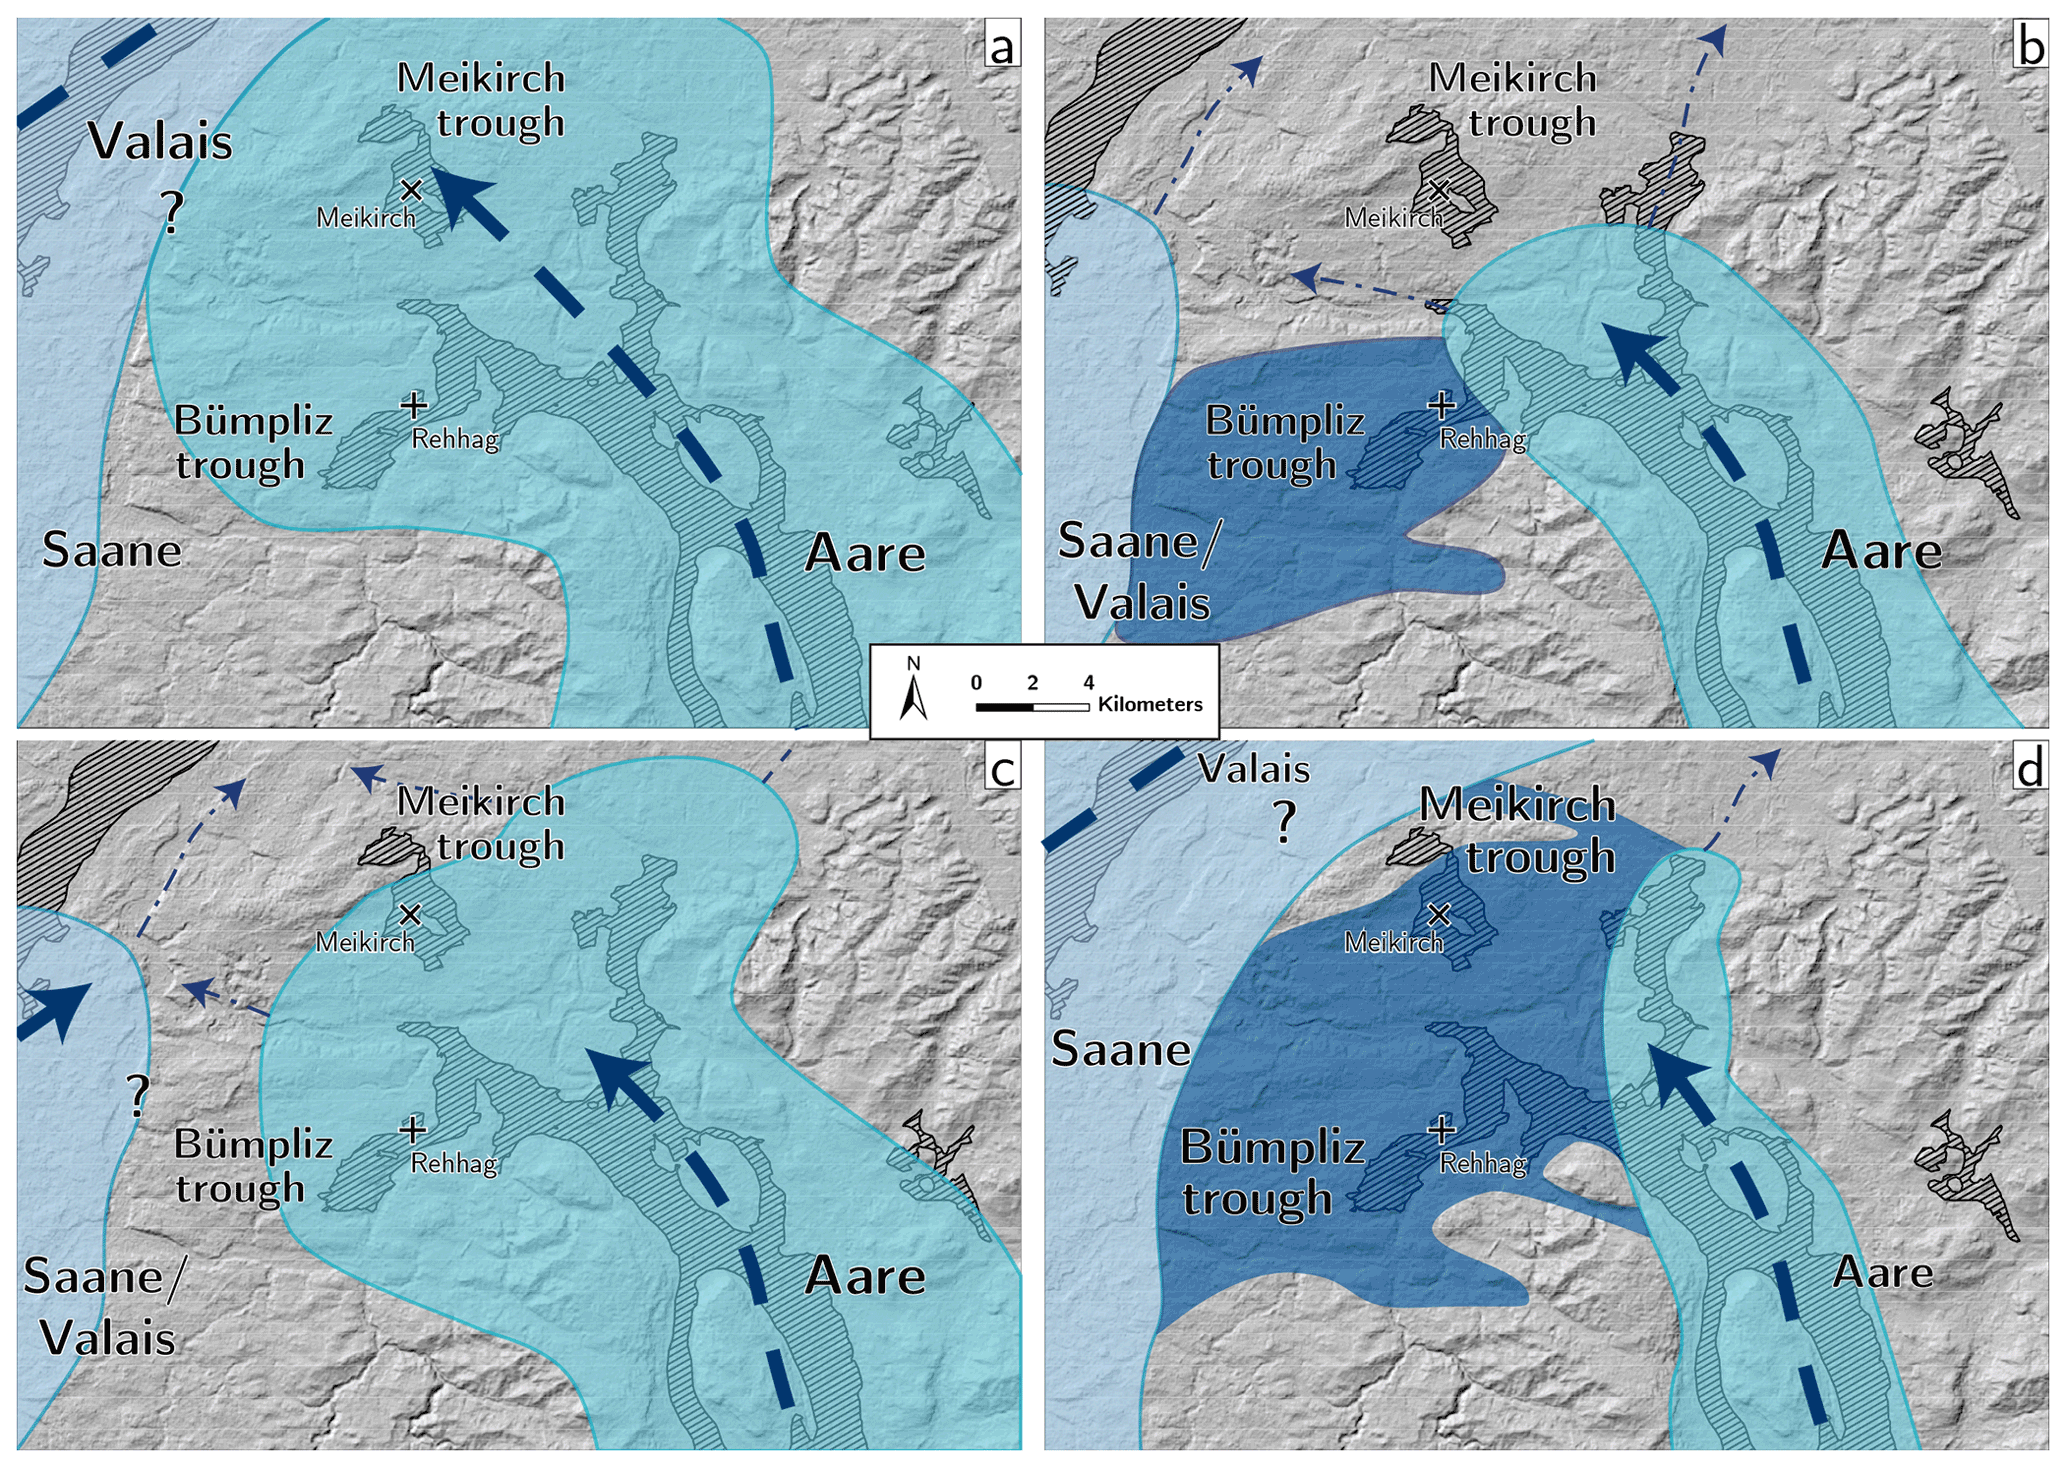
Figure 11Proposed distribution of glacier ice in the Bern area based on the presented provenance analysis. (a) The Bümpliz trough is covered entirely by the Aare Glacier during the first glacial advance (FA 1.1). (b) The Aare Glacier retreated from the Bümpliz trough, yet remained in very close proximity, which led to the formation of ice-contact fans and an almost exclusive supply of material by the Aare Glacier (FA 2 & 3). (c) Readvance of the Aare Glacier into the Bümpliz trough (FA 1.2). (d) Rearranged distribution of the glacier lobes, when water was effectively blocked to form a lake (Fig. 2) and when the sediment was mainly by the Aare Glacier and partially by the Saane Glacier (FA 4). Shaded black areas indicate the position of overdeepenings in the Bern area (available via Bundesamt für Landestopografie swisstopo, 2021a). Elevation data from NASA/METI/AIST/Japan Spacesystems and U.S./Japan ASTER Science Team (2019). Please refer to the text for a detailed discussion.
Following the retreat of the Aare Glacier the Bümpliz trough was filled with water forming a lake that remained in contact with the glacier (Fig. 11b). However, the Valais Glacier or the Saane Glacier probably was still present on the Swiss Plateau as far east as our study area (i) to block the Bümpliz trough allowing the temporary formation of an ice-dammed lake and thus (ii) to allow the deposition of lacustrine sediments in Sequence A. Furthermore, the observed very low TOC content corroborates this scenario of an ice-dominated landscape free of terrestrial or aquatic plant life.
After the small basin had been filled with sediment, supplied mainly by the Aare Glacier and partially by the Saane Glacier, the Aare Glacier must have readvanced into the Bümpliz trough once more. During this advance an unknown amount of sediment was removed, which resulted in the formation of the truncation surface between Sequences A and B. Because the till sequence overlying this truncation was formed again by the Aare Glacier, the glacial environment surrounding the Bümpliz trough was once more different from the situation during the LGM (see above and Fig. 11c). Additionally, the inference that the Aare Glacier readvanced into the Bümpliz trough during the deposition of Sequence A and that it also formed the basal till of Sequence B lets us suggest that Sequences A and B were formed during two glacial advances within the same glacial period.
Similar to the lower Sequence A, material supply by the Valais Glacier was minor or negligible during the deposition of Sequence B because heavy mineral and garnet data suggest that the Penninic component rather reflects a signal related to the recycling of the Molasse bedrock than a first-cycle signal. Nevertheless, we propose that the presence of the Valais Glacier in the study area was again, similar to the depositional environment proposed for Sequence A, a prerequisite to allow the formation of an ice-dammed lake which collected the meltwater of the adjacent ice streams (Fig. 11d). Potentially it was a single lake that spread out across the Bümpliz depression and that also occupied the Meikirch trough farther north. In fact, a late MIS 8 depositional age, based on luminescence dating, was suggested for a large suite of lacustrine deposits (ca. 40 m) within the sedimentary sequence in the Meikirch trough (Preusser et al., 2005). Considering the minimum depositional age between 250 to 300 ka (MIS 8; Schwenk et al., 2022) for the Bümpliz trough sequence, such a lacustrine connection between the two troughs seems possible.
In summary, the provenance data let us suggest that in the Bern area a LGM-like glacial setting of the glacier lobes had not been established during the period the investigated sedimentary sequence was deposited (ca. 250 to 300 ka, MIS 8; Preusser et al., 2005; Schwenk et al., 2022) because the evolution of the landscape in this region and the deposition of sediment was not dominated by the Valais Glacier but by the Aare Glacier.
Based on the results of the presented provenance analysis, we showed that glacier lobes in the Bern area were positioned in a different pattern during the MIS 8 glaciation than during the LGM. In particular, the dominance of material supplied by the Aare Glacier contradicts a scenario in which the Aare Glacier was deflected in a northeast direction by the Valais Glacier as was the case during the LGM. Furthermore, the provenance data provide additional evidence that the entire sedimentary sequence was deposited within a single glaciation yet during two separate glacial advances. Although the Valais Glacier had been present and could have supplied material occasionally, it might have never been relevant for the sediment supply during the deposition of the investigated sedimentary sequence. It appears that the Aare and the Saane glaciers were dominating the sediment supply towards the Bümpliz trough, when a larger area in the vicinity of the glacier lobes was occupied by a lake.
The results of our provenance analysis thus substantiate the findings of Reber and Schlunegger (2016) in that the positioning of glacier lobes in the Bern area during an earlier glaciation was different than during the LGM. As a consequence, these differences could have been caused by variations in climate that affected the ice accumulation in the central Swiss Alps. Hence, the presented results could be used to constrain future ice flow and erosion models that focus on pre-LGM glaciations and the formation of overdeepenings on the Swiss Plateau.
Methodologically, we showed that the sediment bulk chemical data obtained from a drill core allow the stratigraphic architecture to be reproduced, which in our case is an architecture that was previously established based on the sedimentological analysis of these sediments. Certainly, the presented study benefits from the fact that two glaciers with sources in two lithologically different parts of the central Swiss Alps supplied the investigated sediment. Nevertheless, after the large-scale domains of potential parent rocks are identified, the bulk chemical data alone offer a strong fingerprinting proxy based on which the sediment provenance in drill cores can be determined, which then offers the basis to improve our understanding of how the landscape surrounding the drill site has evolved. Where the above prerequisites are met, it seems plausible that the presented workflow offers a robust, fast, and affordable way to determine changes in the sediment provenance for the fine-grained sedimentary infill of overdeepenings or for other glacial deposits. Potentially, the resolution of such provenance results is suitable to correlate sedimentary sequences across multiple boreholes apart from determining the depositional age of the recovered sediment.

Figure A1Different correlation plots showing the relation between the unmixing results and compound ratios used by von Eynatten (2003) and displayed in Fig. 5. The data were normalized, and the displayed trends were fitted with a first-degree polynomial.
The petrochemical data and the R script used for their analysis are provided in the Supplement. The results of the heavy mineral and garnet analyses are also available in the Supplement.
The supplement related to this article is available online at: https://doi.org/10.5194/egqsj-71-163-2022-supplement.
MAS collected and prepared the samples, analyzed the petrochemical data, and wrote the paper with support from FS. LS provided the heavy mineral and garnet measurements and the respective sections in the text, as well as helped with the analysis of the petrochemical data. MAS designed the core and field sampling campaign, and FS organized the funding. PS helped with the core sampling and the statistical analyses, and DB helped with field work, sample preparation, and improving the R script. All authors approved the text and the figures.
The contact author has declared that none of the authors has any competing interests.
Publisher's note: Copernicus Publications remains neutral with regard to jurisdictional claims in published maps and institutional affiliations.
We acknowledge the friendly support and sample analyses by Bureau Veritas (CA). We thank the editor in charge, Gilles Rixhon, and two reviewers, Andreas Dehnert and Christoph Mayr, for helping improve our manuscript.
This research has been supported by the Schweizerischer Nationalfonds zur Förderung der Wissenschaftlichen Forschung (grant no. 175555).
This paper was edited by Gilles Rixhon and reviewed by Andreas Dehnert and Christoph Mayr.
Andò, S.: Gravimetric Separation of Heavy Minerals in Sediments and Rocks, Minerals, 10, 273, https://doi.org/10.3390/min10030273, 2020. a
Anfinson, O. A., Stockli, D. F., Miller, J. C., Möller, A., and Schlunegger, F.: Tectonic exhumation of the Central Alps recorded by detrital zircon in the Molasse Basin, Switzerland, Solid Earth, 11, 2197–2220, https://doi.org/10.5194/se-11-2197-2020, 2020. a, b
Bachmann, I.: Die Kander im Berner Oberland ein ehemaliges Gletscher- und Flussgebiet, Dalp'sche Buch- und Kunsthandlung, Bern, 1870. a
Baltzer, A.: Der diluviale Aargletscher und seine Ablagerungen in der Gegend von Bern mit Berücksichtigung des Rhonegletschers, in: Der diluviale Aargletscher und seine Ablagerungen in der Gegend von Bern mit Berücksichtigung des Rhonegletschers, Beiträge zur Geologischen Karte der Schweiz Lieferung 30, Schmid, Francke & Co., Bern, 1896. a, b, c, d, e
Bandou, D., Schlunegger, F., Kissling, E., Marti, U., Schwenk, M., Schläfli, P., Douillet, G., and Mair, D.: Three-dimensional gravity modelling of a Quaternary overdeepening fill in the Bern area of Switzerland discloses two stages of glacial carving, Sci. Rep., 12, 1441, https://doi.org/10.1038/s41598-022-04830-x, 2022. a
Beck, P.: Bericht über die ausserordentliche Frühjahrsversammlung der Schweizerischen Geologischen Gesellschaft in Thun, Eclogae Geol. Helv., 31, 173–197, https://doi.org/10.5169/seals-159820, 1938. a
Becker, P., Seguinot, J., Jouvet, G., and Funk, M.: Last Glacial Maximum precipitation pattern in the Alps inferred from glacier modelling, Geogr. Helv., 71, 173–187, https://doi.org/10.5194/gh-71-173-2016, 2016. a
Becker, P., Funk, M., Schlüchter, C., and Hutter, K.: A study of the Würm glaciation focused on the Valais region (Alps), Geogr. Helv., 72, 421–442, https://doi.org/10.5194/gh-72-421-2017, 2017. a, b, c
Berger, J.-P., Reichenbacher, B., Becker, D., Grimm, M., Grimm, K., Picot, L., Storni, A., Pirkenseer, C., and Schaefer, A.: Eocene-Pliocene time scale and stratigraphy of the Upper Rhine Graben (URG) and the Swiss Molasse Basin (SMB), Int. J. Earth Sci., 94, 711–731, https://doi.org/10.1007/s00531-005-0479-y, 2005. a
Bini, A., Buoncristiani, J., Couterrand, S., Ellwanger, D., Felber, M., Florineth, D., Graf, H., Keller, O., Kelly, M., and Schlüchter, C.: Die Schweiz während des letzteiszeitlichen Maximums (LGM) (1 : 500 000), Bundesamt für Landestopografie swisstopo, Bern–Wabern, ISBN 978-3-302-40049-5, 2009. a, b, c, d, e
Blaser, P., Gubler, T., Küpfer, T., Marschall, P., Matter, A., Matyas, J., Meier, B., Müller, W., Schlanke, S., Schlunegger, F., Siber, N., and Wyss, E.: Geothermiebohrung Bassersdorf. Charakterisierung der Oberen Meeresmolasse und Unteren Süsswassermolasse, Tech. Rep. NTB 94-01, Nagra, Wettingen, https://www.nagra.ch/de/technischer-bericht-94-01 (last access: 17 August 2022), 1994. a
Braakhekke, J., Ivy-Ochs, S., Monegato, G., Gianotti, F., Martin, S., Casale, S., and Christl, M.: Timing and flow pattern of the Orta Glacier (European Alps) during the Last Glacial Maximum, Boreas, 49, 315–332, https://doi.org/10.1111/bor.12427, 2020. a
Buechi, M. W., Frank, S. M., Graf, H. R., Menzies, J., and Anselmetti, F. S.: Subglacial emplacement of tills and meltwater deposits at the base of overdeepened bedrock troughs, Sedimentology, 64, 658–685, https://doi.org/10.1111/sed.12319, 2017. a
Bundesamt für Landestopografie swisstopo: Höhenmodell der Felsoberfläche, Bundesamt für Landestopografie swisstopo, https://www.swisstopo.admin.ch/de/geodata/geology/models/bedrock-elevation.html, last access: 3 November 2021a. a, b, c
Bundesamt für Landestopografie swisstopo: Tektonische Karte der Schweiz 1 : 500 000, Bundesamt für Landestopografie swisstopo, https://data.geo.admin.ch/ch.swisstopo.geologie-tektonische_karte/, last access: 3 November 2021b. a
Busfield, M. E., Lee, J. R., Riding, J. B., Zalasiewicz, J., and Lee, S. V.: Pleistocene till provenance in east Yorkshire: reconstructing ice flow of the British North Sea Lobe, P. Geologist. Assoc., 126, 86–99, https://doi.org/10.1016/j.pgeola.2014.12.002, 2015. a
Cook, S. J. and Swift, D. A.: Subglacial basins: Their origin and importance in glacial systems and landscapes, Earth-Sci. Rev., 115, 332–372, https://doi.org/10.1016/j.earscirev.2012.09.009, 2012. a
Ehlers, J., Gibbard, P. L., and Hughes, P. D. (Eds.): Supplementary data to Quaternary Glaciations – Extent and Chronology – A Closer Look, in: Developments in Quaternary Sciences, Elsevier, https://booksite.elsevier.com/9780444534477/ (last access: 26 November 2021), 2011. a, b, c, d
Favre, A.: Carte du phénomène erratique et des anciens glaciers du versant nord des Alpes suisses et de la chaîne du Mont-Blanc, Archives des sciences physiques et naturelles, A Cherbuliez, Geneva, 12, 1884. a, b, c, d, e
Florineth, D. and Schlüchter, C.: Alpine evidence for atmospheric circulation patterns in Europe during the Last Glacial Maximum, Quaternary Res., 54, 295–308, https://doi.org/10.1006/qres.2000.2169, 2000. a
Frasson, B. A.: Geologie der Umgebung von Schwarzenburg (Kanton Bern), Beiträge zur Geologischen Karte der Schweiz – Neue Folge, vol. 88, 62 pp., Kümmerli & Frey AG, Bern, Switzerland, 1947. a, b
Füchtbauer, H.: Sedimentpetrographische Untersuchungen in der älteren Molasse nördlich der Alpen, Eclogae Geol. Helv., 57, 157–298, https://doi.org/10.5169/seals-163140, 1964. a, b, c
Garzanti, E. and Andò, S.: Chapter 20 Heavy Mineral Concentration in Modern Sands: Implications for Provenance Interpretation, in: Heavy Minerals in Use, edited by: Mange, M. A. and Wright, D. T., vol. 58 of Developments in Sedimentology, Elsevier, 517–545, https://doi.org/10.1016/S0070-4571(07)58020-9, 2007. a, b
Garzanti, E. and Andò, S.: Heavy Minerals for Junior Woodchucks, Minerals, 9, 148, https://doi.org/10.3390/min9030148, 2019. a
Garzanti, E., Resentini, A., Vezzoli, G., Andò, S., Malusà, M., and Padoan, M.: Forward compositional modelling of Alpine orogenic sediments, Sediment. Geol., 280, 149–164, https://doi.org/10.1016/j.sedgeo.2012.03.012, 2012. a, b, c, d, e, f, g
Gasser, U. and Nabholz, W.: Zur Sedimentologie der Sandfraktion im Pleistozän des schweizerischen Mittellandes, Eclogae Geol. Helv., 62, 467–516, https://doi.org/10.5169/seals-163708, 1969. a, b
Gerber, E.: Einige Querprofile durch das Aaretal mit Berücksichtigung der letzten Bohrungen und Tunnelbauten, Mitteilungen der Naturforschenden Gesellschaft Bern, XXIV–XXXI, 1923. a
Gilliéron, V.: Description géologique des territoires de Vaud, Fribourg et Berne, in: Description géologique des territoires de Vaud, Fribourg et Berne compris dans la feuille XII entre le lac de Neuchâtel et la crête du Niesen, Matériaux pour la carte géologique de la Suisse Livraison 18, Schmid, Francke & Co., Berne, 1885. a
Giorgetti, G., Talarico, F., Sandroni, S., and Zeoli, A.: Provenance of Pleistocene sediments in the ANDRILL AND-1B drillcore: Clay and heavy mineral data, Global Planet. Change, 69, 94–102, https://doi.org/10.1016/j.gloplacha.2009.03.018, 2009. a
Graf, A., Akçar, N., Ivy-Ochs, S., Strasky, S., Kubik, P. W., Christl, M., Burkhard, M., Wieler, R., and Schlüchter, C.: Multiple advances of Alpine glaciers into the Jura Mountains in the Northwestern Switzerland, Swiss J. Geosci., 108, 225–238, https://doi.org/10.1007/s00015-015-0195-y, 2015. a
Graf, H. R.: Die Deckenschotter der zentralen Nordschweiz, PhD thesis, ETH Zürich, Zürich, Switzerland, 187 pp., https://doi.org/10.3929/ethz-a-000899302, 1993. a
Hänni, R. and Pfiffner, O.-A.: Evolution and internal structure of the Helvetic nappes in the Bernese Oberland, Eclogae Geol. Helv., 94, 161–171, https://doi.org/10.5169/seals-168886, 2001. a
Institut für Geologie, Universität Bern and Bundesamt für Wasser und Geologie: Tektonische Karte der Schweiz 1 : 500 000 = Carte tectonique de la Suisse 1 :500 000, Institut für Geologie, Universität Bern and Bundesamt für Wasser und Geologie, ISBN 3-906723-56-9, 2005. a
Jouvet, G., Seguinot, J., Ivy-Ochs, S., and Funk, M.: Modelling the diversion of erratic boulders by the Valais Glacier during the last glacial maximum, J. Glaciol., 63, 487–498, https://doi.org/10.1017/jog.2017.7, 2017. a, b, c, d
Kelly, M. A., Buoncristiani, J.-F., and Schlüchter, C.: A reconstruction of the last glacial maximum (LGM) ice-surface geometry in the western Swiss Alps and contiguous Alpine regions in Italy and France, Eclogae Geol. Helv., 97, 57–75, https://doi.org/10.1007/s00015-004-1109-6, 2004. a, b, c
Kjær, K. H., Houmark-Nielsen, M., and Richardt, N.: Ice-flow patterns and dispersal of erratics at the southwestern margin of the last Scandinavian Ice Sheet: signature of palaeo-ice streams, Boreas, 32, 130–148, https://doi.org/10.1111/j.1502-3885.2003.tb01434.x, 2003. a
Kruskal, W. H. and Wallis, W. A.: Use of Ranks in One-Criterion Variance Analysis, J. Am. Stat. Assoc., 47, 583–621, https://doi.org/10.1080/01621459.1952.10483441, 1952. a
Larsen, D. J., Miller, G. H., Áslaug Geirsdóttir, and Thordarson, T.: A 3000-year varved record of glacier activity and climate change from the proglacial lake Hvítárvatn, Iceland, Quaternary Sci. Rev., 30, 2715–2731, https://doi.org/10.1016/j.quascirev.2011.05.026, 2011. a
Lizaga, I., Gaspar, L., Blake, W. H., Latorre, B., and Navas, A.: Fingerprinting changes of source apportionments from mixed land uses in stream sediments before and after an exceptional rainstorm event, Geomorphology, 341, 216–229, https://doi.org/10.1016/j.geomorph.2019.05.015, 2019. a
Lizaga, I., Latorre, B., Gaspar, L., and Navas, A.: FingerPro: an R Package for Tracking the Provenance of Sediment, Water Resour. Manage., 34, 3879–3894, https://doi.org/10.1007/s11269-020-02650-0, 2020. a, b, c, d
Lüthy, H., Matter, A., and Nabholz, W. K.: Sedimentologische Untersuchung eines temporären Quartäraufschlusses bei der Neubrügg nördlich Bern, Eclogae Geol. Helv., 56, 119–145, https://doi.org/10.5169/seals-163032, 1963. a, b
Meyers, P. A. and Teranes, J. L.: Sediment Organic Matter, Springer Netherlands, Dordrecht, 239–269, https://doi.org/10.1007/0-306-47670-3_9, 2001. a
Monien, D., Kuhn, G., von Eynatten, H., and Talarico, F. M.: Geochemical provenance analysis of fine-grained sediment revealing Late Miocene to recent Paleo-Environmental changes in the Western Ross Sea, Antarctica, Global Planet. Change, 96-97, 41–58, https://doi.org/10.1016/j.gloplacha.2010.05.001, 2012. a
Morton, A. C.: A new approach to provenance studies: electron microprobe analysis of detrital garnets from Middle Jurassic sandstones of the northern North Sea, Sedimentology, 32, 553–566, https://doi.org/10.1111/j.1365-3091.1985.tb00470.x, 1985. a
NASA/METI/AIST/Japan Spacesystems and U.S./Japan ASTER Science Team: ASTER Global Digital Elevation Model V003, LPDAAC Data Pool [data set], https://doi.org/10.5067/ASTER/ASTGTM.003, 2019. a, b, c, d, e
Pawlowsky-Glahn, V. and Egozcue, J. J.: Compositional data and their analysis: an introduction, Geological Society, London, Special Publications, 264, 1–10, https://doi.org/10.1144/GSL.SP.2006.264.01.01, 2006. a
Pompilio, M., Dunbar, N., Gebhardt, A. C., Helling, D., Kuhn, G., Kyle, P., McKay, R., Talarico, F., Tulaczyk, S., Vogel, S., Wilch, T., and the ANDRILL-MIS Science Team: Petrology and Geochemistry of the AND-1B Core, ANDRILL McMurdo Ice Shelf Project, Antarctica, Terra Antartica, 14, 255–288, 2007. a
Preusser, F., Drescher-Schneider, R., Fiebig, M., and Schlüchter, C.: Re-interpretation of the Meikirch pollen record, Swiss Alpine Foreland, and implications for Middle Pleistocene chronostratigraphy, J. Quaternary Sci., 20, 607–620, https://doi.org/10.1002/jqs.930, 2005. a, b, c, d
Preusser, F., Reitner, J. M., and Schlüchter, C.: Distribution, geometry, age and origin of overdeepened valleys and basins in the Alps and their foreland, Swiss J. Geosci., 103, 407–426, https://doi.org/10.1007/s00015-010-0044-y, 2010. a, b
Preusser, F., Graf, H. R., Keller, O., Krayss, E., and Schlüchter, C.: Quaternary glaciation history of northern Switzerland, E&G Quaternary Sci. J., 60, 21, https://doi.org/10.3285/eg.60.2-3.06, 2011. a, b
R Core Team: R: A Language and Environment for Statistical Computing, R Foundation for Statistical Computing, Vienna, Austria, https://www.R-project.org/, last access: 17 August 2022. a
Reber, R. and Schlunegger, F.: Unravelling the moisture sources of the Alpine glaciers using tunnel valleys as constraints, Terra Nova, 28, 202–211, https://doi.org/10.1111/ter.12211, 2016. a, b, c, d, e
Reber, R., Akçar, N., Ivy-Ochs, S., Tikhomirov, D., Burkhalter, R., Zahno, C., Lüthold, A., Kubik, P. W., Vockenhuber, C., and Schlüchter, C.: Timing of retreat of the Reuss Glacier (Switzerland) at the end of the Last Glacial Maximum, Swiss J. Geosci., 107, 293–307, https://doi.org/10.1007/s00015-014-0169-5, 2014. a, b
Sandroni, S. and Talarico, F. M.: The record of Miocene climatic events in AND-2A drill core (Antarctica): Insights from provenance analyses of basement clasts, Global Planet. Change, 75, 31–46, https://doi.org/10.1016/j.gloplacha.2010.10.002, 2011. a, b
Schlunegger, F., Matter, A., and Mange, M. A.: Alluvial fan sedimentation and structure of the southern Molasse Basin margin, Lake Thun area, Switzerland, Eclogae Geol. Helv., 86, 717–750, https://doi.org/10.5169/seals-167260, 1993. a, b, c
Schlunegger, F., Burbank, D., Matter, A., Engesser, B., and Mödden, C.: Magnetostratigraphic calibration of the Oligocene to Middle Miocene (30–15 Ma) mammal biozones and depositional sequences of the Swiss Molasse Basin, Eclogae Geol. Helv., 89, 753–788, https://doi.org/10.5169/seals-167923, 1996. a
Schläfli, P., Gobet, E., van Leeuwen, J. F., Vescovi, E., Schwenk, M. A., Bandou, D., Douillet, G. A., Schlunegger, F., and Tinner, W.: Palynological investigations reveal Eemian interglacial vegetation dynamics at Spiezberg, Bernese Alps, Switzerland, Quaternary Sci. Rev., 263, 106975, https://doi.org/10.1016/j.quascirev.2021.106975, 2021. a
Schlüchter, C.: The most complete quaternary record of the Swiss Alpine Foreland, Palaeogeogr. Palaeocl., 72, 141–146, https://doi.org/10.1016/0031-0182(89)90138-7, 1989. a
Schmid, S. M., Fügenschuh, B., Kissling, E., and Schuster, R.: Tectonic map and overall architecture of the Alpine orogen, Eclogae Geol. Helv., 97, 93–117, https://doi.org/10.1007/s00015-004-1113-x, 2004. a, b
Schönig, J., von Eynatten, H., Tolosana-Delgado, R., and Meinhold, G.: Garnet major-element composition as an indicator of host-rock type: a machine learning approach using the random forest classifier, Contrib. Mineral. Petr., 176, 98, https://doi.org/10.1007/s00410-021-01854-w, 2021. a, b
Schwenk, M. A., Schlunegger, F., Gribenski, N., Schläfli, P., Bandou, D., Douillet, G. A., and Krbanjevic, J.: Stratigraphic and Multi Scanner Core Logging (MSCL) data plus supplementary luminescence dating material obtained from the scientific drilling QDR-RE-IfG and its drill site in the Aare Valley, Bern, Switzerland, GFZ Data Services [data set], https://doi.org/10.5880/fidgeo.2021.021, 2021. a
Schwenk, M. A., Schläfli, P., Bandou, D., Gribenski, N., Douillet, G. A., and Schlunegger, F.: From glacial erosion to basin overfill: a 240 m-thick overdeepening–fill sequence in Bern, Switzerland, Sci. Dril., 30, 17–42, https://doi.org/10.5194/sd-30-17-2022, 2022. a, b, c, d, e, f, g, h, i, j, k, l, m, n, o
Seguinot, J., Ivy-Ochs, S., Jouvet, G., Huss, M., Funk, M., and Preusser, F.: Modelling last glacial cycle ice dynamics in the Alps, The Cryosphere, 12, 3265–3285, https://doi.org/10.5194/tc-12-3265-2018, 2018. a
Sinclair, H. D. and Allen, P. A.: Vertical versus horizontal motions in the Alpine orogenic wedge: stratigraphic response in the foreland basin, Basin Res., 4, 215–232, https://doi.org/10.1111/j.1365-2117.1992.tb00046.x, 1992. a
Spiegel, C., Kuhlemann, J., Dunkl, I., Frisch, W., Von Eynatten, H., and Balogh, K.: The erosion history of the Central Alps: evidence from zircon fission track data of the foreland basin sediments, Terra Nova, 12, 163–170, https://doi.org/10.1046/j.1365-3121.2000.00289.x, 2000. a
Spiegel, C., Kuhlemann, J., Dunkl, I., and Frisch, W.: Paleogeography and catchment evolution in a mobile orogenic belt: the Central Alps in Oligo–Miocene times, Tectonophysics, 341, 33–47, https://doi.org/10.1016/S0040-1951(01)00187-1, 2001. a
Spiegel, C., Siebel, W., Frisch, W., and Berner, Z.: Nd and Sr isotopic ratios and trace element geochemistry of epidote from the Swiss Molasse Basin as provenance indicators: implications for the reconstruction of the exhumation history of the Central Alps, Chem. Geol., 189, 231–250, https://doi.org/10.1016/S0009-2541(02)00132-8, 2002. a, b
Stampfli, G. M.: Tethyan oceans, Geological Society, London, Special Publications, 173, 1–23, https://doi.org/10.1144/GSL.SP.2000.173.01.01, 2000. a
Strunck, P. and Matter, A.: Depositional evolution of the western Swiss Molasse, Eclogae Geol. Helv., 95, 197–222, https://doi.org/10.5169/seals-168955, 2002. a, b, c
Stutenbecker, L., Berger, A., and Schlunegger, F.: The potential of detrital garnet as a provenance proxy in the Central Swiss Alps, Sediment. Geol., 351, 11–20, https://doi.org/10.1016/j.sedgeo.2017.02.002, 2017. a, b, c, d
Stutenbecker, L., Delunel, R., Schlunegger, F., Silva, T. A., Šegvić, B., Girardclos, S., Bakker, M., Costa, A., Lane, S. N., Loizeau, J.-L., Molnar, P., Akçar, N., and Christl, M.: Reduced sediment supply in a fast eroding landscape? A multi-proxy sediment budget of the upper Rhône basin, Central Alps, Sediment. Geol., 375, 105–119, https://doi.org/10.1016/j.sedgeo.2017.12.013, 2018. a, b, c, d, e, f, g, h, i, j, k, l, m, n, o, p, q
Stutenbecker, L., Tollan, P. M. E., Madella, A., and Lanari, P.: Miocene basement exhumation in the Central Alps recorded by detrital garnet geochemistry in foreland basin deposits, Solid Earth, 10, 1581–1595, https://doi.org/10.5194/se-10-1581-2019, 2019. a, b, c, d
Tatzel, M., Dunkl, I., and von Eynatten, H.: Provenance of Palaeo-Rhine sediments from zircon thermochronology, geochemistry, U Pb dating and heavy mineral assemblages, Basin Res., 29, 396–417, https://doi.org/10.1111/bre.12155, 2017. a
Vale, S. S., Fuller, I. C., Procter, J. N., Basher, L. R., and Smith, I. E.: Application of a confluence-based sediment-fingerprinting approach to a dynamic sedimentary catchment, New Zealand, Hydrol. Process., 30, 812–829, https://doi.org/10.1002/hyp.10611, 2016. a
Vermeesch, P. and Garzanti, E.: Making geological sense of “Big Data” in sedimentary provenance analysis, Chem. Geol., 409, 20–27, https://doi.org/10.1016/j.chemgeo.2015.05.004, 2015. a
Vermeesch, P., Resentini, A., and Garzanti, E.: An R package for statistical provenance analysis, Sediment. Geol., 336, 14–25, https://doi.org/10.1016/j.sedgeo.2016.01.009, 2016. a, b, c
von Eynatten, H.: Petrography and chemistry of sandstones from the Swiss Molasse Basin: an archive of the Oligocene to Miocene evolution of the Central Alps, Sedimentology, 50, 703–724, https://doi.org/10.1046/j.1365-3091.2003.00571.x, 2003. a, b, c, d, e, f, g, h, i, j, k, l, m, n
Welten, M.: Pollenanalytische Untersuchungen im Jüngeren Quartär des nördlichen Alpenvorlandes der Schweiz, Beiträge zur Geologischen Karte der Schweiz-Neue Folge, 156, 210 pp., 1982. a
Welten, M.: Neue pollenanalytische Ergebnisse über das Jüngere Quartär des nördlichen Alpenvorlandes der Schweiz (Mittel- und Jungpleistozän), Beiträge zur Geologischen Karte der Schweiz-Neue Folge, 162, 52 pp., 1988. a
Weltje, G. J. and von Eynatten, H.: Quantitative provenance analysis of sediments: review and outlook, Sediment. Geol., 171, 1–11, https://doi.org/10.1016/j.sedgeo.2004.05.007, 2004. a, b, c
Wildi, W.: Heavy mineral distribution and dispersal pattern in penninic and ligurian flysch basins (Alps, northern Apennines), Giornale di Geologia, 47, 77–99, 1985. a
Wissing, S. and Pfiffner, O.-A.: Structure of the eastern Klippen nappe (BE, FR): Implications for its Alpine tectonic evolution, Eclogae Geol. Helv., 95, 381–398, https://doi.org/10.5169/seals-168966, 2002. a
Ziegler, P. A. and Fraefel, M.: Response of drainage systems to Neogene evolution of the Jura fold-thrust belt and Upper Rhine Graben, Swiss J. Geosci., 102, 57–75, https://doi.org/10.1007/s00015-009-1306-4, 2009. a