the Creative Commons Attribution 4.0 License.
the Creative Commons Attribution 4.0 License.
 | 18 Feb 2025
Iterative outlier identification for robust cosmogenic 26Al∕10Be burial dating of fluvial terraces: a case study from the Danube River (Vienna Basin, Austria)
Zsófia Ruszkiczay-Rüdiger
Stephanie Neuhuber
Esther Hintersberger
Ruszkiczay-Rüdiger, Z., Neuhuber, S., Hintersberger, E., and Nørgaard, J.: Iterative outlier identification for robust cosmogenic burial dating of fluvial terraces: a case study from the Danube River (Vienna Basin, Austria), E&G Quaternary Sci. J., 74, 59–78, https://doi.org/10.5194/egqsj-74-59-2025, 2025.
The burial age of a fluvial terrace of the Danube River in the central Vienna Basin (Austria) was determined using the cosmogenic radionuclides (CRNs) 26Al and 10Be. The terrace is located in an uplifted block on the eastern side of the Vienna Basin Transform Fault.
The influence of potential outliers on the burial age and the robustness of their identification was tested. For this purpose, a previously published dataset from two different subsurface depth levels of a gravel pit was used. These two independent datasets share the same post-burial history (burial age and post-burial denudation rate) and differ only in their sampling depths. Their burial ages are determined via the joint application of two widely applied burial age calculation approaches: the classic isochron (ISO) and χ2 fitting inverse modelling (INV) methods. The ratio of the pre- and post-burial CRN inventories and effect of inclusion and exclusion of data points (bootstrapping) were estimated and introduced as a new method for outlier identification. Results show that a single method may overlook the real outliers; therefore the use of diverse ways of outlier identification is strongly recommended. Samples of very low concentrations are prone to be dominated by CRNs produced after burial, which may lead to a bias in the CRN ratio and thus deviation of the calculated burial age. Outlier identification and age calculations are iterated until the model results converge into a coherent dataset yielding a good model fit.
The burial age of the terrace was determined to be 1.2 ± 0.4 Ma. This is the first numerical terrace age from the intrabasinal hills located to the south of the Danube within the Vienna Basin and is considerably older than the previously assumed Marine Isotope Stage 12 (MIS 12) age of this landform. Quantification of the terrace age enabled us to estimate an uplift rate of 21–56 m Myr−1 in this area, which is similar to published uplift rates along the Danube in the Vienna and Danube basins despite their different tectonic settings. The estimated post-burial denudation rate for the upper level (16.1 ± 11.7 m Myr−1) was higher than that for the lower level (6.3 ± 3.7 m Myr−1); however, it is in agreement within uncertainties. This might indicate a mean denudation rate of 11.6 ± 9.0 m Myr−1 or a recent increase in the surface denudation rate.
Das Ablagerungsalter einer Flussterrasse der Donau im zentralen Wiener Becken (Österreich) wurde mit Hilfe der kosmogenen Radionukliden (CRN) 26Al und 10Be berechnet. Die Terrasse befindet sich in einem tektonisch gehobenen Block östlich der Wiener Becken-Transformstörung.
Der Einfluss von analytischen Ausreißern auf das ermittelte Überdeckungsalter und die Verlässlichkeit der Identifizierung von Ausreißern wurde getestet. Dazu wurden veröffentlichte CRN Konzentrationen von Probensets aus zwei unterschiedlichen Tiefen einer Kiesgrube untersucht. Beide Probensätze waren postsedimentär derselben Produktion von CRN ausgesetzt und unterscheiden sich nur in ihrer Beprobungstiefe. Das Überdeckungsalter wurde mit Hilfe zweier weit verbreiteter Berechnungsmodelle bestimmt: die klassische Isochronmethode (ISO) und χ2 fitting in einem inversen Modell (INV). Das Verhältnis der CRN jeder Probe, die vor und nach der Überdeckung entstanden sind, sowie die Auswirkungen einzelner Datenpunkte auf das Gesamtergebnis (bootstrapping) wurden berechnet und als neue Methode zur Identifizierung von Ausreißern verwendet. Diese Untersuchung zeigt, dass die Anwendung von einer Methode alleine oft nicht ausreicht um Ausreißer zu identifizieren, weshalb eine Kombination aller Methoden empfohlen wird. Außerdem besteht bei Proben mit sehr niedrigen CRN Gehalten die Gefahr, dass sie nur CRN beinhalten, die nach der Ablagerung entstanden sind, was zu einer Abweichung des berechneten Alters führen kann. Der Ausschluss von Datenpunkten und nachfolgende Altersberechnungen werden iteriert, bis sie zu einem kohärenten Alter konvergieren.
Das berechnete Alter der Terrasse ist 1.2 ± 0.4 Ma. Dies ist die erste radiometrische Datierung aus dem Arbesthaler Hügelland südlich der Donau im Wiener Becken und ist deutlich älter als das bisher angenommene MIS 12-Alter. Mit diesem Terrassenalter kann eine Hebungsrate von 21–56 m Myr−1 für dieses Gebiet abgeschätzt werden. Die Rate ist mit veröffentlichten Hebungsraten im Wiener Becken und in der kleinen Ungarischen Tiefebene (Donaubecken) vergleichbar. Die modellierte Denudationsrate für seichtere Proben (16.1 ± 11.7 m Myr−1) ist etwas höher als im unteren Niveau (6.3 ± 3.7 m Myr−1), jedoch stimmen beide Werte innerhalb der Unsicherheiten überein. Daraus kann auf eine mittlere Denudationsrate von 11.6 ± 9.0 m Myr−1 berechnet werden. Eventuell weist das Ergebnis auf einen rezenten Anstieg der Denudationsrate hin.
- Article
(8895 KB) - Full-text XML
-
Supplement
(2697 KB) - BibTeX
- EndNote


Fluvial terraces are geomorphological features that can record incision/uplift history and provide valuable information of landscape reconstruction, sedimentology, climate change and tectonics (Gibbard and Lewin, 2009; Finnegan et al., 2014; Vandenberghe, 2015). Methods to determine the depositional age of a fluvial sediment body are chosen depending on the sedimentary setting (grain size, bedding, presence of a hiatus and/or eolian cover), the outcrop situation (exposed sediment thickness, preservation of the original surface above the profile) and the presumed age range (Rixhon et al., 2017). During the last decades, cosmogenic radionuclides (CRNs) produced in situ have widely been applied in the age determination of fluvial terraces, aiming at a better understanding of both past climate changes and the tectonic evolution of their study areas (Brocard et al., 2003; Rixhon et al., 2011; Bender et al., 2016; Schaller et al., 2016; Štor et al., 2019; Ruszkiczay-Rüdiger et al., 2016, 2018; Neuhuber et al., 2020; Mencin Gale, 2024).
The CRN burial dating of sediment using 26Al and 10Be – two CRNs with different half-lives – produced in situ can potentially resolve burial durations from a few hundreds of thousands of years up to ∼ 5 Myr (Gosse and Phillips, 2001; Granger, 2006; Dunai, 2010). Burial age calculation models require continuous exposure with steady erosion at the source area, no prolonged burial during transport and complete burial at the place of sampling (Granger, 2006; Blard et al., 2006, 2014; Rixhon et al., 2017). Unfortunately, fluvial sediments stored in terraces are prone to be affected by both temporal storage and shallow burial with possibly changing burial depth, which often makes the calculation of the burial age from the measured CRN concentrations challenging (Knudsen et al., 2020; Nørgaard et al., 2023). Due to differential decay of the CRNs, temporarily stored cobbles might arrive at the sampling site with lowered ratios and thus lead to a shift towards an older apparent burial age. The thickness of fluvial sediments is often limited to a few metres, which is not enough for a complete shielding from cosmic rays. Post-burial CRN production at depth increases the nuclide concentrations in the sampled rock and also leads to an increase in the CRN ratio for low-concentration samples. This may lead to the estimation of younger apparent burial ages compared to the actual burial duration (Granger and Muzikar, 2001; Granger, 2014). In the case of a long burial time, samples that initially contain low CRN concentrations will lose a major part of their original CRN inventory from the source area. These samples may become dominated by the nuclides produced after burial and do not preserve information on the burial event. In summary, some cobbles affected by natural geological processes described above may contain biased CRN concentrations that do not allow for the calculation of the depositional age of a deposit. Therefore, they must be identified and excluded as outliers.
The main objective of this study is twofold. The first one is the combined application of two well-established CRN age calculation models, i.e. the “classic” isochron burial dating (ISO) (Balco and Rovey, 2008; Erlanger et al., 2012; Zhao et al., 2016; Lotter et al., 2023) and the χ2 fitting inverse model (INV) (Siame et al., 2004; Braucher et al., 2009; Pappu et al., 2011; Rixhon et al., 2014; Lebatard et al., 2014; Ruszkiczay-Rüdiger et al., 2011, 2016, 2018; Jolivet et al., 2021), to demonstrate how the joint use of both models, after a careful outlier identification, leads to a robust age determination of fluvial terraces. In this study both ISO and INV use the same isochron dataset to obtain the burial age of the sampled sediment. As both methods follow the isochron approach, the technique using the slope of the isochron line to calculate the burial age is termed the “classic” isochron method (ISO) in order to be clearly distinguished from the calculation of the isochron burial age using χ2 minimisation-based inverse modelling (INV).
The second objective is to provide a new piece of information on the hitherto undated terrace staircase developed on the southern side of the Danube in the central Vienna Basin. Moreover, this terrace is used to estimate the uplift rate of the study area, and thus it adds new data to better our understanding of the landscape evolution of the Vienna Basin affected by Quaternary transform faulting and river incision (Decker et al., 2005; Hinsch et al., 2005; Salcher et al., 2012; Hintersberger et al., 2018).
A previously published CRN dataset from a terrace of the Danube River in the central Vienna Basin (Austria) east of Haslau an der Donau (Ruszkiczay-Rüdiger et al., 2021) provided a unique opportunity to achieve both of our objectives for the following reasons. (1) The dataset was analysed in the framework of a laboratory inter-comparison between the processing laboratories of the Institute for Geological and Geochemical Research (Budapest) and BOKU University (Vienna). Analytically, the CRN data are robust: most samples were processed in duplicates or even triplicates with CRN concentrations overlapping within error. (2) It provided two independent datasets from the same terrace horizon, opening a window of opportunity to test whether the burial age calculations using the proposed complex methodology including the outlier identification procedures lead to the same burial age. (3) The obtained burial ages will also provide the first numerical framework of the evolution of the terrace staircase in this part of the Vienna Basin.
During the Miocene, the Vienna Basin was a subsiding realm between the Eastern Alps and the Western Carpathians that formed along the Vienna Basin Transform Fault System (VBTFS) (Wessely, 1988; Decker et al., 2005). Its formation started in the Eggenburgian (ca. ∼ 20 Ma) followed by a main phase of rapid subsidence in the Miocene (ca. ∼ 17 Ma), when marine sediments of the central Paratethys up to 6 km thickness (Siedl et al., 2020; Harzhauser et al., 2023) were accumulated. At the beginning of the Pannonian ∼ 11.5 Myr ago, the marine environment gave way to fluvial/limnic conditions (Harzhauser et al., 2004, 2023, 2024) when an alluvial plain developed with the deposition of fluvial gravels and overbank fines. After the middle Pannonian (∼ 9 Ma), the overall subsidence ceased, evidenced by the absence of a continuous stratigraphic record.
Nowadays, the central Vienna Basin is dominated by fluvial deposition and erosion triggered by tectonic movements and climate-controlled fluvial activity of the Danube River. The Danube is currently shifting southwards and cuts into Neogene unconsolidated rock along its southern banks, while it deposits material mainly to the north of its main channel.
To the north of the present-day valley, extensive terrace bodies have been preserved at different relative heights above the current base level (Schnabel, 2002); the largest among these terraces is the Gänserndorf Terrace (∼ 0.2 Ma; Braumann et al., 2019). South of the main channel, the overall uplift and transtension along the VBTFS (Fig. 1; Hinsch et al., 2005) led to the formation of fault-bounded intrabasinal hills. Due to this differential uplift, the Danube cuts into Pannonian sediments forming a terrace staircase covered by fluvial gravels of up to seven levels (Fuchs and Grill, 1984) (Fig. 1) with relative altitudes ranging between 25 and 130 m (Salcher et al., 2012; Neuhuber et al., 2020).
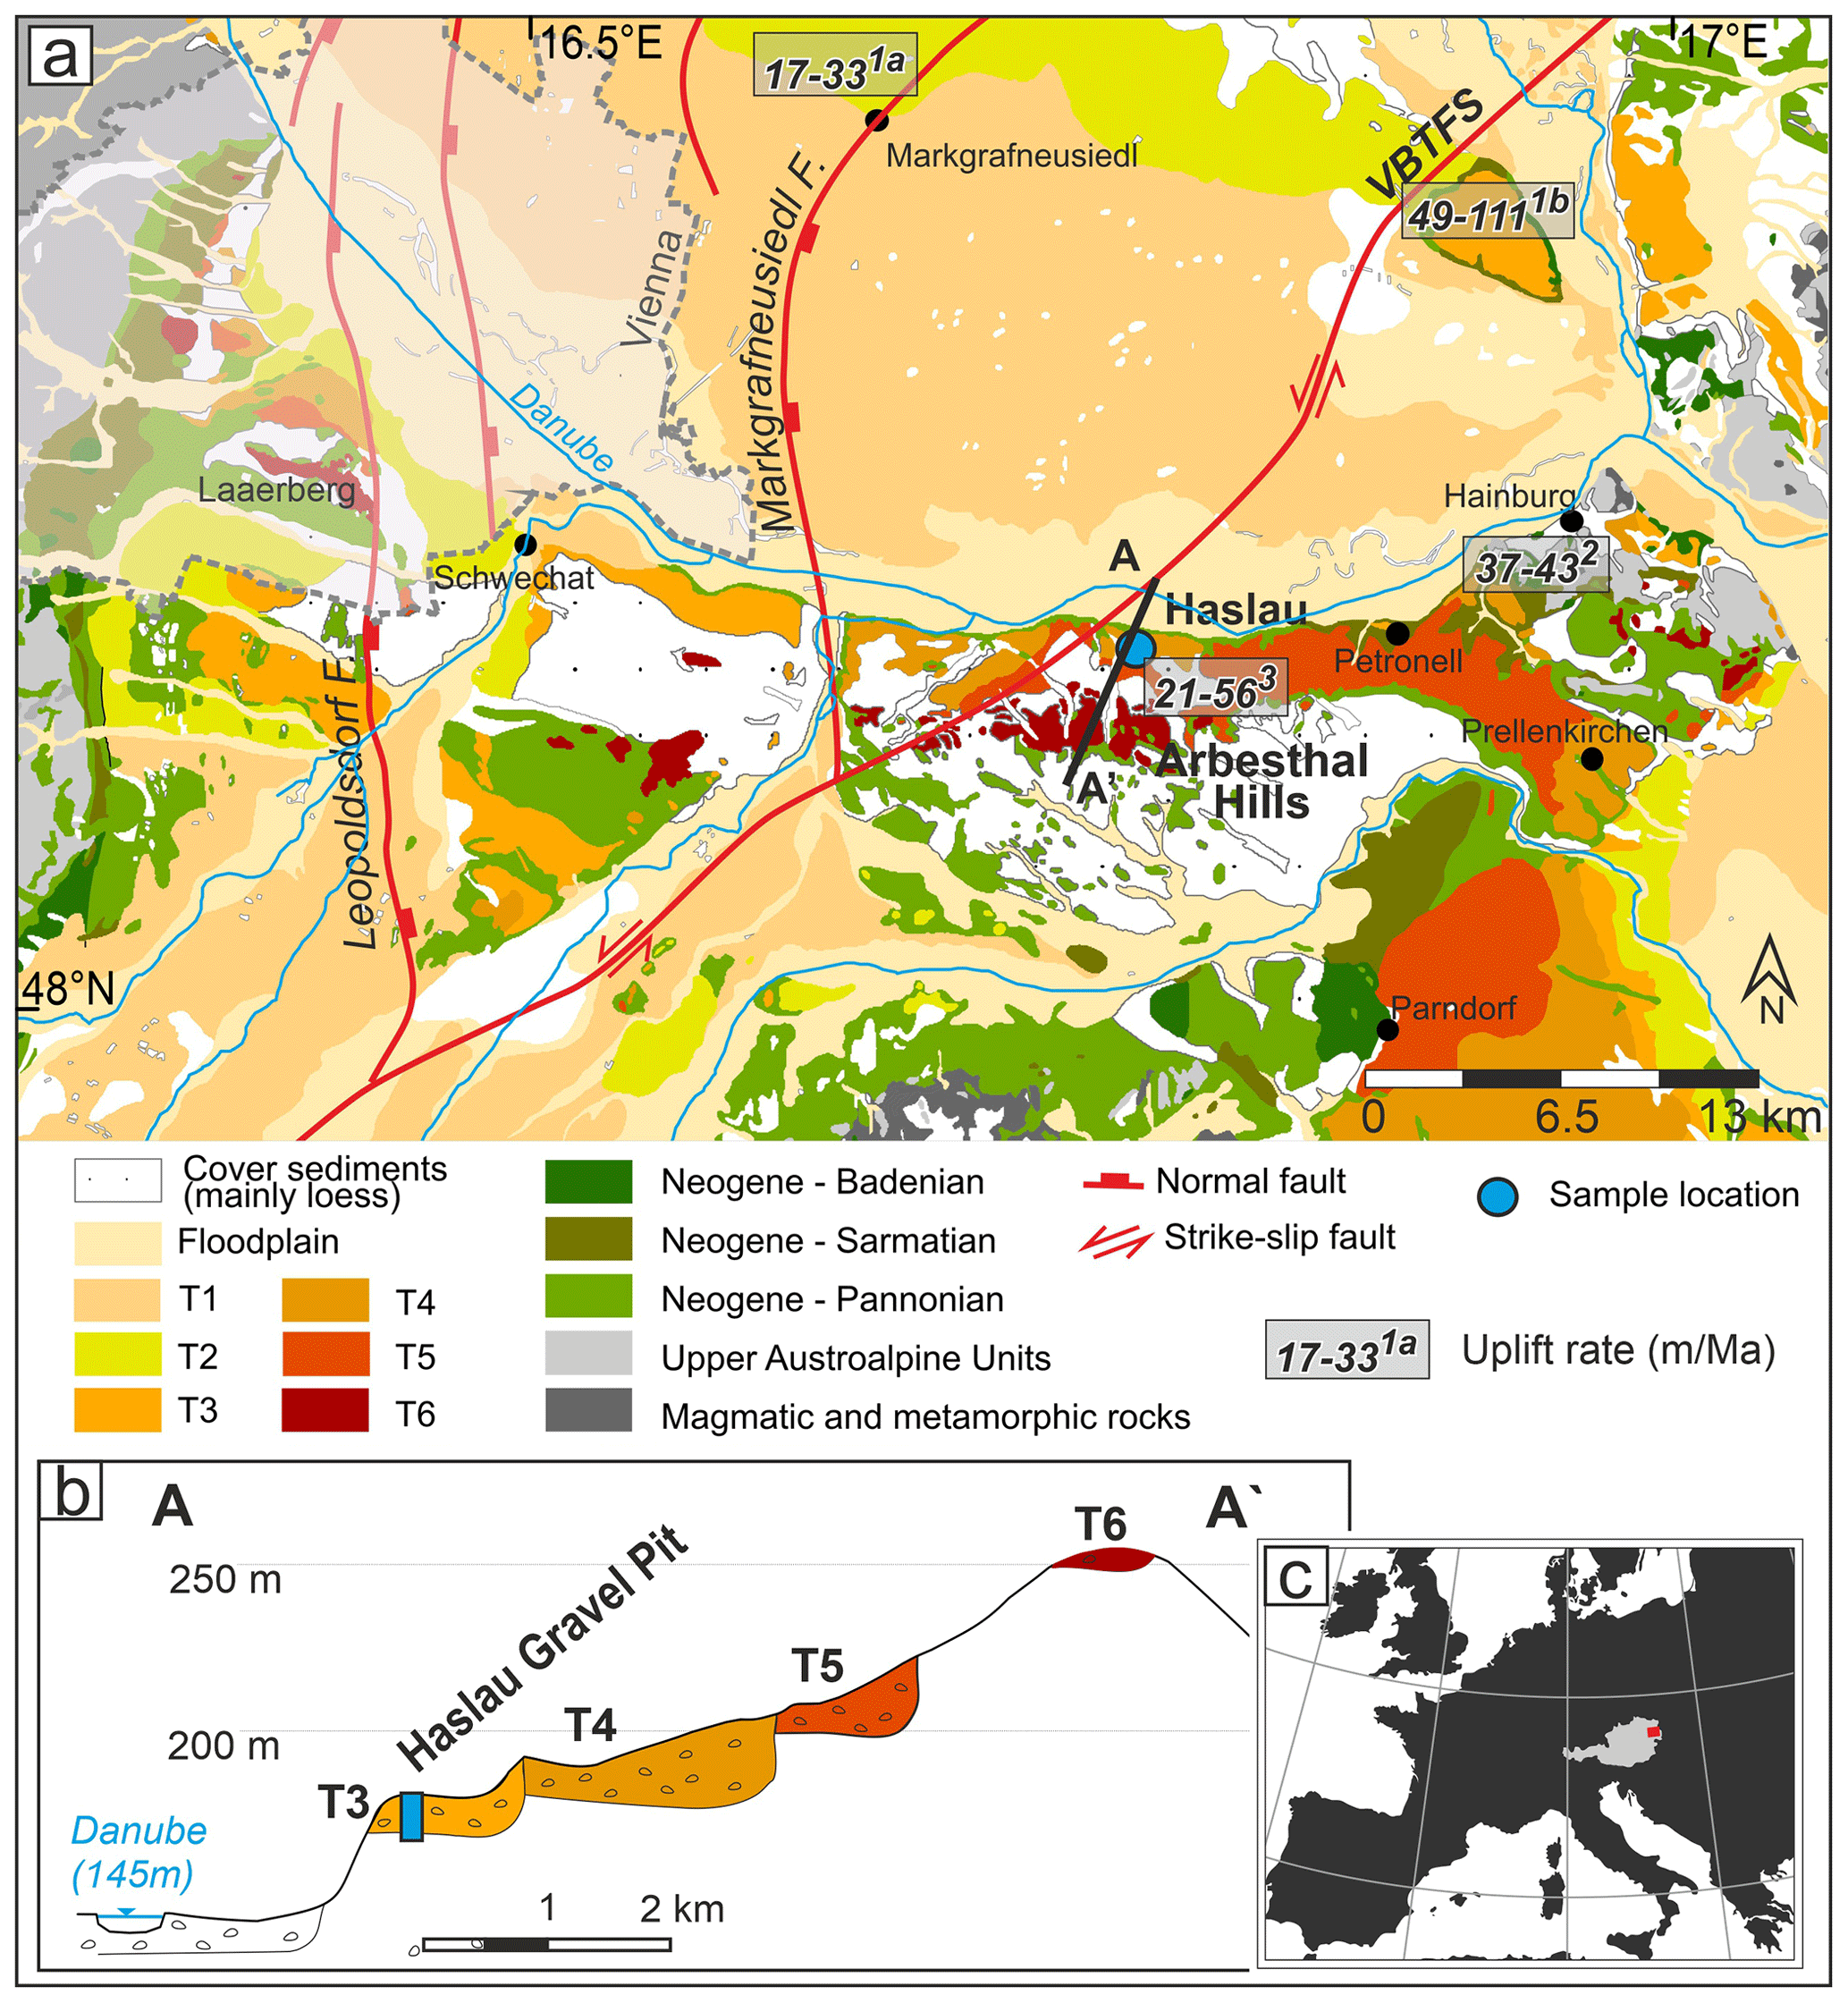
Figure 1(a) Geological map of the study area with terraces of the Danube River (Fuchs and Grill, 1984). The A–A' line indicates the position of the cross section in panel (b). Estimated uplift rates are in grey boxes, and the upper index means reference and relevant time range: 1a and b – Braumann et al. (2019), 240 ± 50 and 340 ± 170 ka, respectively; 2 – Neuhuber et al. (2020), 4.3 ± 0.2 Ma; 3 – this study, 1.2 ± 0.4 Ma. (b) Schematic cross section of the Arbesthal Hills with the terrace sediments. (c) Position of the study area within Europe and Austria.
The relative elevation of terrace threads has been used for age determination even though it has been recognised early on that tectonic blocks delimited by faults related to the VBTFS may distort the correlation of terraces over the width of the Vienna Basin (e.g. Hassinger, 1905; Stiny, 1932; Küpper, 1953). Each fault block recorded a slightly different succession of terraces regarding their number, elevation and preservation. Quaternary fault-related vertical displacement rates south of the Danube have not yet been quantified. The sampled terrace at Haslau an der Donau is situated north of the Arbesthal Hills, one of the uplifted, fault-bounded blocks that developed to the east of the VBTFS. At this location the lowermost terrace levels are missing, and the T3 level sampled at Haslau is locally the lowest terrace of the Danube (WGS 84: 48.11410° N, 16.74342° E; 183 ± 8 and 170 ± 2 m a.s.l. terrace top and base, respectively, relative elevation of 39 ± 7 m). No numerical ages are available in this area. Based on the correlation of terrace levels by geomorphological mapping, the age of the Haslau terrace is considered to be Middle Pleistocene, more specifically “Mindel” (Schnabel, 2002), equivalent to Marine Isotope Stage 12 (MIS 12; 424–478 ka).
3.1 Sampling and CRN data
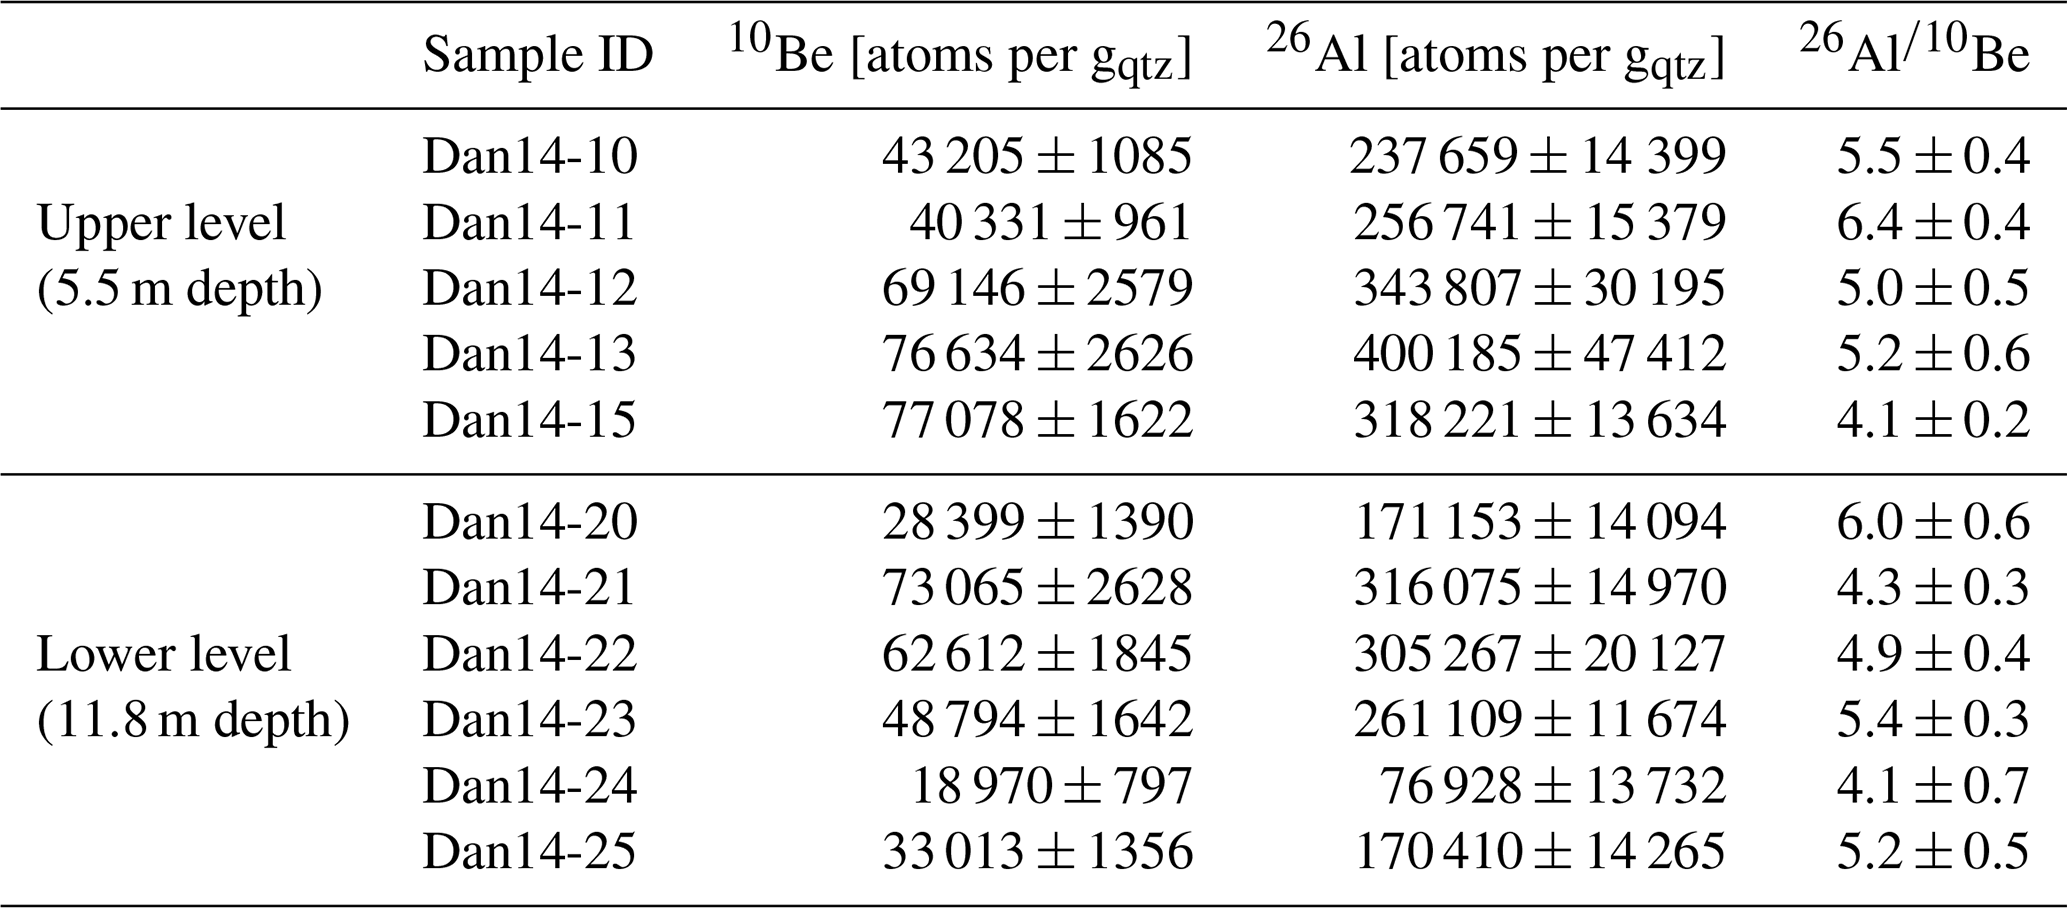
The presented sample set was collected in 2014 for two purposes: (1) an inter-laboratory comparison of sample processing methodologies and (2) age determination of the terrace level of the Danube River. The results of the laboratory inter-comparison have been published by Ruszkiczay-Rüdiger et al. (2021). Most of the cited 10Be and 26Al concentrations are the weighted mean of two or three independent measurements reported with their 1σ weighted mean uncertainties (Table 1). These values will be used in this study to quantify the burial duration of the terrace sediment.
Table 1Cosmogenic 10Be and 26Al concentrations of the sample set from two depth levels at the Haslau quarry. The 26Al measurement of sample Dan14-14 was affected by the loss of aluminium during sample processing (Ruszkiczay-Rüdiger et al., 2021), and therefore it was excluded from the dataset used for age calculations in the present study.
At the time of sample collection, the sediment was exposed in three quarry levels with a total thickness of 14 m. The upper part of the sediment body consisted of coarse sandy gravel with some sand lenses. Its lower part was coarse sandy gravel with cobbles, showing low-angle foresets (Figs. 2, 3). The upper ∼ 3 m of the terrace material was strongly affected by cryoturbation, evidenced by the presence of sand-wedge casts and large, bowl-shaped cryoturbation features that partly contain iron oxides. At the base of the quarry, muscovite-rich Upper Miocene (probably Pannonian) sand was exposed.
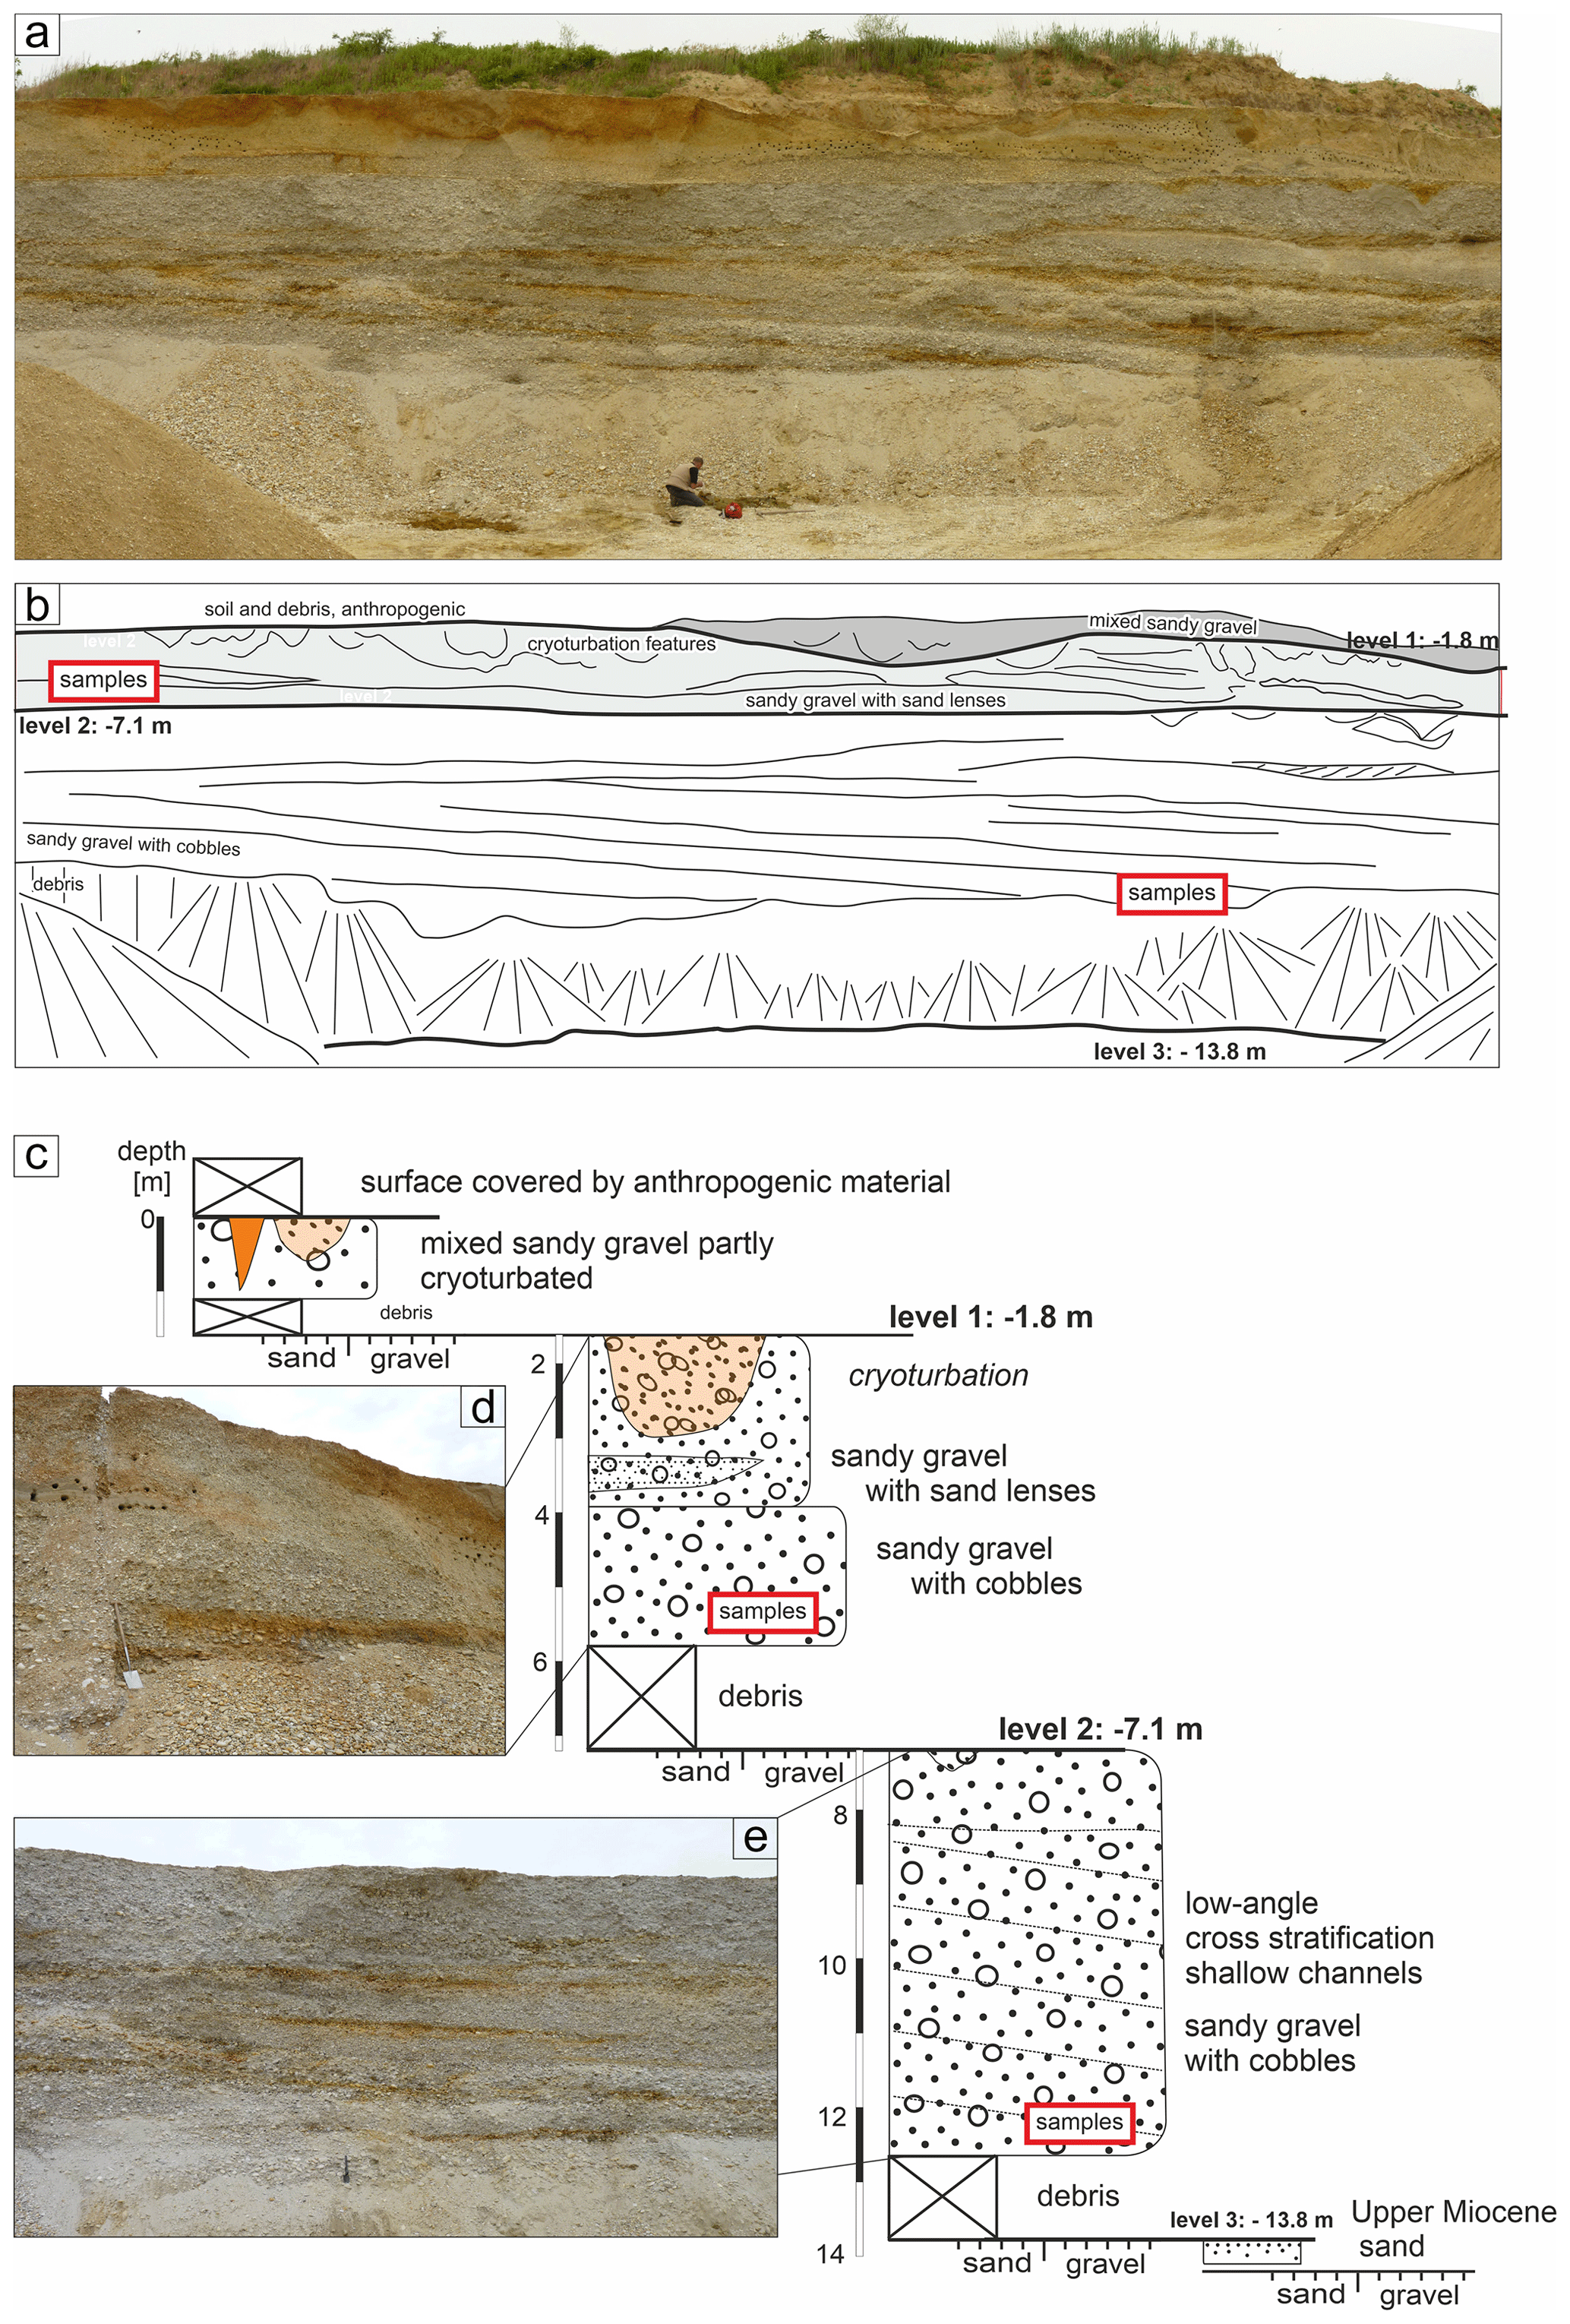
Figure 2(a–b) Photo and line sketch of the quarry. (c) Profile log and description of the sampled sedimentary succession with the location of the samples. (d) Detail of upper gravel layer. (e) Detail of lower gravel layer.
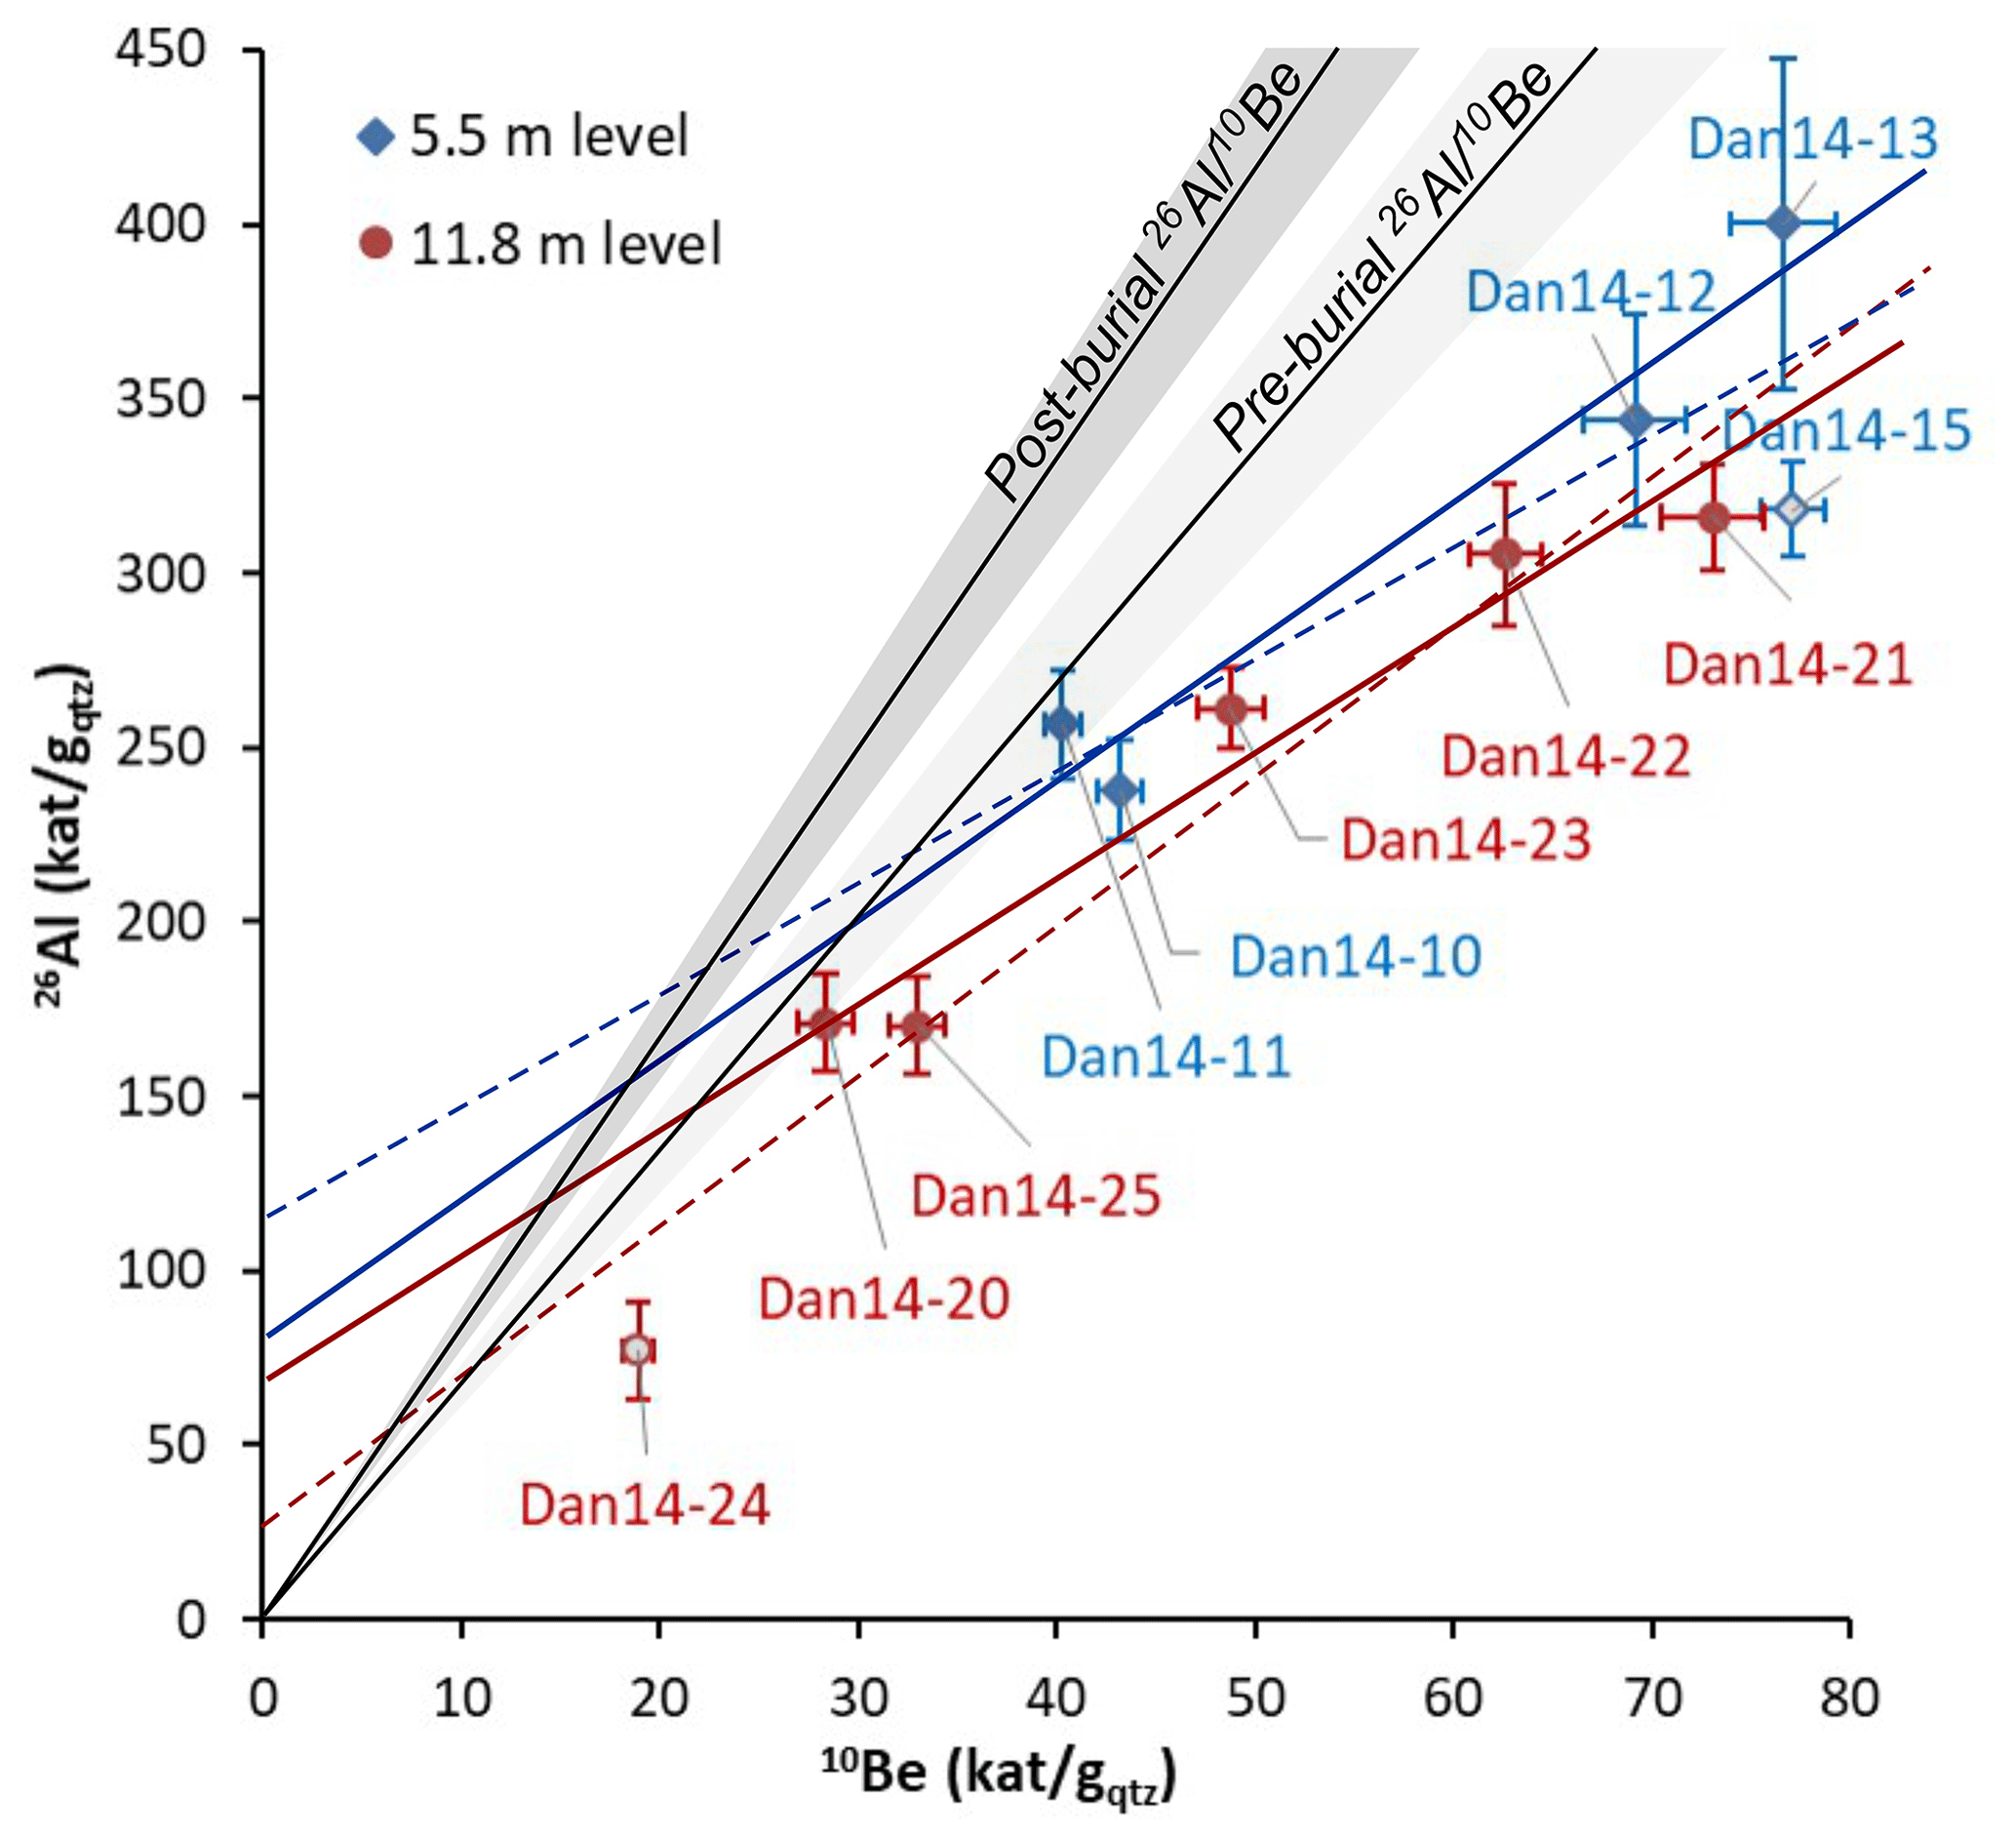
Figure 326Al vs. 10Be concentrations of the samples of the two sampled quarry levels (Ruszkiczay-Rüdiger et al., 2021). For data and modelling parameters refer to Tables 1 and 2, respectively. The pre-burial production line is at the 6.7 ± 06 spallogenic production rate ratio at the surface (Fenton et al., 2022). The post-burial line represents the production rate ratio at the sample depth. Here it is at a ratio of 8.3 ± 06, the mean of the ∼ 8.5 and ∼ 8.1 ratios, relevant for the subsurface depth of the upper and lower sample levels (Balco, 2017, calculated using the model of Nørgaard et al., 2023). Grey shadows show the uncertainties of the production rate ratios. Outliers, Dan14-15 and Dan14-24 from the upper and lower levels, respectively, are plotted with grey filling. Note that when the outliers are considered, the trendline of the upper layer (dashed blue line) is steeper than that of the lower-level samples (dashed red line), suggesting an older apparent age for the stratigraphically younger sample set. In turn, when the outliers are excluded, the two trendlines (continuous blue and red lines) run roughly parallel, suggesting a similar age of the two levels. The intercept of the trendlines with the post-burial production line is at higher CRN concentrations for the upper-level sample set, in agreement with the expected larger post-burial inventory at shallower depths. Note also that samples that are under this intercept contain lower amounts of one or both nuclides than the post-burial inventory; therefore they are to be excluded as outliers. As a consequence, sample Dan14-24 can directly be flagged as an outlier.
Two depth levels of the cobble-rich sandy-gravel succession were sampled for CRN burial age determination. Both sampled levels are considered a result of the same depositional event, thus sharing the same burial age. Six quartz cobbles were taken from each of the 5.5 ± 0.1 and 11.8 ± 0.1 m subsurface depths (Fig. 2, Table 2) to constrain the terrace age by two independent sample sets and thus to provide robust results on both the burial duration of the terrace and the models used for its calculation.
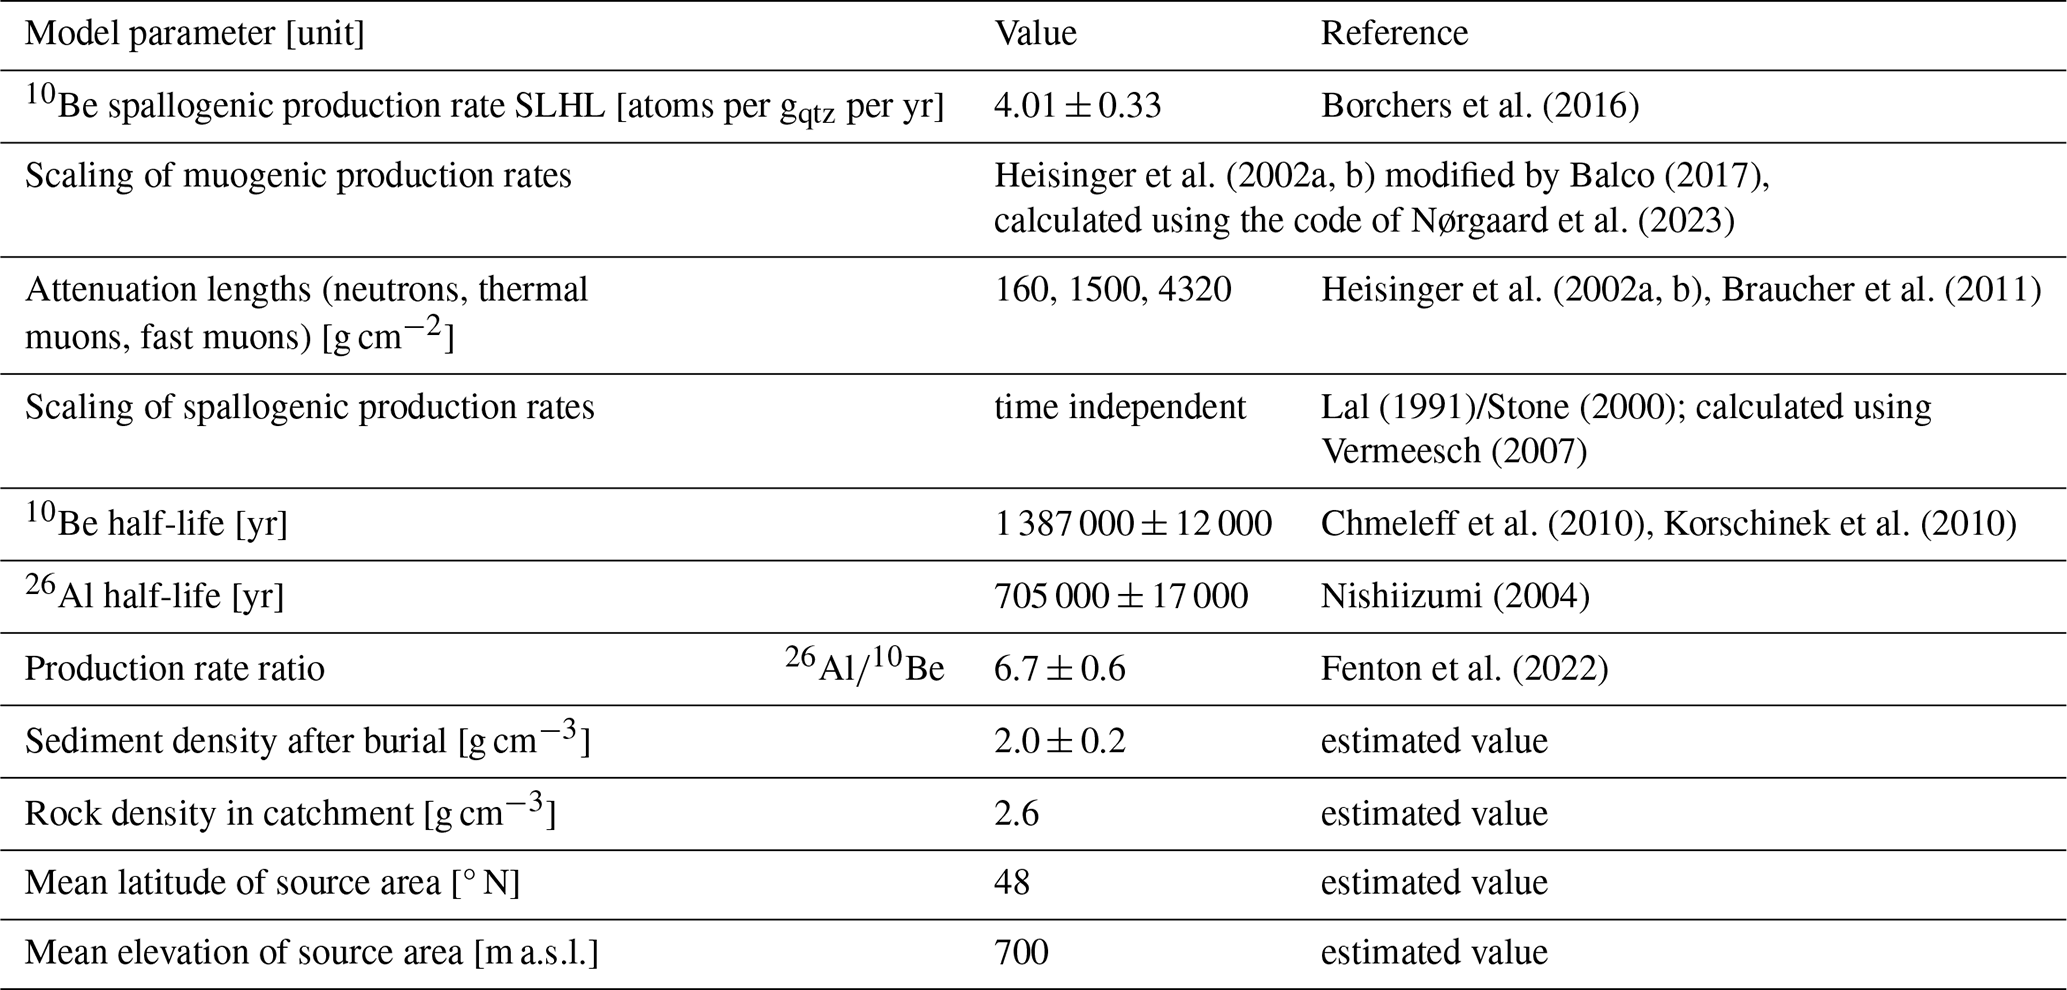
Table 2Constants and variables for age calculation (qtz: quartz; SLHL: sea level high latitude).
3.2 Burial age determination using cosmogenic nuclides
3.2.1 Basic concept
The CRNs 26Al and 10Be are produced in quartz at or close to the surface due to exposure to secondary cosmic rays. They are rapidly attenuated with depth; thus CRN burial dating can be applied to buried sediments derived from a formerly exposed position. A prerequisite for burial dating is that the source rocks were exposed and steadily eroded long enough to accumulate a measurable amount of CRNs and the sediment was buried instantaneously after a relatively short transport (Granger, 2006, 2014; Rixhon, 2023). During the pre-burial history, the number of cosmogenic nuclides accumulated can be variable (practically in an inverse relationship with the source denudation rate), while the production rate ratio remains roughly constant (Granger et al., 1997; Granger, 2006). Here we use the initial spallogenic production rate ratio at the surface of 6.7 ± 0.6 (Fenton et al., 2022).
After partial or complete burial, the CRN production decreases or stops, and the CRN concentration starts to decline due to radioactive decay. Given that the half-life of 10Be (1.387 ± 0.012 Myr; Chmeleff et al., 2010; Korschinek et al., 2010) is roughly 2 times longer than that of 26Al (705 ± 17 kyr; Nishiizumi, 2004), the initial nuclide ratio decreases with increasing burial time. This decrease in the nuclide ratio from the initial ratio is used to determine the burial duration of the sample (Granger, 2014). In a fluvial environment the thickness of the overburden is rarely enough for complete burial; therefore post-burial CRN production due to thermal and fast muons (Heisinger et al., 2002a, b; Braucher et al., 2011; Balco, 2017) must be accounted for. Certain geological scenarios result in a variability in the initial ratio. For example, fast and episodic erosion in the source area (glacial plucking, landslides) can produce higher initial ratios linked to low nuclide concentrations. Also, in large catchments where the sediment might be stored over longer time spans at a certain depth before being remobilised by the river and redeposited into the sampled sedimentary body will record a decreased initial ratio. These samples need to be identified and either excluded or accounted for during the age calculations (Erlanger et al., 2012; Granger, 2014; Nørgaard et al., 2023).
For isochron burial age determination both ISO and INV use a set of cobbles taken from the same depositional event and subsurface depth, thus sharing the same post-burial history. Prior to burial the cobbles accumulate cosmogenic 10Be and 26Al in variable concentrations (Ninh; Eq. 1) depending on the surface production rate at the source (defined by the latitude and elevation above sea level), on the radioactive decay constant, and on the pre-burial or source denudation rate (supposing an exposure duration long enough to reach steady state). After deposition, all samples share the same post-burial history, specifically the burial duration at the sample depth and the denudation rate of the overburden. At shallow depth the CRN production by neutron spallation, slow and fast muons, and their change with subsurface depth has a considerable effect on the calculated age and post-burial denudation rate (Eq. 2).
Ninh (atoms per ggzt) is the nuclide concentration accumulated at the source. is the measured nuclide concentration as a function of the burial time (t [yr]), in this case the duration of the exposure at the measured sample depth. Surface denudation rate is modelled both at the source and at the sink (pre- and post-burial denudation rates; εsource and εsink [g cm−2 yr−1], respectively). x [g cm−2] is the measured sample depth. Psp, Pμslow and Pμfast are the surface production rates by neutron spallation, slow muons and fast muons, respectively (their values are provided in Table S1 in the Supplement). λ [] is the radioactive decay constant; Λsp, Λμslow and Λμfast are the attenuation lengths of neutrons, slow muons and fast muons, respectively. Psp,source, Pμslow,source and Pμfast,source and Psp,sink, Pμslow,sink and Pμfast,sink are surface production rates by different production pathways at the source and at the sink. Note that the source production rate is determined using the mean latitude and elevation of the catchment and does not account for the variability in the production rates, which might be considerable throughout large drainage basins. The main reason for this simplification is that the usual sample number of four to eight cobbles in a sample set does not provide enough degrees of freedom to model source latitude and elevation as free parameters.
The surface production rate ratio of the two nuclides is assumed to be constant. Therefore, when plotted in 26Al vs. 10Be space (i.e. isochron plot), nuclide concentrations of the samples are expected to follow a slightly curved line, which is called an isochron (Fig. 3). The curvature of the line is due to radioactive decay, with the low-concentration samples losing fewer isotopes by decay compared to the high-concentration ones. This is corrected by linearisation during the age modelling (Granger, 2014).
3.2.2 “Classic” isochron burial dating (ISO)
The isochron burial dating method (Balco and Rovey, 2008; Erlanger et al., 2012) uses the change in the slope of the isochron due to radioactive decay to estimate the burial age of the sampled sediment. Initially, the slope of the isochron corresponds to the surface ratio in the source area (pre-burial line in Fig. 3), but, over time, the ratio decreases due to the faster decay of 26Al changing the isochron slope to a lower inclination. The post-burial production at a few metres depth has a higher ratio due to the predominance of muogenic CRN production (Balco, 2017). The intercept of the trendline with the post-burial production line (post-burial line in Fig. 3) depends on the post-burial CRN production at the sample depth (Granger, 2014). Any samples plotting below the intercept of the isochron with the post-burial line are potential outliers as they contain an equal or lower CRN inventory than the concentration supposed to be produced on site after burial (Fig. 3). The main advantage of this method is that the exact value of the sampling depth and its change over time are inconsequential, as all samples are affected the same way.
All samples that deposited with an initial ratio deviating from the surface ratio characteristic of the source area will plot below the isochron (lowered initial ratios due to temporal storage). In some special cases, if the CRN concentration is low, a sample may plot above the line (sudden exhumation from great depth or prevailing nuclide inventory produced at depth after long burial). In every other case, samples plotting above the line are analytical outliers. Such samples must be identified and excluded as they cannot be used for age determination using this approach (Balco and Rovey, 2008; Granger, 2014; Bender, 2016).
The ISO ages were computed using a MATLAB script based on Erlanger et al. (2012) and Granger (2014), as described and updated for the Monte Carlo simulation in Braumann et al. (2019). Reported age uncertainties originate from the Monte Carlo simulation with 100 000 runs using 26Al and 10Be values randomly picked from within the measured error based on a Gaussian fit (3σ). The variation in the spallogenic initial ratio between 6.1 and 7.2 (Fenton et al., 2022) using a Gaussian probability (3σ) is included in the total uncertainty. The Monte Carlo simulation results are shown as histograms of the age range and/or as an isochron plot (Figs. S1, S2 in the Supplement).
3.2.3 Isochron burial dating by χ2 fitting inverse modelling (INV)
During inverse modelling mathematical solutions for burial age and pre- and post-burial denudation rates are calculated by simultaneously solving Eqs. (1) and (2) for both 10Be and 26Al and for the source and the sink areas, respectively (Siame et al., 2004; Braucher et al., 2009). The method was originally used for depth profile dating using the assumption that amalgamated sand samples from different subsurface depths are arriving with a similar inherited CRN inventory (Rodés et al., 2011; Rixhon et al., 2014; Ruszkiczay-Rüdiger et al., 2011, 2016, 2018; Šujan et al., 2019; Jolivet et al., 2021). When it is applied to isochron burial dating, the only difference is that all samples are deposited with variable inherited 10Be and 26Al concentrations but share the same subsurface depth (Pappu et al., 2011; Lebatard et al., 2014). In Eq. (1) the CRN concentrations of the eroding surface of the source area are assumed to be in steady state. The samples share the same burial time (t) and post-burial or sink denudation rate (εsink), while Ninh is variable depending on the source production rates and source denudation rate (εsource) of each cobble, assuming instantaneous burial followed by steady erosion. For simplicity and without geological evidence for a more complicated depositional scenario, we consider that the accumulation of the terrace material was short compared to the time elapsed since its deposition and abandonment by the river. By substituting Eq. (1) in place of Ninh in Eq. (2), the best estimates of burial duration and source and sink denudation rate triplets are adjusted via reduced χ2 (in the following Rχ2) minimisation to reach the best fit between the model and the data (Pappu et al., 2011; Lebatard et al., 2014; Ruszkiczay-Rüdiger et al., 2018).
INV solves for the burial duration, together with the source and sink denudation rates. These three variables are calculated iteratively by estimating the burial time and the pre- and the post-burial nuclide inventories. As a simplification, the mean elevation and latitude of the catchment are used to estimate the surface production rate in the catchment area, whose value is used as a constant for the whole sample set (Eq. 1). Accordingly, to account for the variable inherited CRN concentrations of each sampled cobble, the pre-burial denudation rate is used as the only variable parameter in the model. In the case of large catchments (like that of the Danube River), with considerable latitudinal extent and differences in elevation, this approach is oversimplified because the CRN production rates vary significantly within the catchment, and thus the inherited CRN concentrations and ratios might not always be dominated only by the source denudation rate. Therefore, the modelled pre-burial denudation rates are sometimes more variable than actual rates and should be regarded to reflect the difference between the modelled Ninh values of the individual cobbles rather than actual εsource. For this reason, in this study the modelled εsource values are considered apparent and will not be discussed or used for geologic interpretation.
The sink denudation rate is also a simplification, as mentioned above, assuming steady-state denudation of the terrace surface since deposition. However, in the absence of information on possible temporal cover (e.g loess) or past changes in denudation rate, the simplified model is considered to provide the best estimate value for εsink.
As sample depth is integrated in INV, this model can be applied to samples from one depositional event but different depths below the surface, similarly to the CRN depth profile approach (Siame et al., 2004; Braucher et al., 2009; Ruszkiczay-Rüdiger et al., 2011, 2016, 2018). Sample depth (i.e. mass depth, considering sediment density) is considered to gradually change with the modelled sink denudation rate (Eq. 2). Accordingly, INV is sensitive to the accuracy of the measured sample depth and to its past changes. Signs of uncertainty in sample depth and the possibility of complex sedimentation and surface denudation histories of the terrace surface have to be considered in the field before sampling.
3.3 Outlier identification
3.3.1 Conventional ways: sample position with respect to the isochron and statistical analysis
As described above (Sect. 3.2.2), a sample is considered an outlier if its deviation from the isochron line exceeds the uncertainties. In some cases, e.g. for datasets of small sample number and/or relatively large dispersion with small analytical uncertainties, the definition of the true isochron line and the respective outliers can be challenging. Statistical methods are routinely applied to pinpoint samples with CRN ratios that are incompatible with the rest of the dataset.
In this study, the reduced χ2 test (Ward and Wilson, 1978) was applied using the ratios of both sample sets to examine their statistical integrity (Pappu et al., 2011). For burial age modelling we use 1σ uncertainties of the data as they were published (Table 1). As the data are the result of the weighted mean CRN concentrations of two or three subsamples, their measurement uncertainties have been reduced significantly (see Ruszkiczay-Rüdiger et al., 2021). Using the 2σ confidence level is common practice in geochronology (Vermeesch, 2018; Odom and Granger, 2022); therefore the reduced χ2 test was completed with CRN concentrations using both their 1σ and 2σ analytical uncertainties. In the case of the sample set collected at 5.5 m, the reduced χ2 test excludes sample Dan14-15 regardless the uncertainty level. This sample can be identified on the isochron plot by its position under the trendline fitted to the data (Fig. 3). For the 11.8 m level Dan14-20, Dan14-21 and Dan14-23 samples are flagged as potential outliers at the 1σ confidence level. When the 2σ uncertainty level is considered, all samples are statistically accepted.
This statistical outlier identification is based solely on the ratios of the samples, regardless of the amount of CRNs. In practice, the lowest- and highest-concentration samples have a major influence on the slope of the isochron (Luo et al., 2020). Moreover, the CRN ratio of the low-concentration samples is potentially overprinted by post-burial CRN production, instead of reflecting the ratio of the pre-burial nuclide inventory decreasing by radioactive decay through time. As a consequence, other ways of outlier identification must be applied to achieve robust outlier identification and to define the uncertainty of the burial age (Luo et al., 2020; Lotter et al., 2023).
3.3.2 Post-burial production test
The dominance of the post-burial CRN inventory may be a problem for the low-concentration samples. These samples may be identified visually on the isochron plot, as they fall under the intercept of the isochron line and the post-burial production line (Fig. 3). In the case of long burial and/or shallow subsurface depth, the CRN inventory produced on site may exceed the amount of inherited CRN concentrations that remained in the rock after decay and may significantly alter the CRN ratio as well. The post-burial production rate is ∼ 8.5 and ∼ 8.1 atoms per gqtz per year at the sampled 5.5 and 11.8 m depth levels, respectively (considering the muogenic production based on Balco, 2017). Taking the measured sample depth, the modelled burial age and post-burial denudation rate, the CRN inventory produced on site at the sampled depth can be calculated using Eq. (2). As post-burial production is a function of the two modelled parameters, burial duration and surface denudation rate, the post-burial CRN production has to be estimated in an iterative way for the subsequent results of the burial duration and corresponding denudation rate. Then the percentage of post-burial 10Be and 26Al concentrations to the total, measured concentrations was calculated for each sample. If the modelled post-burial CRN inventory equals or exceeds the measured CRN inventory for the best-fitting model-age–denudation-rate pair, no CRN has remained in the sample from before burial; therefore the sample is not suitable for burial age determination and should be excluded as an outlier.
3.3.3 Bootstrap resampling
The bootstrap method is a form of resampling for cross-validation of a dataset, where one sample is removed from the dataset and the burial age and denudation rates are recalculated for the reduced dataset (Luo et al., 2020). This is repeated omitting one by one each sample of the dataset. The results are supposed to agree within error. If the omission of one sample leads to a considerable change in the burial duration and/or an improved model fit, that sample is identified as a potential outlier. The standard deviation of the bootstrap results for each sample set can be compared to the uncertainty of the regression for the entire dataset and also used as the uncertainty of the burial age (Luo et al., 2020).
In our study, the bootstrap test was run first with the complete dataset, resulting in samples of excessive influence on the results that are picked as potential outliers. After exclusion of these samples, the bootstrap test is repeated to see if the reduced dataset provides more consistent results.
We use bootstrapping and the post-burial production test (Sect. 3.3.2) as a joint toolbox, which works iteratively using each other's results to correctly identify the outlying data until converging in a robust outlier and eventually to a consistent dataset after their omission.
4.1 Model setup
The input parameters used for modelling were identical for ISO and INV (Table 2). The reported uncertainties include analytical uncertainties, uncertainties of the half-lives of 10Be and 26Al, the spallogenic PSLHL of 10Be, the production rate ratio, and density (for INV). The goodness of the model fit is tested by comparing the deviation of the modelled and measured CRN concentrations and expressed as a reduced χ2 value in each model setting (Table S2 in the Supplement).
For an objective outlier identification, the full datasets of the two levels, including samples that were pinpointed by the statistical test as potential outliers, are used for age and denudation rate calculations and outlier identification. This was done iteratively, as a previously determined burial duration and denudation rate pair is necessary for the calculation of the post-burial production (see Sect. 3.3.2). During the subsequent iteration steps the preliminary burial durations and suggested outliers are further challenged until converging into a single, most probable result for terrace burial age and surface denudation rate. These steps will be jointly discussed in the following sections.
Source denudation rates calculated only by INV are regarded as apparent (see Sect. 3.2.3.), and they are discussed only briefly in Tables S4 and S5.
4.2 Burial ages and denudation rates at the 5.5 m horizon with all samples included
The upper quarry level provided isochron burial ages of 2.23 ± 0.49 Ma and 2.23 ± 0.40 Ma calculated using all samples via ISO and INV, respectively. When bootstrapping, the terrace burial age is calculated using the mean and standard deviation of the individual bootstrap results. In this way ISO and INV delivered ages of 2.11 ± 0.79 Ma and 2.02 ± 0.61 Ma, respectively.
Bootstrapped ages ranged around 2 Ma and reached up to 2.67 ± 0.71 Ma and 2.38 ± 0.43 Ma for ISO and INV, respectively (Table S2). The omission of no. 15, the sample with the lowest ratio during the bootstrap test, provides a significantly younger burial age for both methods (1.21 ± 0.35 Ma and 1.22 ± 0.22 Ma). This shows that sample no. 15 has a significant influence on the estimated age, shifting the age towards higher numbers (Figs. 4a, S1; Table S2). The model fit of INV was best when no. 15 was omitted (Rχ2=0.6). These facts, together with the result of the statistical test of the ratios, strongly suggest that this sample is an outlier.
The variability in the modelled sink denudation rates was small (Figs. 5a, Table S2) with values of 9.7 ± 1.5 m Myr−1 and 10.7 ± 2.3 m Myr−1 for the simple and bootstrapped mean, respectively. The bootstrapped values varied between 9.1 ± 1.4 m Myr−1 and 12.7 ± 1.9 m Myr−1 with no visible bias caused by any of the samples.
The post-burial production test was run for different combinations of burial age and sink denudation rate pairs that were among the modelled bootstrap solutions (Figs. 6a, b, S3). The ratio of post-burial production was high for samples no. 10 and no. 11 in the case of old burial age (2 Ma) or slow denudation rate (6 m Myr−1).
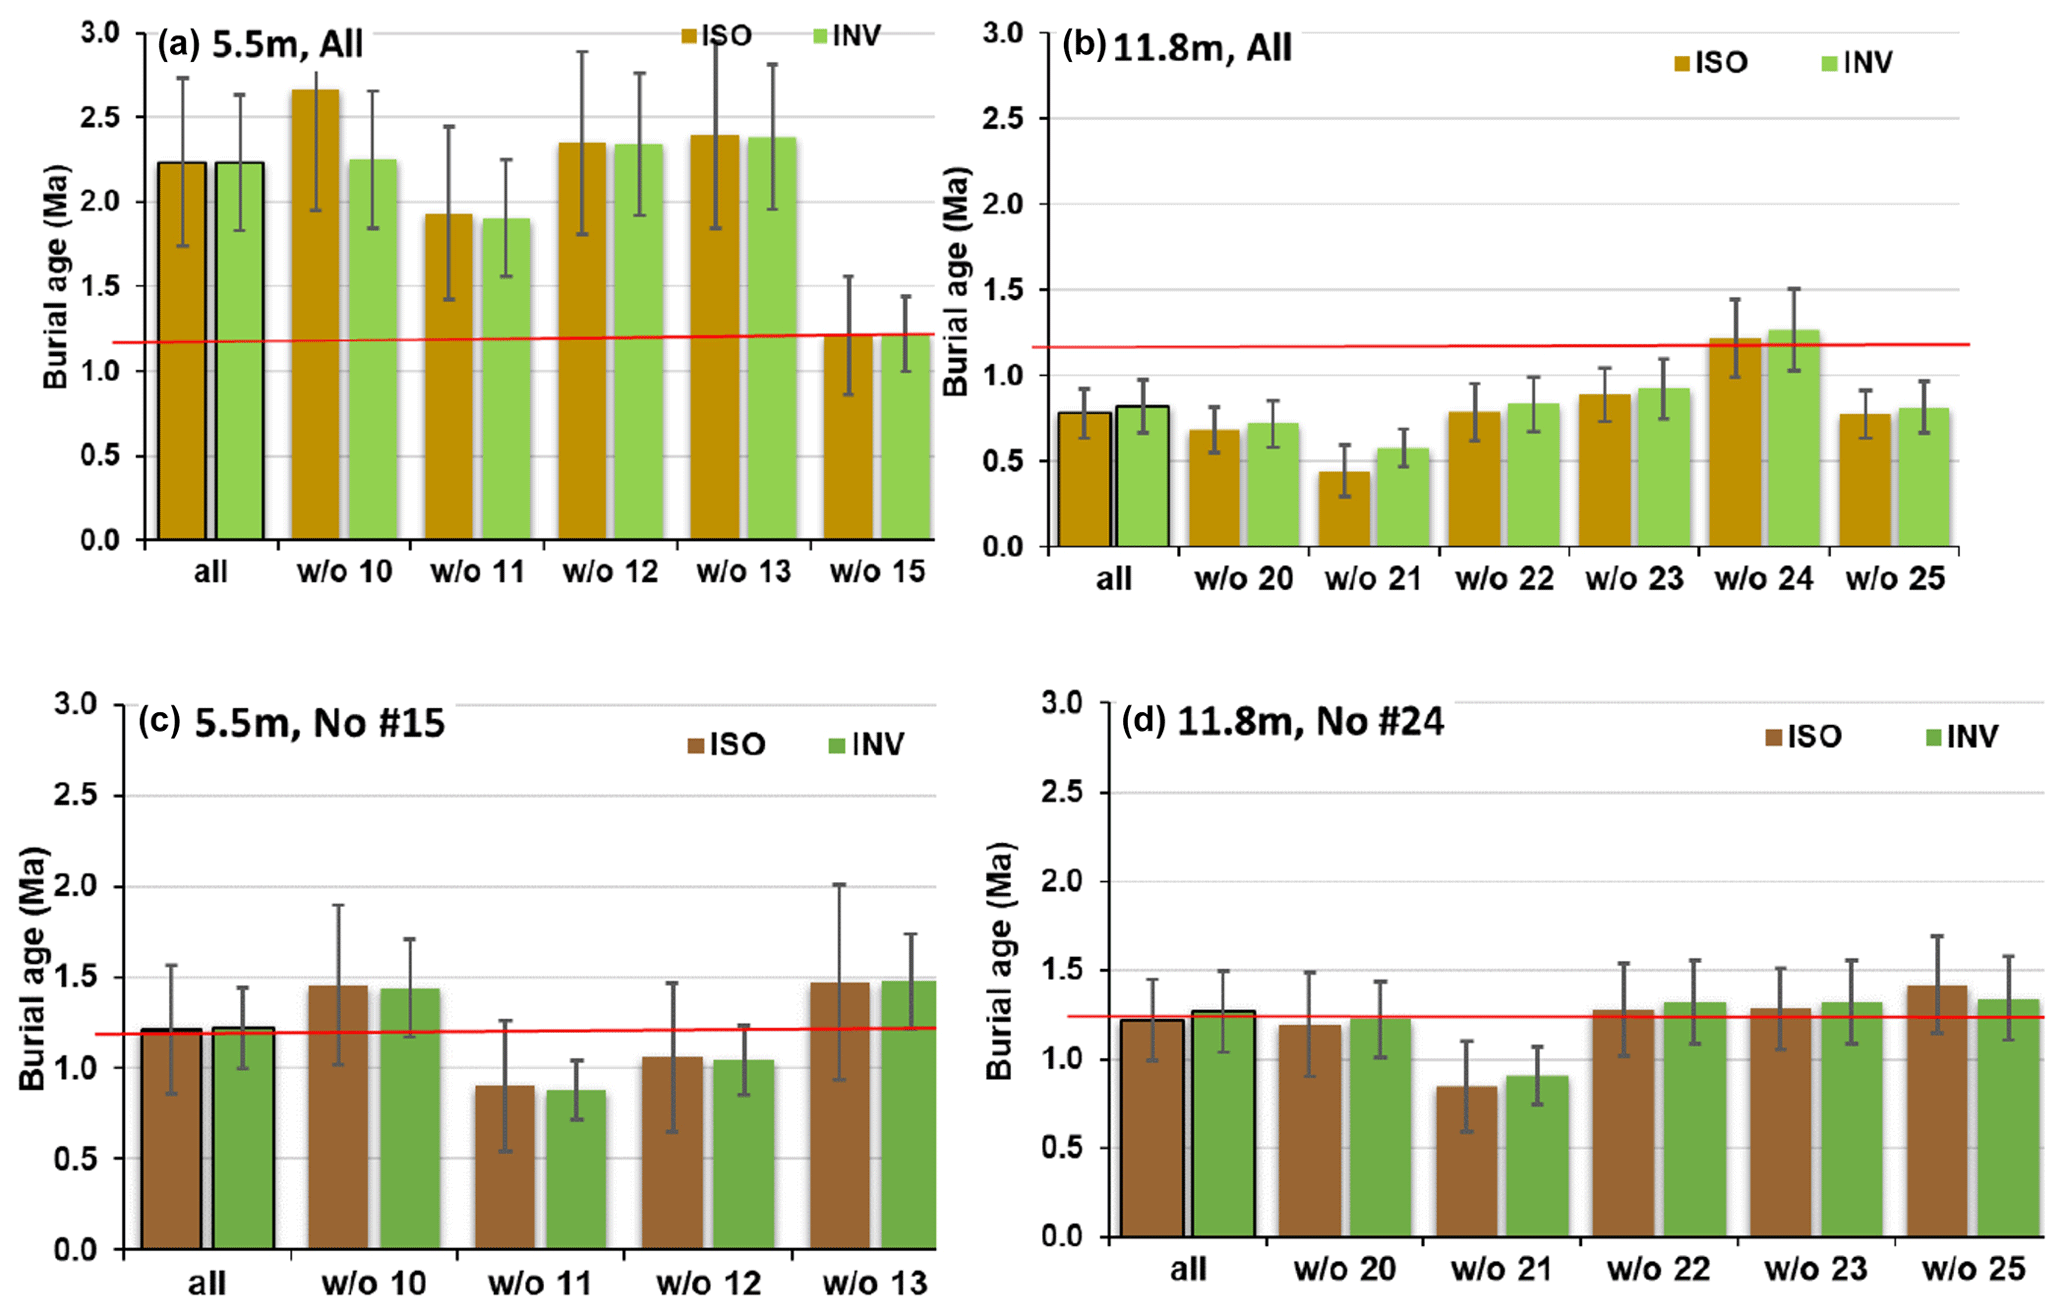
Figure 4Burial ages resulting from the bootstrap test for the upper and lower quarry levels when all samples are included (a, b) and when outliers are removed (c, d). When samples Dan14-15 from the lower level and Dan14-24 from the lower level are omitted, bootstrapped burial ages at both levels converge around 1.2 Ma (red line on all plots). If all samples are included, the modelled ages are well above (5.5 m level) or under (11.8 m level) this age, making the burial of the two levels apparently diachronic. Moreover, the younger age of the lower level is stratigraphically unacceptable. Accordingly, these samples are pinpointed as potential outliers.
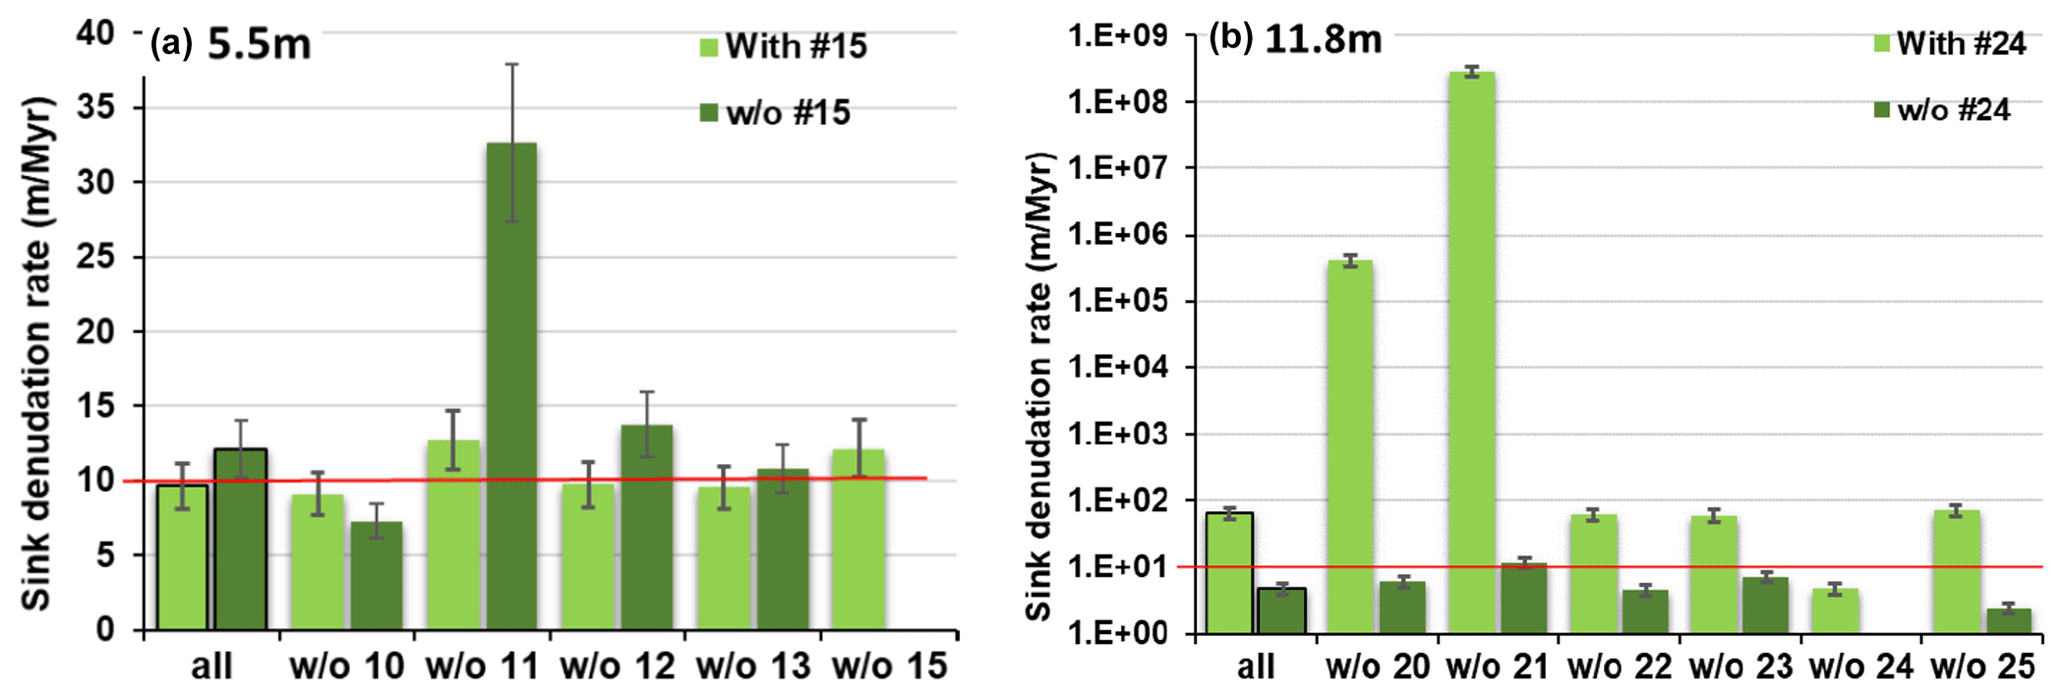
Figure 5Sink denudation rates resulting from the bootstrap test (INV only) with all samples included and when outliers are removed for the upper 5.5 m depth (a) and lower 11.8 m depth quarry levels (b). Note that in panel (b) the y axis is logarithmic, and extreme values appear only when the Dan14-24 sample is included in the modelled dataset, flagging it as a potential outlier. For a reference, the red line is at 10 m Myr−1 in both plots.
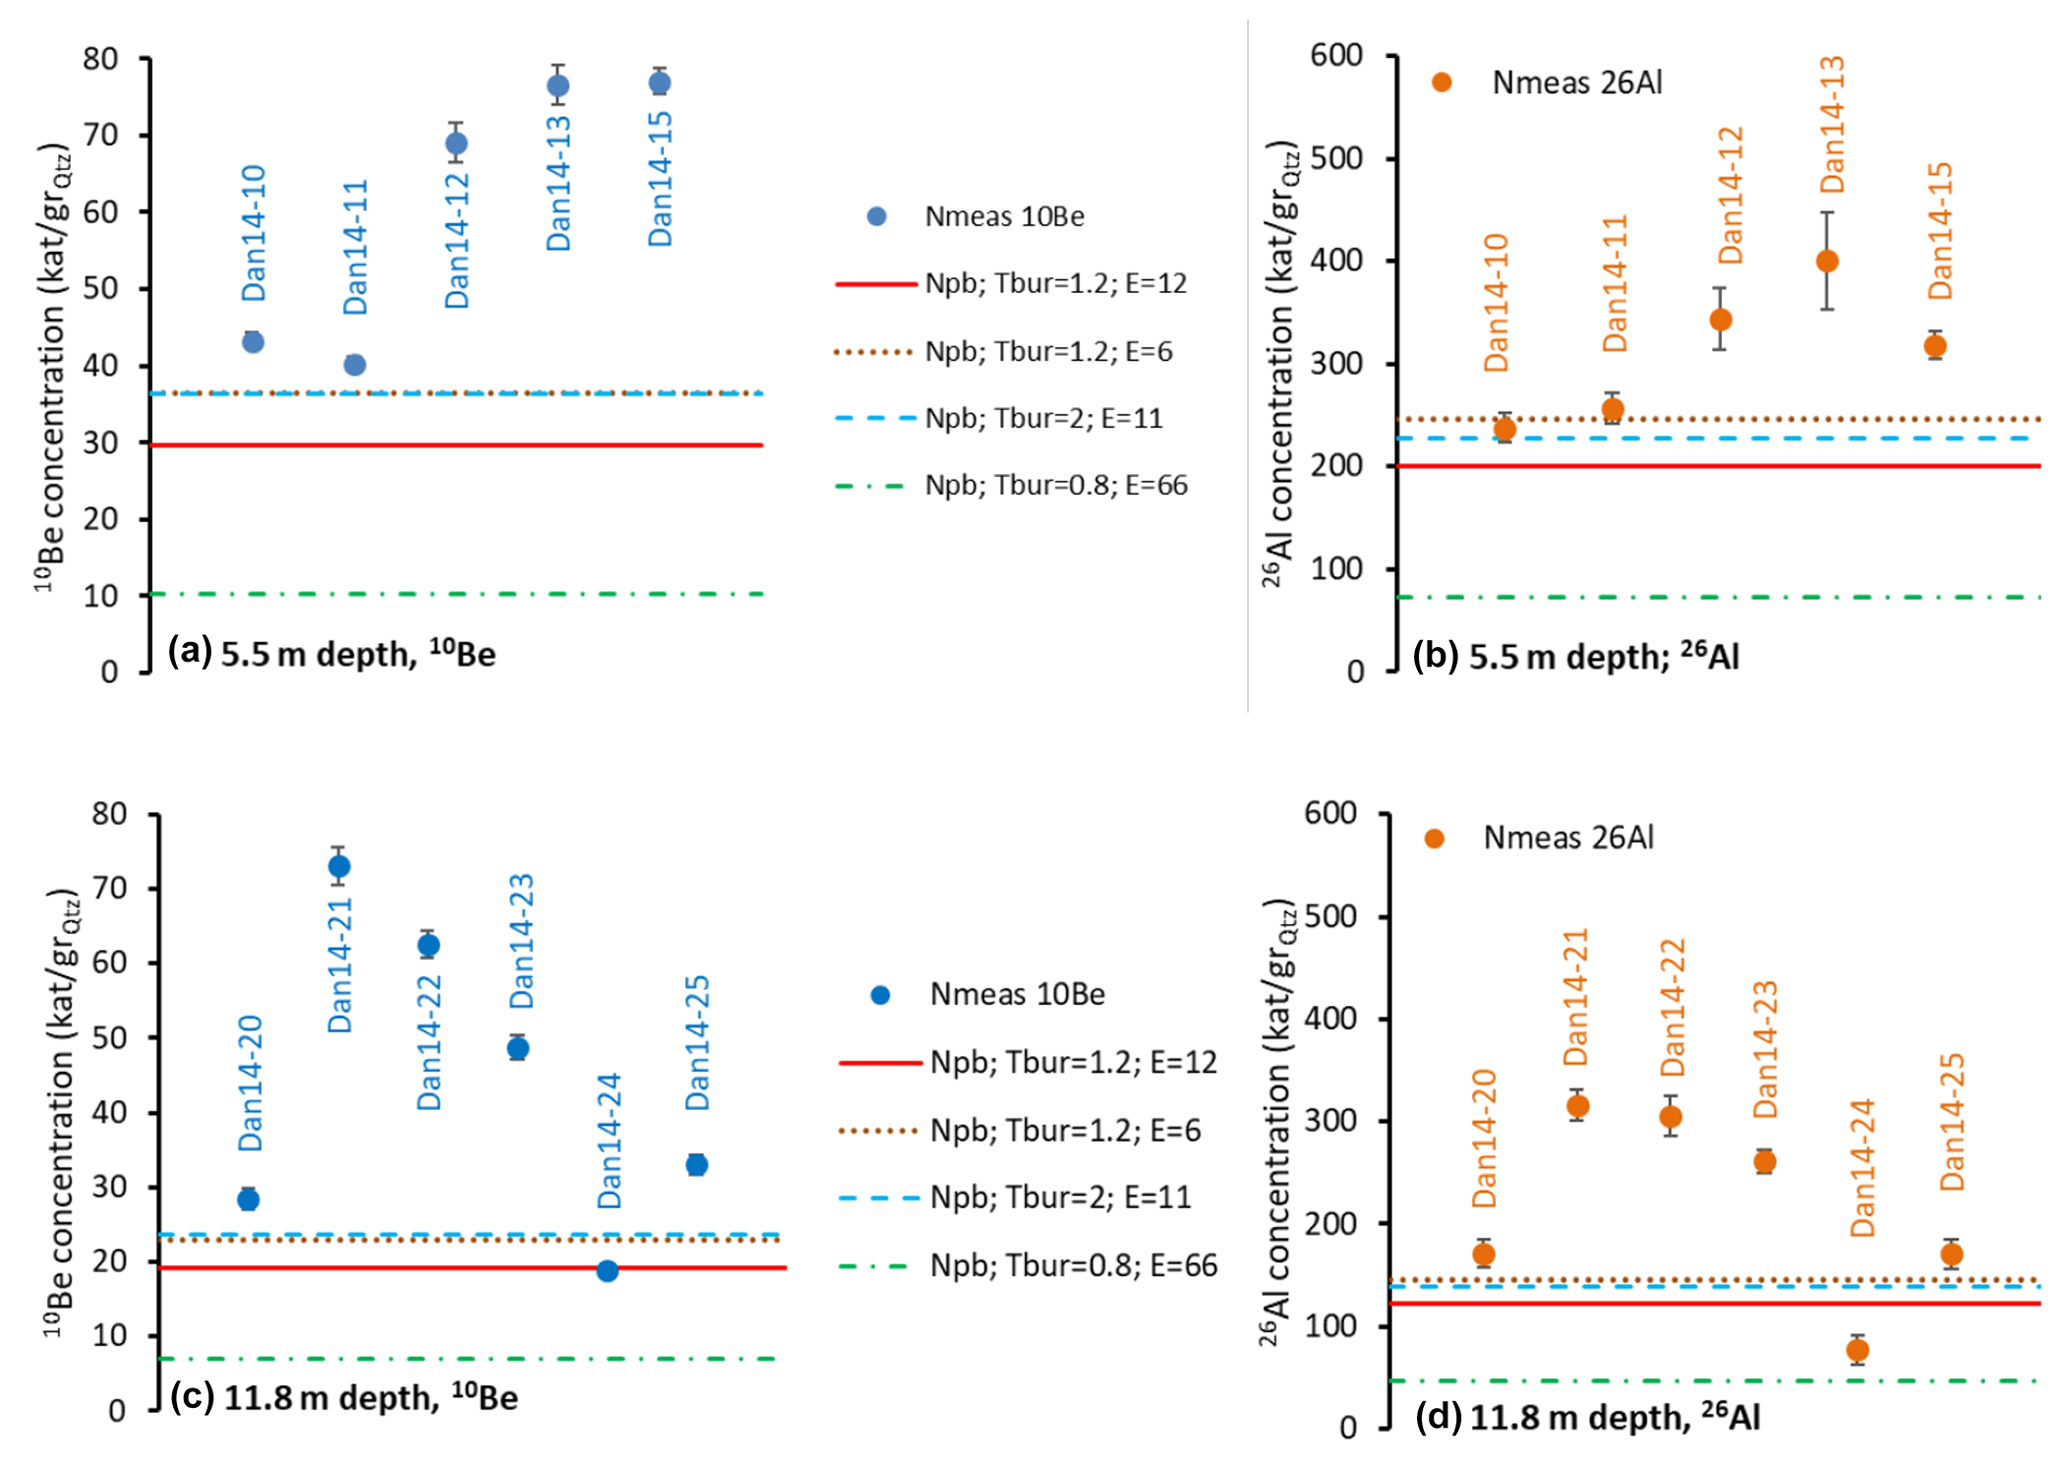
Figure 6Post-burial production test: comparison of measured 10Be and 26Al concentrations (Nmeas; dots) with the calculated post-burial inventories (Npb; lines) for several scenarios of modelled burial age (Tbur; in Ma) and sink denudation rate (E; m Myr−1) pairs. The panels show the 10Be (a, c) and 26Al (b, d) concentrations for the upper level and lower levels, respectively. Samples close to or below the modelled post-burial CRN concentrations have accumulated all their measured CRN inventories after burial at the sink. The only sample failing this test at the most probable 1.2 Ma and 12 m Myr−1 scenario is no. 24. Note that post-burial production is higher if the denudation rate is lower (1.2 Ma and 6 m Myr−1) or if the burial age is older (2 Ma and 11 m Myr−1); in these scenarios the post-burial 26Al inventories of no. 10 and no. 11 contribute a large part to the measured concentrations. The percentages of post-burial and measured 10Be and 26Al concentrations in each scenario appear in Fig. S3.
4.3 Burial ages and denudation rates at the 5.5 m horizon without the outlier
Sample Dan14-15 was pinpointed as an outlier; thus this sample was excluded, and the previous calculations were repeated with the reduced, more consistent dataset. In this way it is possible to test if the model results are more coherent and if the model fit has improved by its omission. With this setting, ISO provided a burial age of 1.21 ± 0.35 Ma. The mean age and standard deviation of the bootstrapped runs were 1.22 ± 0.53 Ma. Simple and bootstrapped INV burial ages agree excellently at 1.22 ± 0.22 Ma and 1.21 ± 0.37 Ma, respectively. Burial ages for individual bootstrap runs varied between 0.90 ± 0.36 Ma and 1.47 ± 0.53 Ma for ISO and 0.88 ± 0.16 Ma and 1.48 ± 0.26 Ma for INV (Fig. 4c, Table S2).
The post-burial denudation rate using all samples remaining in the dataset in this setting was 12.1 ± 1.9 m Myr−1. Interestingly, it had a larger scatter during bootstrapping in this setting compared to the complete dataset, with a maximum value at 32.6 ± 5.3 m Myr−1. This led to a higher bootstrapped average denudation rate with a larger uncertainty of 16.1 ± 11.7 m Myr−1 (Table S2). The model fit was also much better for the dataset when no. 15 is excluded (Rχ2=1.1 and 2.0 for INV and ISO, respectively) compared to the model fit with all samples included (Rχ2=1.8 and 3.0).
In summary, all methods of outlier identification except for the post-burial production test confirmed that Dan14-15 is inconsistent with the rest of the dataset and has a strong influence on the modelled burial age. Therefore, the model results with this sample excluded are considered to be the best-estimate burial durations and sink denudation rates for the terrace at Haslau (Figs. 4a, b; 7a, b; S1).
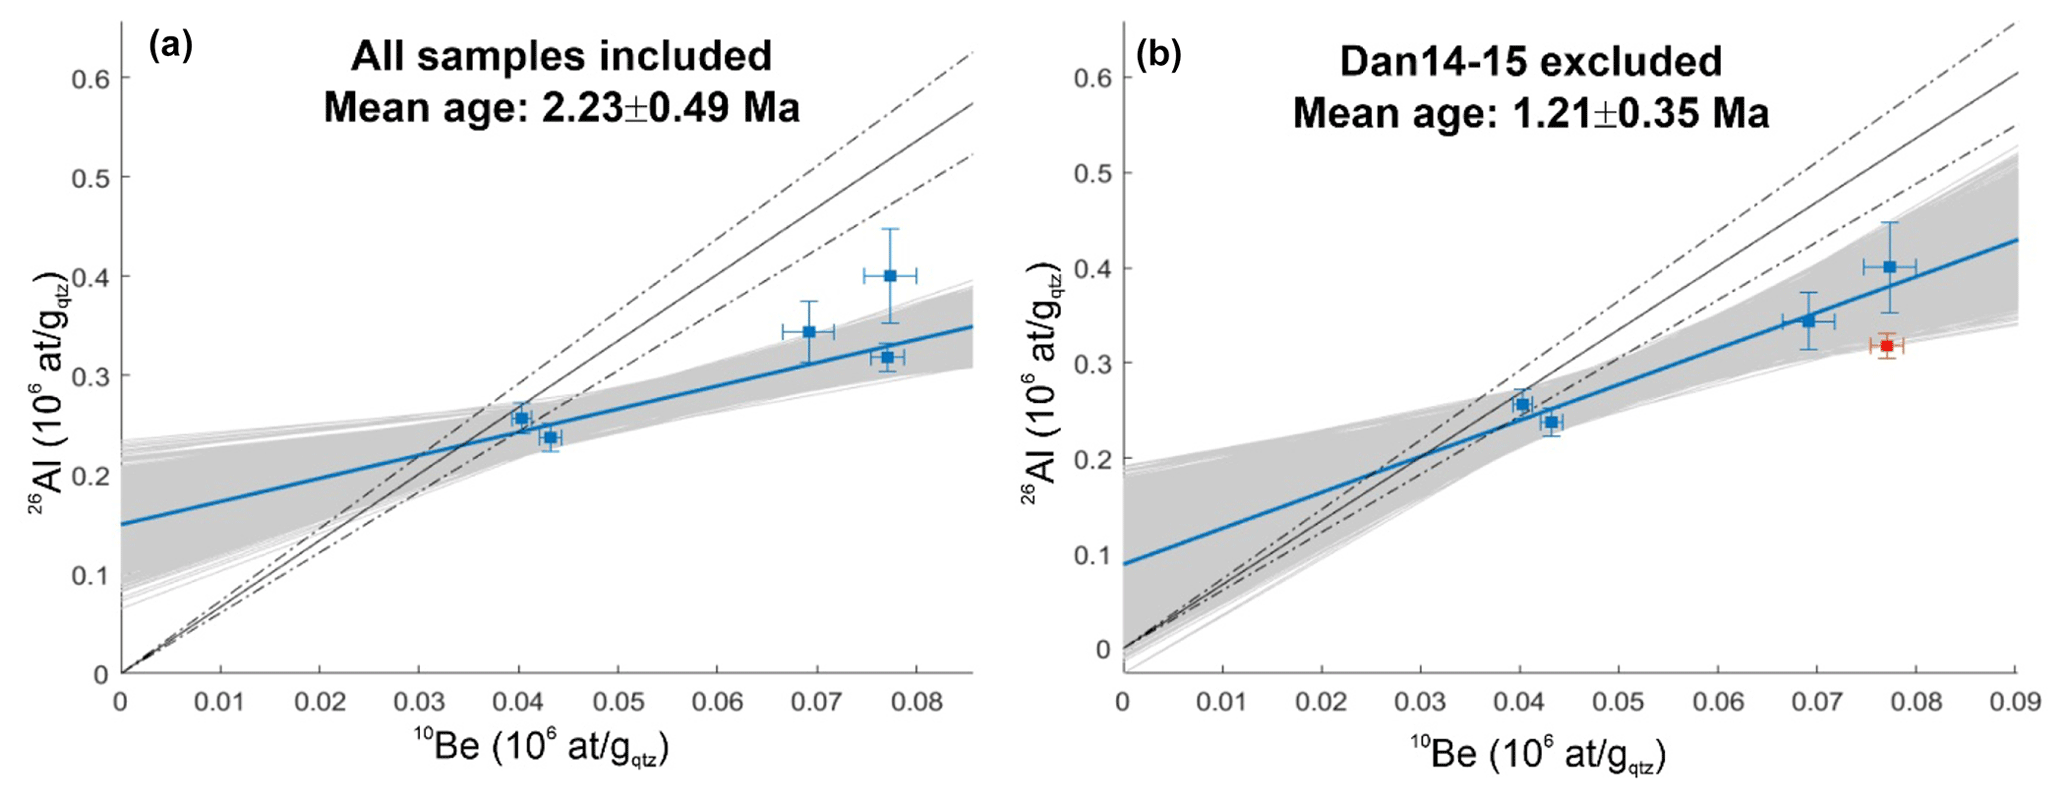
Figure 7Isochron plots of the 5.5 m level with (a) all samples included and (b) Dan14-15 omitted. Grey shadows are the range covered by the Monte Carlo simulation runs, and the blue line is the isochron defined as the Gaussian most probable value of the Monte Carlo simulations. The continuous and dashed black lines represent the 6.7 ± 0.6 initial ratio.
4.4 Burial ages and denudation rates at the 11.8 m horizon with all samples included
The statistical test indicated three potential outliers for the lower level (no. 20, no. 21 or no. 23) due to the very small uncertainties of the samples at the 1σ level, while no outlier was picked using the 2σ uncertainties (see Sect. 3.3.1). Better consistency in this sample set is visualised by the isochron plot, where no data point lies clearly below the line, noting that both the lowest-concentration and highest-concentration samples (no. 24 and no. 21) have a position somewhat underneath (Figs. 3, 8a, S2).
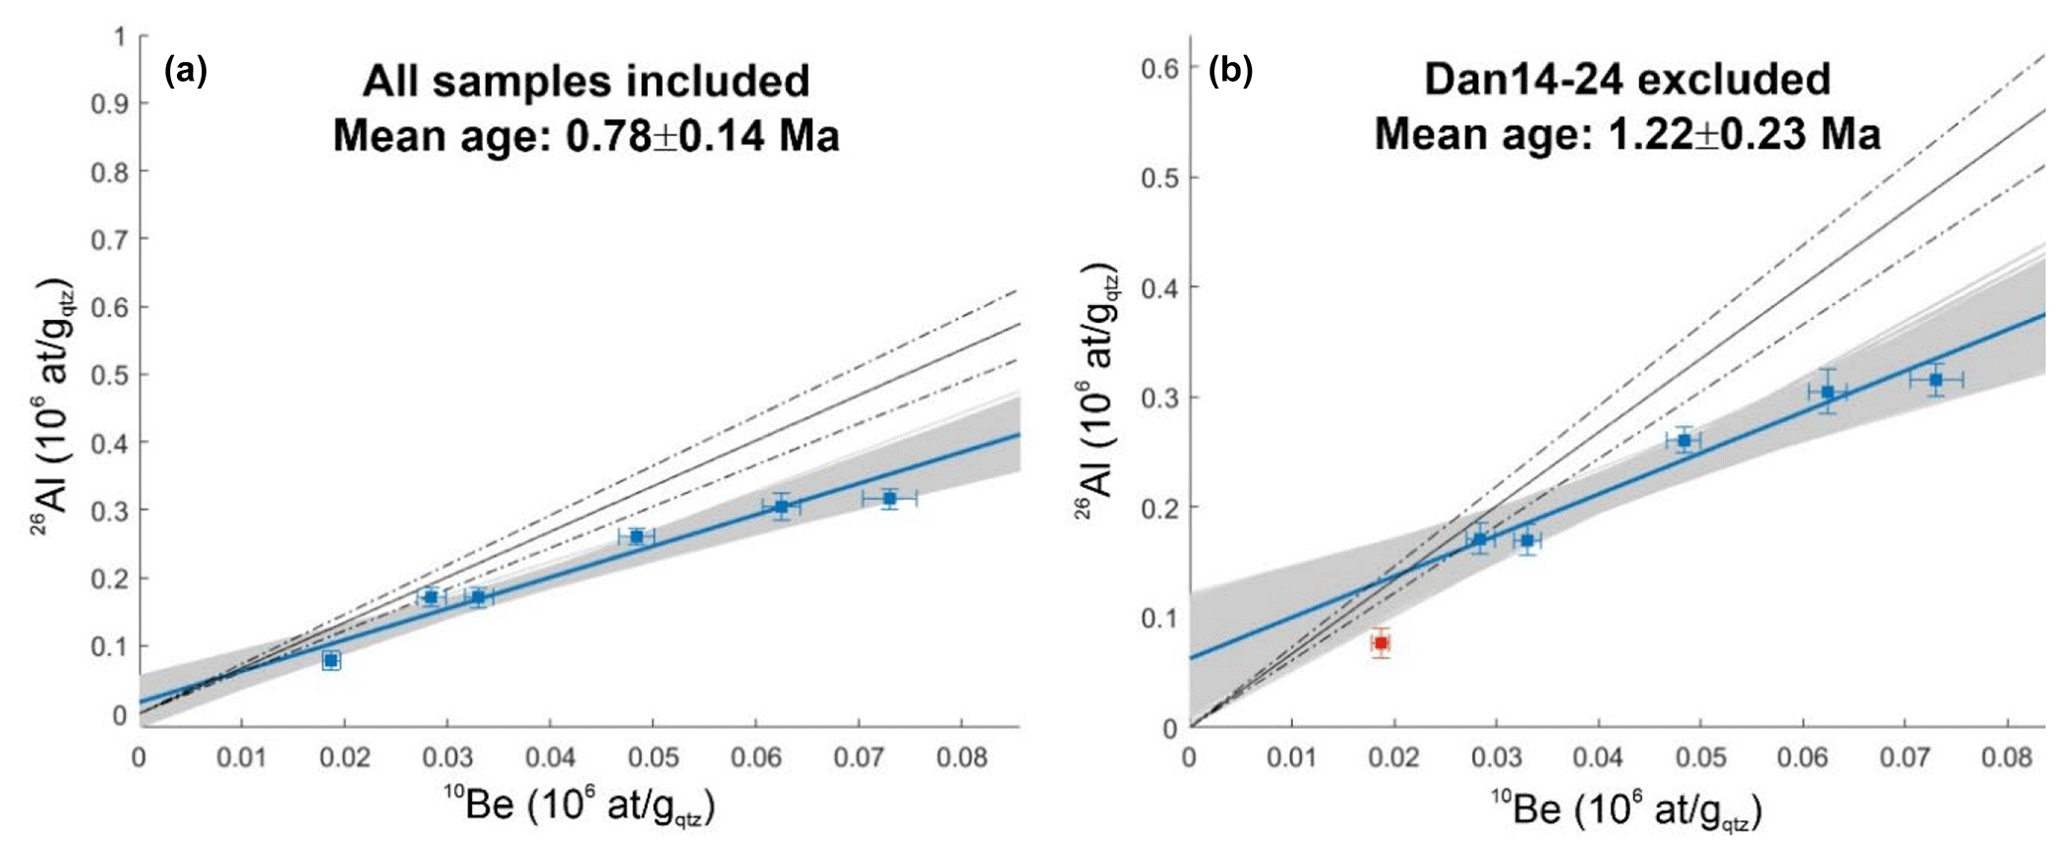
Figure 8Isochron plots of the 11.8 m level with (a) all samples included and (b) Dan14-24 omitted. Grey shadows represent the range of the Monte Carlo simulation runs, and the blue line is the isochron defined as the Gaussian most probable value of the Monte Carlo simulations. The continuous and dashed black lines represent the 6.7 ± 0.6 initial ratio.
With all samples included, burial ages of 0.78 ± 0.14 Ma and 0.82 ± 0.15 Ma were calculated by ISO and INV, respectively. When bootstrapping was applied, the cumulative ISO and INV burial ages were 0.80 ± 0.30 Ma and 0.86 ± 0.29 Ma, respectively. ISO bootstrapped ages varied between 0.44 ± 0.15 Ma and 1.22 ± 0.23 Ma. INV bootstrapped burial ages were similar and varied between 0.58 ± 0.11 Ma and 1.27 ± 0.24 Ma. As expected, for both INV and ISO the youngest ages were obtained with no. 21 omitted and the oldest ages when no. 24 was excluded (Figs. 4b, 8b, S2; Table S2).
The post-burial denudation rate was estimated at 66.1 ± 12.5 m Myr−1 by INV. When bootstrapped, the post-burial denudation rates were extremely variable (Fig. 5b, Table S2), and the lowest value, 4.7 ± 0.8 m Myr−1, was provided when no. 24 was excluded. Most of the results with no. 24 included were between ∼ 60.8 and ∼ 73.5 m Myr−1, with a few runs yielding infinitely high values, suggesting the controlling effect of no. 24 on the results if not omitted. The mean post-burial denudation rate from bootstrapping was not calculated due to this extreme scatter of the results.
The youngest ages were provided when no. 20 and no. 21 were excluded. However, INV revealed that these scenarios are accompanied by unrealistically high sink denudation rates, making these scenarios questionable. The oldest burial age (∼ 1.2–1.3 Ma) and lowest sink denudation rate (∼ 5 m Myr−1) pair was provided by the run where no. 24 was excluded, confirming its controlling effect on model outcomes. Like no. 15 in the upper level, no. 24 is the sample with the lowest CRN ratio in this set. The model fit for the 11.8 m level was the best with the omission of no. 24 (Rχ2=1.3 for INV and 2.4 for ISO, in comparison to Rχ2=2.9 and 4.0 when no. 24 was included; Table S2), also providing support that this sample is inconsistent with the rest of the dataset.
Similarly to the 5.5 m level, the post-burial production test was run for different combinations of burial age and sink denudation rate pairs that were among the modelled bootstrap solutions. For relatively young burial ages and high sink denudation rates (Tbur=0.8 Ma, E=77 m Myr−1) all samples had a post-burial component lower than the measured values for both nuclides (Figs. 6c, d, S3d). However, such sink denudation rates would result in the complete removal of terrace material. For the scenarios of older burial ages the modelled post-burial 10Be and 26Al inventories of no. 24 are well above their measured concentrations (max 121 % and 189 %, respectively, for the scenario of Tbur=1.2 Ma and E=6 m Myr−1) (Figs. 6c, d; S3f, h, j).
Accordingly, when any of samples no. 20, no. 21 and no. 23 were excluded from the age calculation, the dataset provided either unreasonably high denudation rates or a poor model fit. In addition, the resulting burial ages were much lower in comparison to any result calculated for the upper level, ending up in a stratigraphically impossible situation, whereas, if sample no. 24 is omitted, the modelled burial age is in agreement with the burial age of the 5.5 m level. All the above arguments lead to no. 24 being identified as an outlier.
4.5 Burial ages and denudation rates at the 11.8 m horizon without the outlier
With the low-concentration sample (no. 24) omitted from the set at 11.8 m depth (Fig. 8b), the modelled burial ages were 1.22 ± 0.23 Ma and 1.27 ± 0.22 Ma by ISO and INV, respectively. When bootstrapped, both models provided consistent ages with ISO yielding a mean burial age of 1.20 ± 0.34 Ma and INV 1.22 ± 0.28 Ma. The individual bootstrap runs provided burial ages between 0.85 ± 0.25 Ma and 1.28 ± 0.23 Ma for ISO and 0.91 ± 0.16 Ma and 1.34 ± 0.23 Ma for INV (Fig. 4d, Table S2). Sink denudation rates range between 2.4 ± 0.4 m Myr−1 and 11.7 ± 2.1 m Myr−1. The simple and bootstrapped mean values were 4.7 ± 0.8 m Myr−1 and 6.3 ± 1.3 m Myr−1, respectively (Table S2, Figs. 4d, 5b).
4.6 Burial ages and denudation rates when samples are merged in a single dataset.
Taking advantage of INV being suitable for calculating the burial ages and denudation rates whilst accounting for the sample depth, the data from both levels were merged and the bootstrap test was run for this combined dataset (Fig. 9a, Table S3). Our objective here is to explore the influence of outliers on a larger data assemblage.
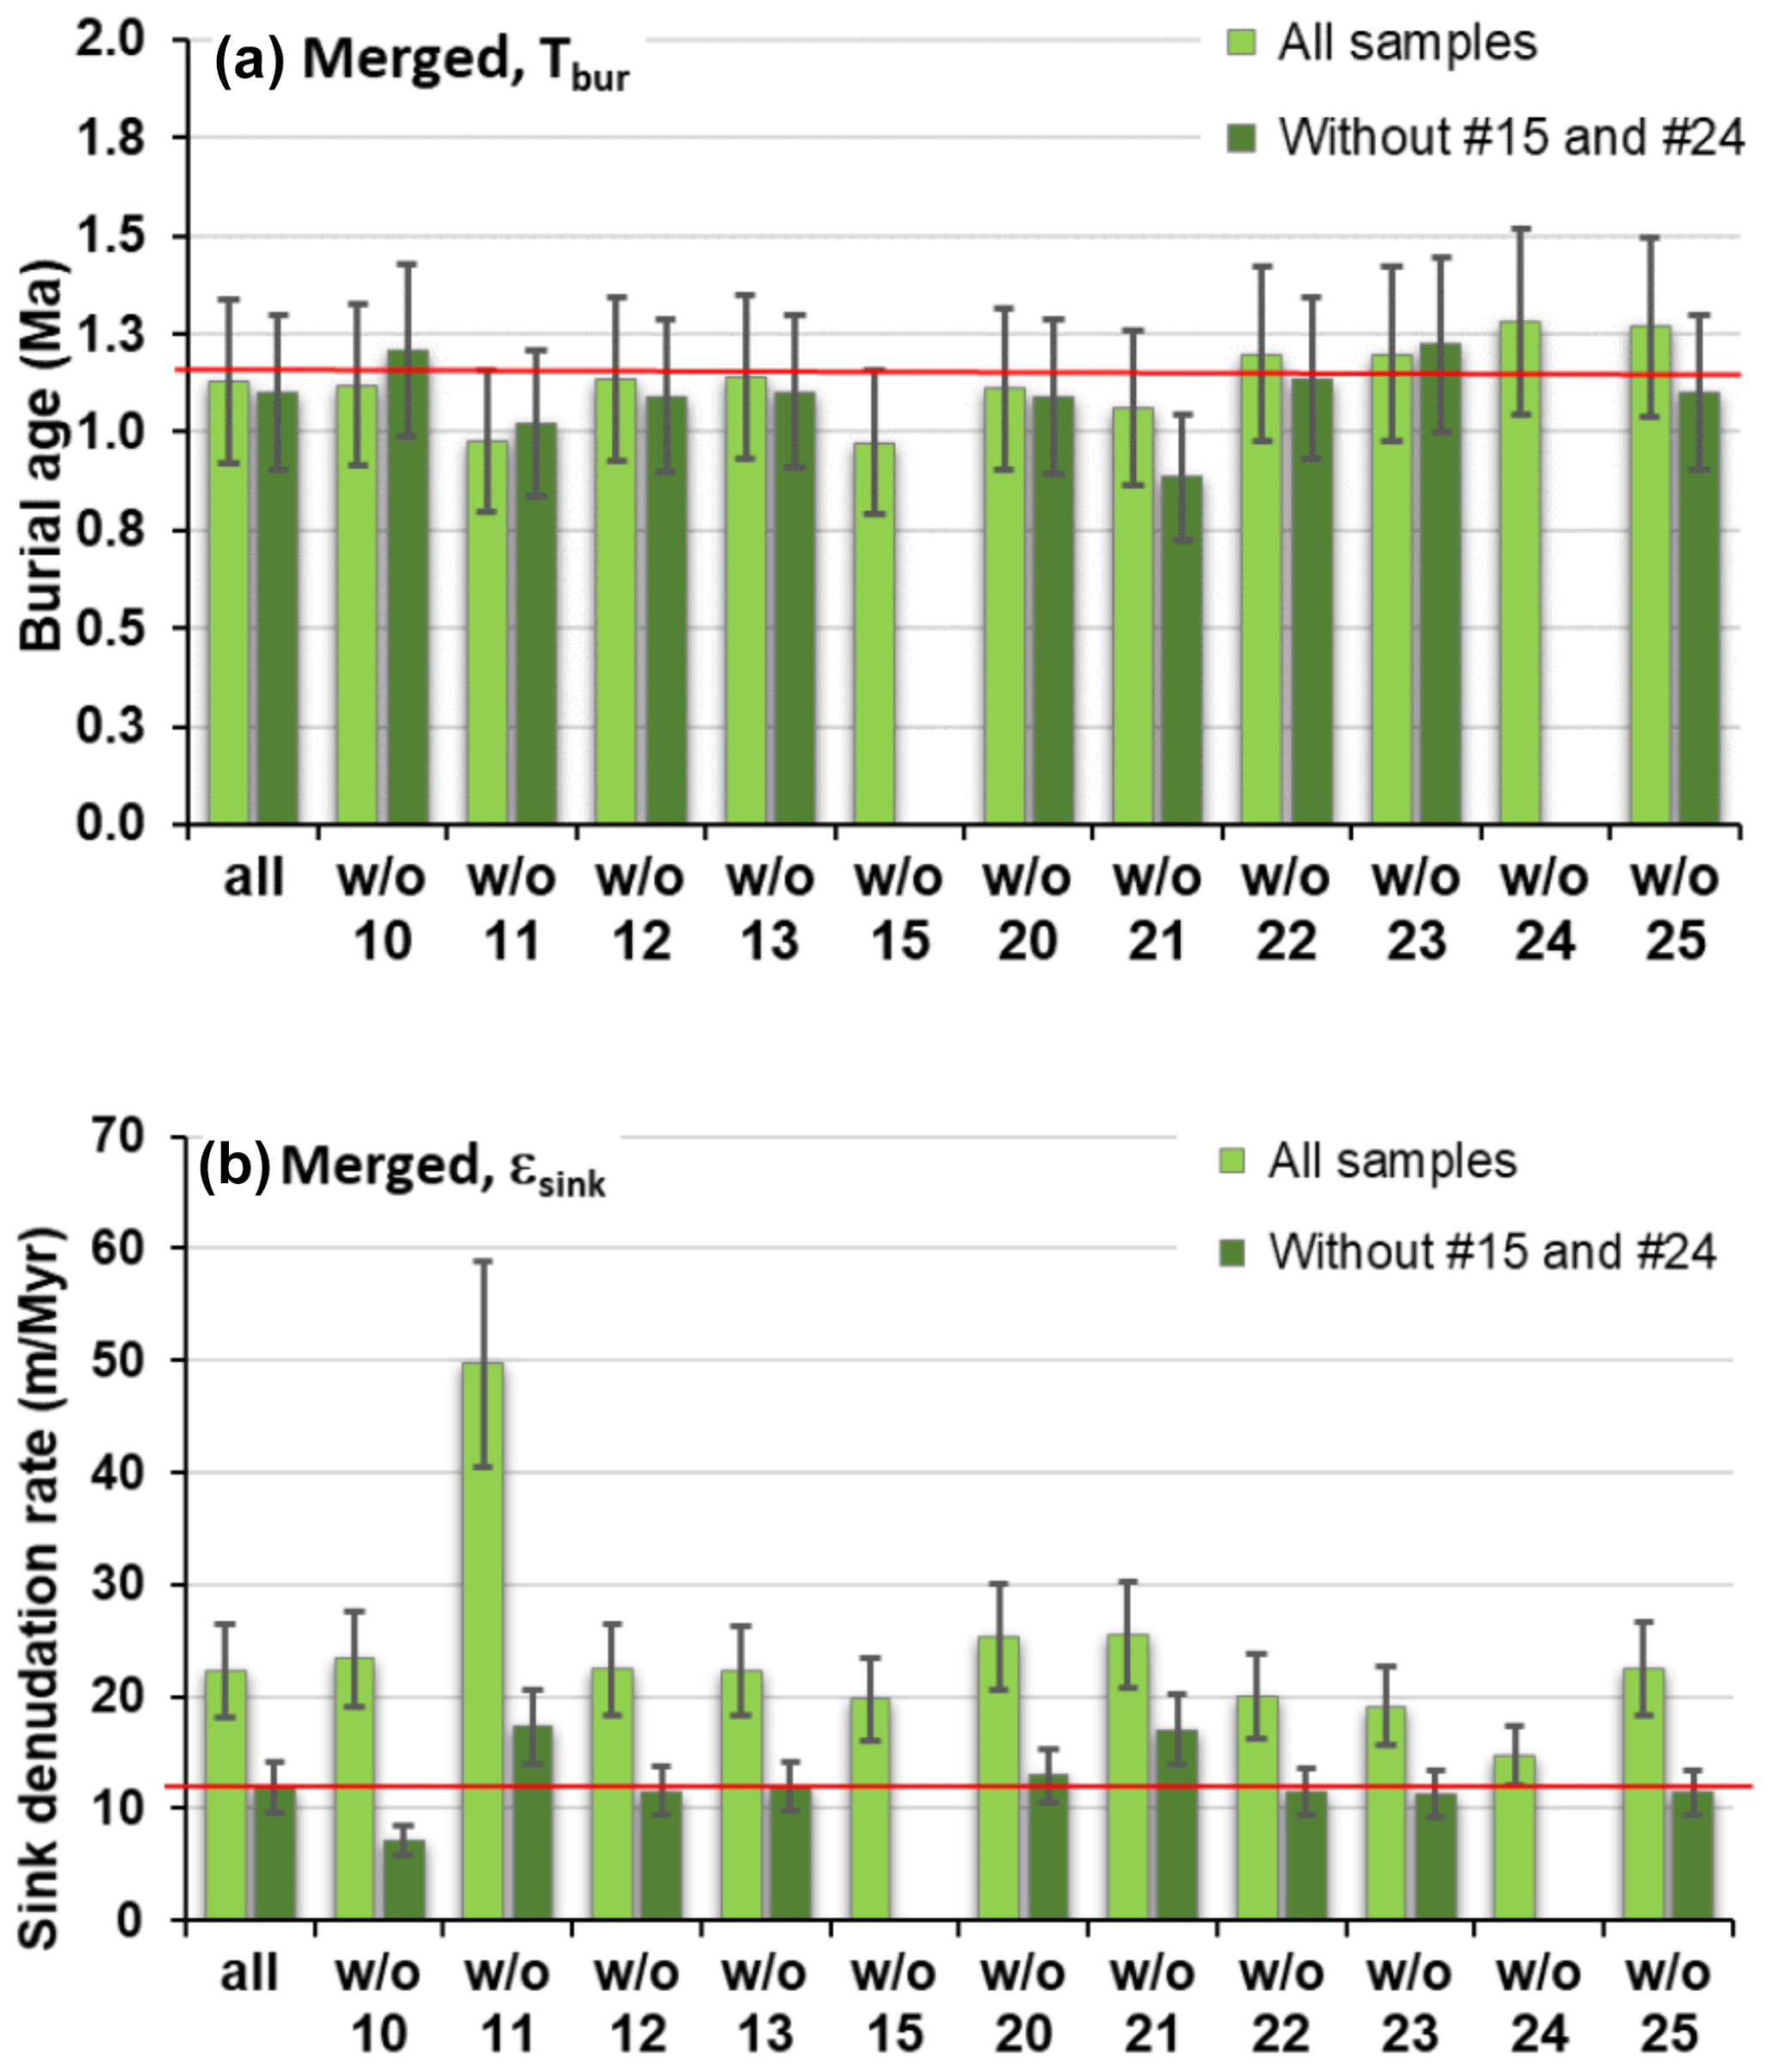
Figure 9Burial ages (a) and sink denudation rates (b) resulting from the bootstrap test using the merged dataset of the two sampled horizons for the scenarios with all samples included (light green) and with the above-identified outliers (no. 15 and no. 24) excluded (dark green). Modelling was done by INV, as only it is suitable to handle samples from variable depths in a single model. The red line in (a) is at 1.2 Ma burial age and in (b) at 12 m Myr−1 denudation rate.
The merged model provided burial ages of 1.13 ± 0.21 Ma and 1.10 ± 0.20 Ma with and without the previously identified outliers (no. 15 and no. 24), respectively. The burial age results of the bootstrap test for the complete dataset were consistent between 0.97 ± 0.18 Ma and 1.28 ± 0.24 Ma with a mean and standard deviation of 1.13 ± 0.23 Ma (Fig. 9a, Table S3). The youngest (0.89 ± 0.16 Ma) and the oldest (1.22 ± 0.22 Ma) bootstrapped burial ages were computed without no. 15 and no. 24, resulting in a slightly younger mean age with a standard deviation of 1.10 ± 0.22 Ma compared to the full dataset.
With the two outliers discarded from the bootstrap test, the sink denudation rate values were lower, and their variability was considerably smaller. The lowest and highest values were 7.1 ± 1.3 m Myr−1 and 17.3 ± 3.3 m Myr−1, respectively, with the mean and standard deviation of 12.4 ± 3.9 m Myr−1 (Fig. 9b, Table S3).
The model fit, as indicated by the Rχ2 values, was much better for the model with the outliers excluded, compared to the model with all samples included (Rχ2=1.0 and Rχ2=3.4, respectively; Table S3). Furthermore, during the bootstrap test for the complete dataset, the two lowest Rχ2 values resulted from the runs with no. 15 and no. 24 omitted, again indicating that these samples are deviating from the rest of the dataset.
5.1 Outlier identification
The complex toolbox of outlier identification offered and tested in this study proved to be more powerful in identifying true outliers of a sample set. It revealed that the statistical method (reduced χ2 test; Ward and Wilson, 1978) based simply on the ratios of the samples is not always suitable for the selection of the real outlier(s) of a sample set. On the one hand, for the upper level, sample Dan14-15 plotting under the isochron line in the space was identified as an outlier by both statistical and bootstrapping methods. It had a strong control on the isochron slope, biasing the burial age and resulting in a lower model fit (Table S2, Figs. 4, 7, S1). On the other hand, for the lower level, no sample with an obvious deviation from the isochron line could be observed and statistically selected at the 2σ uncertainty level (Figs. 3, 8, S2). After running the other outlier identification tests introduced here, Dan14-24 was unequivocally flagged. This sample has low CRN concentrations and relatively high uncertainties; thus it escaped being identified by the statistical test. However, bootstrapping and the post-burial production test clearly indicated it as an outlier:
- (i)
Dan14-24 has a dominating effect on the burial ages by shifting them towards younger values. In addition, a burial age that agrees with the upper level is only obtained when Dan14-24 is excluded (Figs. 4, 7, S2).
- (ii)
The post-burial denudation rates are more stable. Unrealistic values typical for several runs when no. 24 is included disappear, and the model fit is much better when this sample is excluded (Fig. 5, Table S2).
- (iii)
Its low CRN concentrations are most probably dominated by post-burial production, questioning the suitability of its CRN ratio for burial age determination (Figs. 6, S2, S3).
The availability of samples from two depth levels in the stratigraphic superposition was advantageous for crosschecking the depositional age of both horizons. Without outlier identification, the resulting ages at the 11.8 m depth were considerably younger than at the 5.5 m horizon, which is not reconcilable with their stratigraphic position (Fig. 4). When the carefully identified outliers were removed, the burial ages of the two quarry levels converged at ∼ 1.2 Ma.
Using the merged dataset (n=11) the burial age was 1.1 ± 0.3 Ma regardless of whether outliers were included or excluded. This agrees within uncertainty with the burial age provided independently by each sampled level and is not affected by the presence of outliers. This is a significant difference compared to the individual sample sets with five to six cobbles from each level. However, signs of samples no. 15 and no. 24 being incompatible with the rest of the dataset were also present in the case of the merged dataset:
- (i)
The model fit was much worse when they were included.
- (ii)
Their presence or absence was also manifested in a 2-fold increase in the modelled post-burial denudation rate (24.1 ± 4.4 m Myr−1 and 12.4 ± 2.3 m Myr−1, respectively). The lower rate (without the outliers) agrees well with the mean of the rates from the two levels modelled independently (also with no outliers) (Fig. 9, Table S3).
Moreover, bootstrapping provided a more comprehensive way of estimating the uncertainty of the modelled burial ages and post-burial denudation rates by using the mean and standard deviation of the bootstrap model results (Luo et al., 2020).
5.2 Advantages of using a combination of ISO and INV
Both ISO and INV can successfully handle incomplete shielding. A collection of a sample set of at least four to five cobbles from a sample location provides 2–3 degrees of freedom for the model. To achieve a more robust solution by increasing the degrees of freedom of the model, a higher sample number of six to eight cobbles is strongly recommended (more detailed explanation is in the Supplement). Burial ages determined by both methods depend on the spallogenic production rate ratio.
The major advantage of ISO is that it is independent of the measured subsurface depth of the samples. In exchange, it is not suitable for the estimation of the sink denudation rates, and it cannot handle samples from different subsurface depths (Table 3).
Table 3Simplified chart comparing the main advantages of the isochron (ISO) and inverse modelling (INV) burial age dating, highlighting the benefits of testing a dataset using both methods. Yes: relevant; partly: partially relevant; no: irrelevant for the method.
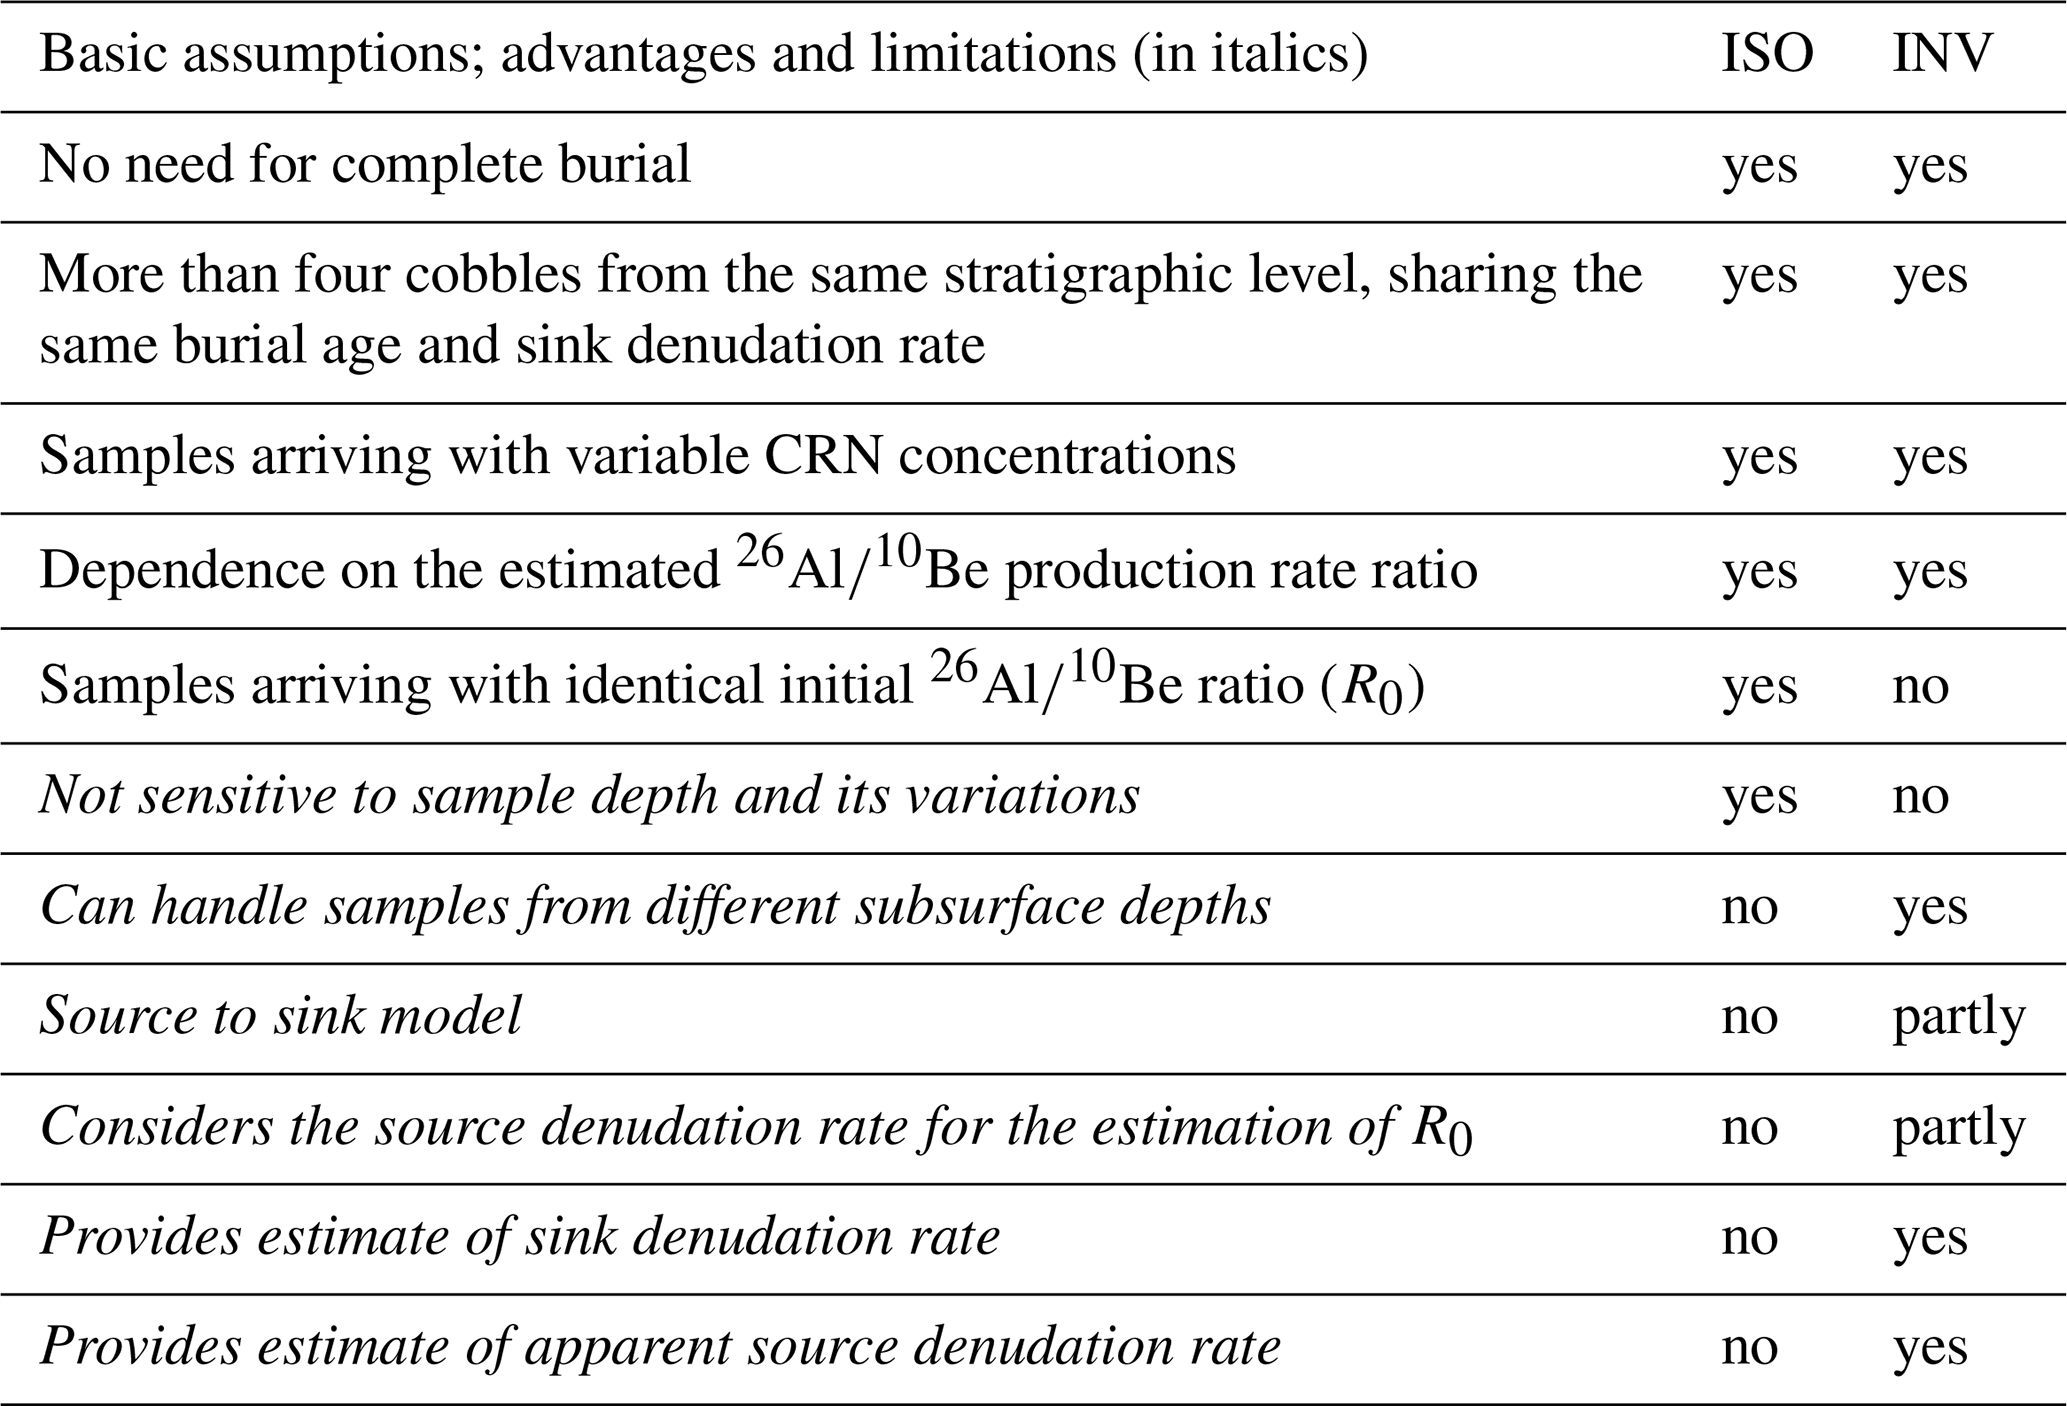
INV requires the exact determination of sample depth and uses this information to model burial age and sink denudation rate pairs. In return, the modelled burial age depends on how accurately the measured sample depth is valid for the entire burial duration of the sample. It accounts for the variability in the CRN concentrations at deposition, allowing the source denudation rate to be a free parameter (Table 3). However, for large catchments with variable production rates, the modelled source denudation rate must be considered as apparent. This number reflects rather the variability in inherited CRN concentrations and ratios than the actual surface denudation rates in the source area.
The two methods are supposed to yield similar burial durations, so their joint application provides means to test whether the basic assumptions and input data are robust. Our results highlight that both methods require a careful outlier identification to achieve a proper determination of the burial age. The iterative approach of simultaneous burial age modelling and outlier identification – exploiting the different strengths and weaknesses of ISO and INV – makes their joint application strongly recommended.
5.3 Burial age of the Haslau terrace
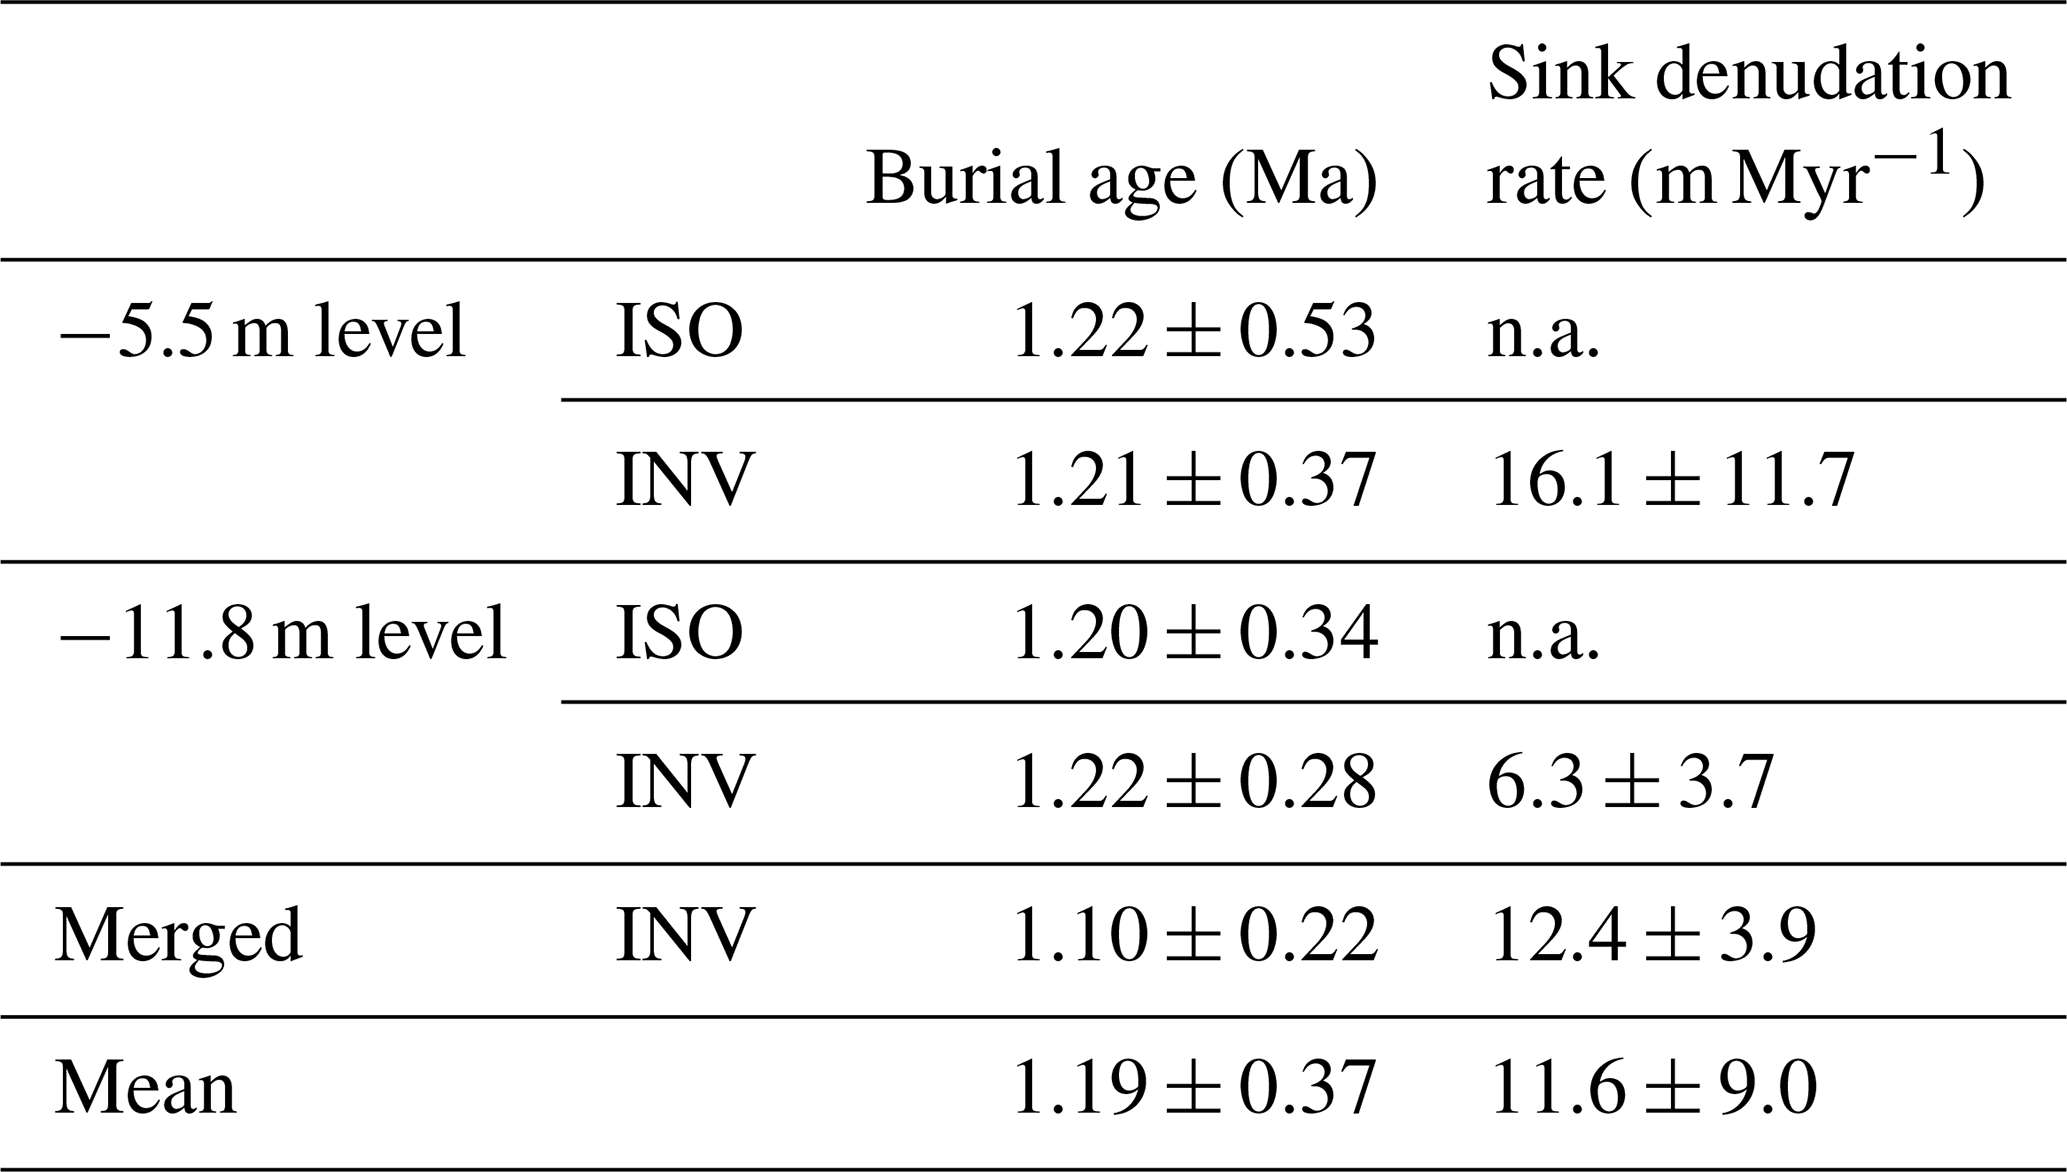
After the exclusion of outliers, the independent modelling using bootstrapping of the two sampled quarry levels provided convergent burial ages of ∼ 1.2 Ma for both levels using both ISO and INV. The mean uncertainties vary between 0.3 and 0.5 Myr (Table 4). The merged dataset using INV yielded a burial age of 1.1 ± 0.2 Ma. All ages are in excellent agreement, yielding a mean and standard deviation of 1.19 ± 0.37 Ma, considered the most probable burial age of the Haslau terrace. This age of terrace abandonment is considerably older than the MIS 12 (424–478 ka) age suggested by morphostratigraphy (Schnabel, 2002). This also implies that the sediment had been deposited by the beginning of the mid-Pleistocene transition (Clark et al., 2006; ca. 1.2–0.7 Ma). Consequently, all terraces above the dated terrace at Haslau an der Donau (levels 4, 5, and 6 in Fig. 1) are older than previously assumed and must have been deposited before the onset of the major alpine glaciations (most probably Pliocene and early Pleistocene). Further numerical age determinations are necessary for a better understanding of the incision of the Danube River and fault-related uplift processes in this part of the Vienna Basin.
Table 4Burial age and sink denudation rate of the Haslau Terrace. The uncertainties of the mean values are defined as the mean of the model uncertainties for the burial age and as the standard deviation for the modelled denudation rates. Sink denudation rates are not available for ISO (n.a.). For details, refer to the text.
5.4 Sink denudation rate of the Haslau terrace
Interestingly, the modelled post-burial denudation rates are different for the upper and lower levels with bootstrap mean and standard deviation values of 16.1 ± 11.7 m Myr−1 and 6.3 ± 3.7 m Myr−1, respectively. The merged model gave 12.4 ± 4.0 m Myr−1 (Table 4).
Changes in denudation rate or sample depth by accumulation and subsequent denudation of cover sediments, like loess on top of the terrace surface, are ubiquitous in the periglacial area of Central Europe (Sprafke, 2016; Lehmkuhl et al., 2021). This suggests that the measured sample depth might not be the result of a long-term steady-state denudation process, but the measured CRN inventories reflect the joint signal of a more complex long-term denudation history of the terrace surface. Therefore, two interpretations of the modelled denudation rates are possible:
-
Using a simple scenario of a long-term steady denudation rate, the mean value of 11.6 ± 9.0 m Myr−1 can be determined using the mean and standard deviation of the three values.
-
In the second scenario, the different time needed by the CRN concentrations at various subsurface depths to become adjusted to a change in surface denudation rates is considered (Braucher et al., 2003). At shallower depth, where CRN production rates are faster, the nuclide inventory needs a shorter time to acclimatise to the new denudation rate and thus record a different, in our case increased, denudation rate of ∼ 16 m Myr−1. At the same time, CRN concentrations of samples from the deeper horizon adjust slower to changes taking place at the surface and thus represent a former (or long-term average) denudation rate of ∼ 6 m Myr−1.
Both modelled denudation rates are rather low and in accordance with sink denudation rates derived from 10Be depth profiles in Danube terraces from the northern part of the Pannonian Basin located 100–150 km east of Haslau. Those terraces in a similar setting eroded at 6+2/−3 m Myr−1 to 11 m Myr−1, and the maximum denudation rate of a gently dipping pediment surface was 20 m Myr−1 (Ruszkiczay-Rüdiger et al., 2016, 2018).
5.5 Uplift rate of the Arbesthal Hills
The incision rate of the Danube at Haslau was estimated to be 21–56 m Myr−1 during the last 1.2 ± 0.4 Myr (Fig. 1) using the elevation of the terrace base (170 ± 2 m a.s.l.) and of the base of the recent alluvium of the Danube River (131 ± 5 m a.s.l., defined using well data from Geosphere Austria). Elevation data of the base of the fluvial sediments are used because these are not affected by surface denudation and can be directly compared. As the incision of the Danube was triggered by uplift related to the Quaternary activity of the VBTFS, the estimated incision rate is considered a relevant estimate of the uplift rate of the Arbesthal Hills.
This rate is similar to the incision/uplift rates inferred from terraces in the Vienna Basin to the north of the Danube, which are 17–33 m Myr−1 for the last 240 ± 50 kyr (western part, Gänsendorf terrace) and 49–111 m Myr−1 for the last 340 ± 170 kyr (eastern part, Schlosshof terrace; Braumann et al., 2019). In comparison, uplift rates integrated for a longer time span from the eastern border of the Vienna Basin from 4.3 ± 0.2 Ma and > 1.7 Myr old cave sediments in the Hainburg hill and in the Malé Karpaty (Little Carpathians) recorded uplift rates of 37–43 m Myr−1 and < 26 m Myr−1, respectively (Neuhuber et al., 2020; Šujan et al., 2017).
Following the Danube course downstream from the Vienna Basin to the western rim of the Danube Basin, a maximum uplift rate of < 60 m Myr−1 could be derived from an optically stimulated luminescence (OSL)-dated terrace at Nickelsdorf (Zámolyi et al., 2017). On the eastern side of the subsiding Danube Basin, age determination of the terrace levels showed the gradual increase in the uplift rates towards the hinge of the Transdanubian Range (Ruszkiczay-Rüdiger et al., 2016, 2018, 2020). In the transition zone from the basin to the uplifted basement block the incision/uplift rate changes from ∼ 19–34 m Myr−1 in the west to 50–86 m Myr−1 in the east for the last ∼ 1 Myr. In the Transdanubian Range, the uplift rate during the last 3.4–2.4 Myr was 50–70 m Myr−1. On the opposite side of the Danube a similar rate (∼ 57 m Myr−1) was provided by a dated terrace at Nová Vieská for the last ∼ 1.4 Myr (Vlačiky et al., 2017). These rates are similar to the uplift/denudation rate of 50–60 m Myr−1 estimated in the central part of the Transdanubian range based on denudation surfaces shaped by eolian erosion (Ruszkiczay-Rüdiger et al., 2011, 2020). Apatite fission track ages suggest a very similar long-term exhumation rate of the westernmost Carpathians of 30–70 m Myr−1 (Danišík et al., 2004).
The joint application of ISO and INV provided burial ages that are in excellent agreement for two different depth levels of the terrace sediment at Haslau an der Donau. The recognition and exclusion of true outliers are vital for the calculation of burial ages, as the bootstrap test demonstrated that a single sample may bias the model outcomes considerably. It has been shown that each outlier identification approach is sensitive to different sample parameters (coherence of CRN ratios, low CRN concentrations, samples with low or high CRN uncertainty), and a sample should be regarded as a true outlier if it is pinpointed by at least two methods. Moreover, the exclusion of the outlying samples is considered valid if the model outcome is more coherent and the model fit is better by its omission than when it is included in the dataset. The presented complex way of outlier identification applied in iterative steps during age determination proved to be robust and is recommended as a powerful strategy for future studies in similar settings. Moreover, bootstrapping proved to be a novel, more comprehensive way of estimating the uncertainty of the modelled burial ages and post-burial denudation rates.
The INV modelling of the merged dataset including samples from both quarry levels highlighted that a larger sample set is less sensitive to the presence of outliers; therefore the collection of at least five to six or more samples for age determination with either ISO or INV is recommended.
The uplift rate of 21–56 m Myr−1 estimated for the Arbesthal Hills using the 1.2 ± 0.4 Ma CRN burial age of the Haslau terrace is similar to published Late Pliocene to Quaternary uplift/incision rates ranging between ∼ 20 and ∼ 100 m Myr−1 along the Danube River in the Vienna and Danube basins despite the diverse tectonic settings of the studied areas.
Data used in the paper have been published in Ruszkiczay-Rüdiger et al. (2021). The data are also presented in Table 1.
The supplement related to this article is available online at https://doi.org/10.5194/egqsj-74-59-2025-supplement.
ZRR and SN undertook major roles in the conceptualisation, project organisation, burial age modelling, data interpretation, preparation of the manuscript and artwork. EH worked on the isochron burial age modelling and JN on designing the model setup, and both authors contributed to the data interpretation and preparation of the manuscript.
At least one of the (co-)authors is a member of the editorial board of E&G Quaternary Science Journal. The peer-review process was guided by an independent editor, and the authors also have no other competing interests to declare.
Publisher’s note: Copernicus Publications remains neutral with regard to jurisdictional claims made in the text, published maps, institutional affiliations, or any other geographical representation in this paper. While Copernicus Publications makes every effort to include appropriate place names, the final responsibility lies with the authors.
We are grateful for Kurt Decker's support in the field, for Stefanie Maierhofer's work on the section presented in Fig. 2 and for Darryl Granger for his comments on a previous version of the manuscript. The reviews by Veerle Vanacker and an anonymous reviewer are thankfully acknowledged. We are indebted to Gilles Rixhon, associate editor, for his editorial work and constructive comments on the manuscript.
This research has been supported by the National Research, Development and Innovation Office of Hungary (grant no. NKFIH FK 124807) and the Stiftung Aktion Österreich-Ungarn (grant nos. 90öu17 and 98öu17).
This paper was edited by Gilles Rixhon and reviewed by Veerle Vanacker and one anonymous referee.
Balco, G. and Rovey, C. W.: An isochron method for cosmogenic-nuclide dating of buried soils and sediments, Am. J. Sci., 308, 1083–1114, https://doi.org/10.2475/10.2008.02, 2008.
Balco, G.: Production rate calculations for cosmic-ray-muon-produced 10Be and 26Al benchmarked against geological calibration data, Quat. Geochronol. 39, 150–173, https://doi.org/10.1016/j.quageo.2017.02.001, 2017.
Bender, A. M., Amos, C. B., Bierman, P., Rood, D. H., Staisch, L., Kelsey, H., and Sherrod, B.: Differential uplift and incision of the Yakima River terraces, central Washington State, J. Geophys. Res.-Sol. Earth, 121, 365–384, https://doi.org/10.1002/2015JB012303, 2016.
Blard, P. H., Bourlés, D., Lave, J., and Pik, R.: Applications of ancient cosmic-ray exposures: theory, techniques and limitations, Quat. Geochronol., 1, 59–73, https://doi.org/10.1016/j.quageo.2006.06.003, 2006.
Borchers, B., Marrero, S., Balco, G., Caffee, M., Goehring, B., Lifton, N., Nishiizumi, K., Phillips, F., Schaefer, J., and Stone, J.: Geological calibration of spallation production rates in the CRONUS-Earth project, Quat. Geochronol., 31, 188–198, https://doi.org/10.1016/j.quageo.2015.01.009, 2016.
Braucher, R., Brown, E. T., Bourlès, D. L., and Colin, F.: In situ-produced 10Be measurements at great depths: implications for production rates by fast muons, Earth Planet. Sci. Lett., 211, 251–258, https://doi.org/10.1016/S0012-821X(03)00205-X, 2003.
Braucher, R., Del Castillo, P., Siame, L., Hidy, A. J., and Bourles, D. L.: Determination of both exposure time and denudation rate from an in situ-produced 10Be depth profile: A mathematical proof of uniqueness. Model sensitivity and applications to natural cases, Quat. Geochronol., 4, 56–64, https://doi.org/10.1016/j.quageo.2008.06.001, 2009.
Braucher, R., Merchel, S., Borgomano, J., and Bourles, D. L.: Production of cosmogenic radionuclides at great depth: A multi element approach, Earth Planet. Sc. Lett., 309, 1–9, https://doi.org/10.1016/j.epsl.2011.06.036, 2011.
Braumann, S. M., Neuhuber, S., Fiebig, M., Schaefer, J. M., and Lüthgens, C.: Challenges in constraining ages of fluvial terraces in the Vienna Basin (Austria) using combined isochron burial and pIRIR225 luminescence dating, Quatern. Int., 509, 87–102, https://doi.org/10.1016/j.quaint.2018.01.009, 2019.
Brocard, G. Y., van der Beek, P. A., Bourlés, D. L., Siame, L. L., and Mugnier, J. L.: Long-term fluvial incision rates and postglacial river relaxation time in the French Western Alps from 10Be dating of alluvial terraces with assessment of inheritance, soil development and wind ablation effects, Earth Planet. Sc. Lett., 209, 197–214, https://doi.org/10.1016/S0012-821X(03)00031-1, 2003.
Clark, P. U., Archer, D., Pollard, D., Blum, J. D., Rial, J. A., Brovkin, V., Mix, A. C., Pisias, N. G., and Roy, M.: The middle Pleistocene transition: characteristics, mechanisms, and implications for long-term changes in atmospheric pCO2, Quaternary Sci. Rev., 25, 3150–3184, https://doi.org/10.1016/j.quascirev.2006.07.008, 2006.
Chmeleff, J., von Blanckenburg, F., Kossert, K., and Jakob, D.: Determination of the 10Be half-life by multicollector ICP-MS and liquid scintillation counting, Nucl. Instrum. Meth. B., 268, 192–199, https://doi.org/10.1016/j.nimb.2009.09.012, 2010.
Danišík, M., Dunkl, I., Putiš, M., Frisch, W., and Krá, J.: Tertiary burial and exhumation history of basement highs along the NW margin of the Pannonian Basin – an apatite fission track study, Austrian J. Earth Sc., 95, 60–70, ISSN 0251-7493, 2004.
Decker, K., Peresson, H., and Hinsch, R.: Active tectonics and Quaternary basin formation along the Vienna Basin transform fault, Quaternary Sci. Rev., 24, 307–322, https://doi.org/10.1016/j.quascirev.2004.04.012, 2005.
Dunai, T. J.: Cosmogenic Nuclides. Principles, Concepts and Applications in the Earth Surface Sciences, Cambridge Univ Press, New York, 187 pp., ISBN 13 978-0-511-67752-6, 2010.
Erlanger, E. D., Granger, D. E., and Gibbon, R. J.: Rock uplift rates in South Africa from isochron burial dating of fluvial and marine terraces, Geology, 40, 1019–1022, https://doi.org/10.1130/G33172.1, 2012.
Fenton, C. R., Binnie, S. A., Dunai, T., and Niedermann, S.: The SPICE project: Calibrated cosmogenic 26Al production rates and cross-calibrated 26Al/10Be, 26Al/14C, and 26Al/21Ne ratios in quartz from the SP basalt flow, AZ, USA, Quat. Geochron., 67, 101218, https://doi.org/10.1016/j.quageo.2021.101218, 2022.
Finnegan, N. J., Schumer, R., and Finnegan, S.: A signature of transience in bedrock river incision rates over timescales of 104–107 years, Nature, 505, 391–396, https://doi.org/10.1038/nature12913, 2014.
Fuchs, W. and Grill, R.: Geologische Karte von Wien und Umgebung 1 : 200.000 Ed. Geologische Bundesanstalt Wien, 1984.
Geosphere Austria, online well database: Selected drillings of OMV with report, GeoSphere Austria https://gis.geosphere.at/maps/services/bohrungen/schussbohrungen/MapServer/WMSServer (last access: 12 February 2025), 2025.
Gibbard, P. L. and Lewin, J.: River incision and terrace formation in the Late Cenozoic of Europe, Tectonophysics, 474, 41–55, https://doi.org/10.1016/j.tecto.2008.11.017, 2009.
Gosse, J. C. and Phillips F. M.: Terrestrial in situ cosmogenic nuclides: theory and application, Quaternary Sci. Rev., 20, 1475–1560, https://doi.org/10.1016/S0277-3791(00)00171-2, 2001.
Granger, D. E.: A review of burial dating methods using 26Al and 10Be, in: In Situ-Produced Cosmogenic Nuclides and Quantification of Geological Processes, edited by: Alonso-Zarza A. M. and Tanner L. H., Geological Society of America, 1–16, https://doi.org/10.1130/2006.2415(01), 2006.
Granger, D. E.: Cosmogenic nuclide burial dating in archaeology and paleoanthropology, in: Treatise on Geochemistry (2nd edn.), edited by: Holland H. D. and Turekian K. K., Oxford: Elsevier, 14, 81–97, https://doi.org/10.1016/B978-0-08-095975-7.01208-0, 2014.
Granger, D. E. and Muzikar, P. F.: Dating sediment burial with in situ-produced cosmogenic nuclides: theory, techniques, and limitations, Earth Planet. Sc. Lett., 188, 269–281, https://doi.org/10.1016/S0012-821X(01)00309-0, 2001.
Granger, D. E., Kirchner, J. W., and Finkel, R. C.: Quaternary downcutting rate of the New River, Virginia, measured from differential decay of cosmogenic 26Al and 10Be in cave-deposited alluvium, Geology, 25, 107–110, https://doi.org/10.1130/0091-7613(1997)025<0107:QDROTN>2.3.CO;2, 1997.
Harzhauser, M., Daxner-Höck, G., and Piller, W. E.: An integrated stratigraphy of the Pannonian (Late Miocene) in the Vienna Basin, Austrian J. Earth Sc., 95/96, 6–19, ISSN 0251-7493, 2004.
Harzhauser, M., Peresson, M., Benold, C., Mandic, O., Coric, S., and De Lange, G. J.: Environmental shifts in and around Lake Pannon during the Tortonian Thermal Maximum based on a multi-proxy record from the Vienna Basin (Austria, Late Miocene, Tortonian), Palaeogeog. Palaeocl., 610, 111332, https://doi.org/10.1016/j.palaeo.2022.111332, 2023.
Harzhauser, M., Kranner, M., Siedl, W., Conradi, F., and Piller, W. E.: The Neogene of the Vienna Basin: a synthesis, edited by: Tari, G. C., Kitchka, A:, Krézsek, C., Lučić, D., Markič, M:, Radivojević, D., Sachsenhofer, R. F., Šujan, M., The Miocene Extensional Pannonian Subbasin, V:1: Regional Geology, Geological Society, London, Special Publications v. 554, https://doi.org/10.1144/SP554-2023-168, 2024.
Hassinger, H.: Geomorphologische Studien aus dem inneralpinen Wiener Becken und seinem Randgebirge, Geogr. Abhandlungen VI I I, Heft 3, Leipzig-Teubner, 206 p., 1905.
Heisinger, B., Lal, D., Jull, A. J. T., Kubik, P., Ivy-Ochs, S., Neumaier, S., Knie, K., Lazarev, V., and Nolte, E.: Production of selected cosmogenic radionuclides by muons: 1. Fast muons, Earth and Planet. Sc. Lett., 200, 345–355, https://doi.org/10.1016/S0012-821X(02)00640-4, 2002a.
Heisinger, B., Lal, D., Jull, A. J. T., Kubik, P., Ivy-Ochs, S., Knie, K., and Nolte, E.: Production of selected cosmogenic radionuclides by muons: 2. Capture of negative muons, Earth and Planet. Sc. Lett., 200, 357–369, https://doi.org/10.1016/S0012-821X(02)00641-6, 2002b.
Hintersberger, E., Decker, K., Lomax, J., and Lüthgens, C.: Implications from palaeoseismological investigations at the Markgrafneusiedl Fault (Vienna Basin, Austria) for seismic hazard assessment, Nat. Hazards Earth Syst. Sci., 18, 531–553, https://doi.org/10.5194/nhess-18-531-2018, 2018.
Hinsch, R., Decker, K., and Wagreich, M.: 3-D mapping of segmented active faults in the southern Vienna Basin, Quaternary. Sci. Rev., 24, 321–336, https://doi.org/10.1016/j.quascirev.2004.04.011, 2005.
Jolivet, M., Braucher, R., Dovchintseren, D., Hocquet, S., Schmitt, J. M., and Aster Team: Erosion around a large-scale topographic high in a semi-arid sedimentary basin: Interactions between fluvial erosion, aeolian erosion and aeolian transport, Geomorphology, 386, 107747, https://doi.org/10.1016/j.geomorph.2021.107747, 2001.
Knudsen, M. F., Nørgaard, J., Grischott, R., Kober, F., Egholm, D. L., Hansen, T. M., and Jansen, J. D.: New cosmogenic nuclide burial-dating model indicates onset of major glaciations in the Alps during Middle Pleistocene Transition, Earth Planet. Sc. Lett., 549, 116491, https://doi.org/10.1016/j.epsl.2020.116491, 2020.
Korschinek, G., Bergmaier, A., Faestermann, T., Gerstmann, U. C., Knie, K., Rugel, G., Wallner, A., Dillmann, I., Dollinger, G., Lierse von Gostomski, Ch., Kossert, K., Maiti, M., Poutivtsev, M., and Remmert, A.: A new value for the half-life of 10Be by heavy-ion elastic recoil detection and liquid scintillation counting, Nucl. Instrum. Meth. B., 268, 187–191, https://doi.org/10.1016/j.nimb.2009.09.020, 2010.
Küpper, H.: Uroberfläche und jüngste Tektonik im südlichen Wiener Becken. Skizzen zum Antlitz der Erde, Kober-Festschrift, 376–386, Wien, 1953.
Lal, D.: Cosmic ray labeling of erosion surfaces – In situ nuclide production rates and erosion models, Earth Planet. Sc. Lett., 104, 424–439, https://doi.org/10.1016/0012-821X(91)90220-C, 1991.
Lebatard, A.-É., Alcicek, M. C., Rochette, P., Khatib, S., Vialet, A., Boulbes, N., Bourlès, D. L., Demory, F., Guipert, G., Mayda, S., Titov, V. V., Vidal, L., and Lumley, H.: Dating the Homo erectus bearing travertine from Kocabaş, (Denizli, Turkey) at least 1.1 Ma, Earth Planet. Sc. Lett. 390, 8–18, https://doi.org/10.1016/j.epsl.2013.12.031, 2014.
Lehmkuhl, F., Nett, J. J., Pötter, S., Schulte, P., Sprafke, T., Jary, Z., Antoine, P., Wacha, L., Wolf D., Zerboni, A., Hosek, J., Markovic, S. B., Obrecht, I., Sümegi, P., Veres, D., Zeeden, C., Boemke, B., Schaubert, V., Viehweger, J., and Hambach, U.: Loess landscapes of Europe – Mapping, geomorphology, and zonal differentiation, Earth-Sci. Rev. 215, 103496, https://doi.org/10.1016/j.earscirev.2020.103496, 2021.
Lotter, M. G., Kuman, K., and Granger, D. E.: Cosmogenic nuclide burial dating at Penhill Farm: An Earlier Stone Age Acheulean locality in the lower Sundays River Valley, South Africa, Quat. Geochronol., 75, 101431, https://doi.org/10.1016/j.quageo.2023.101431, 2023.
Luo, L., Granger, D. E., Tu, H., Lai, Z., Shen, G., Bae, C. J., Ji, X., and Liu, J.: The first radiometric age by isochron 26Al/10Be burial dating for the Early Pleistocene Yuanmou hominin site, southern China, Quat. Geochronol., 55, 101022, https://doi.org/10.1016/j.quageo.2019.101022, 2020.
Mencin Gale, E., Rupnik, P. J., Akçar, N., Christl, M., Vockenhuber, C., Anselmetti, F. S., and Šmuc, A.: The onset of Pliocene–Early Pleistocene fluvial aggradation in the Southeastern Alpine Foreland (Velenje Basin, Slovenia) and its paleoenvironmental implications, J. Quaternary Sci., 30, 691–709, https://doi.org/10.1002/jqs.3623, 2024.
Neuhuber, S., Plan, L., Gier, S., Hintersberger, E., Lachner, J., Scholz, D., Lüthgens, C., Braumann, S., Bodenlenz, F., Voit, K., and Fiebig, M.: Numerical age dating of cave sediments to quantify vertical movement at the Alpine-Carpathian transition in the Plio- and Pleistocene, Geologica Carpath., 71, 539–557, https://doi.org/10.31577/GeolCarp.71.6.5, 2020.
Nishiizumi, K.: Preparation of 26Al AMS standards, Nucl. Instruments B, 223–224, 388–392, https://doi.org/10.1016/s0168-583x(04)00600-7, 2004.
Nørgaard, J., Jansen, J. D., Neuhuber, S., Ruszkiczay-Rüdiger, Z., and Knudsen, M. F.: P–PINI: A cosmogenic nuclide burial dating method for landscapes undergoing non-steady erosion, Quat. Geochronol., 74, 101420, https://doi.org/10.1016/j.quageo.2022.101420, 2023.
Odom, W. E. and Granger, D. E.: The Pliocene-to-present course of the Tennessee River, J. Geol., 130, 325–333, https://doi.org/10.1086/719951, 2022.
Pappu, S., Gunell, Y., Akhilesh, K., Braucher, R., Taieb, M., Demory, F., and Thouveny, N.: Early Pleistocene presence of Acheulian hominins in South India, Science, 331, 1596–1599, https://doi.org/10.1126/science.1200183, 2011.
Rixhon, G.: Deeper underground: Cosmogenic burial dating of cave-deposited alluvium to reconstruct long-term fluvial landscape evolution, Earth-Sci. Rev., 239, 104357, https://doi.org/10.1016/j.earscirev.2023.104357, 2023.
Rixhon, G., Braucher, R., Bourlès, D., Siame, L., Bovy, B., and Demoulin, A.: Quaternary river incision in NE Ardennes (Belgium)-Insights from 10Be/26Al dating of river terraces, Quaternary Geochronol., 6, 273–284, https://doi.org/10.1016/j.quageo.2010.11.001, 2011.
Rixhon, G., Bourlès, D. L., Braucher, R., Siame, L., Cordy, J. M., and Demoulin, A.: 10Be dating of the Main Terrace level in the Amblève valley (Ardennes, Belgium): new age constraint on the archaeological and palaeontological filling of the Belle-Roche palaeokarst, Boreas, 43, 528–542, https://doi.org/10.1111/bor.12066, 2014.
Rixhon, G., Briant, R. M., Cordier, S., Duval, M., Jones, A., and Scholz, D.: Revealing the pace of river landscape evolution during the Quaternary: recent developments in numerical dating methods, Quaternary Sci. Rev., 166, 91–113, https://doi.org/10.1016/j.quascirev.2016.08.016, 2017.
Rodés, Á., Pallàs, R., Braucher, R., Moreno, X., Masana, E., and Bourlés, D. L.: Effect of density uncertainties in cosmogenic 10Be depth-profiles: Dating a cemented Pleistocene alluvial fan (Carboneras Fault, SE Iberia), Quat. Geochronol., 6, 186–194, https://doi.org/10.1016/j.quageo.2010.10.004, 2011.
Ruszkiczay-Rüdiger, Zs., Braucher, R., Csillag, G., Fodor, L., Dunai, T.J., Bada, G., Bourlés, D., and Müller, P.: Dating Pleistocene aeolian landforms in Hungary, Central Europe, using in situ produced cosmogenic 10Be, Quat. Geochronol., 6, 515–529, https://doi.org/10.1016/j.quageo.2011.06.001, 2011.
Ruszkiczay-Rüdiger, Zs., Braucher, R., Novothny, Á., Csillag, G., Fodor, L., Molnár, G., Madarász, B., and ASTER Team.: Tectonic and climatic forcing on terrace formation: coupling in situ produced 10Be depth profiles and luminescence approach, Danube River, Hungary, Central Europe, Quaternary Sci. Rev., 131, 127–147, https://doi.org/10.1016/j.quascirev.2015.10.041, 2016.
Ruszkiczay-Rüdiger, Z., Balázs, A., Csillag, G., Drijkoningen, G., and Fodor, L.: Uplift of the Transdanubian Range, Pannonian Basin: How fast and why?, Global Planet. Change, 103263, 1–17, https://doi.org/10.1016/j.gloplacha.2020.103263, 2020.
Ruszkiczay-Rüdiger, Zs., Csillag, G., Fodor, L., Braucher, R., Novothny, Á., Thamó-Bozsó, E., Virág, A., Pazonyi, P., Timár, G., and ASTER Team.: Integration of new and revised chronological data to constrain the terrace evolution of the Danube River (Gerecse Hills, Pannonian Basin), Quat. Geochronol., 48, 148–170, https://doi.org/10.1016/j.quageo.2018.08.003, 2018.
Ruszkiczay-Rüdiger, Zs., Neuhuber, S., Braucher, R., Lachner, J., Steier, P., Wieser, A., Braun, M., and ASTER Team.: Comparison and performance of two cosmogenic nuclide sample preparation procedures of in situ produced 10Be and 26Al, J. Radioan. Nucl. Ch., 329, 1523–1536, https://doi.org/10.1007/s10967-021-07916-4, 2021.
Salcher, B. C., Meurers, B., Smit, J., Decker, K., Hölzel, M., and Wagreich, M.: Strike-slip tectonics and Quaternary basin formation along the Vienna Basin fault system inferred from Bouguer gravity derivatives, Tectonics, 31, 1–20, https://doi.org/10.1029/2011TC002979, 2012.
Schaller, M., Ehlers, T. A., Stor, T., Torrent, J., Lobato, L., Christl, M., and Vockenhuber, C.: Timing of European fluvial terrace formation and incision rates constrained by cosmogenic nuclide dating, Earth Planet. Sci. Lett., 451, 221–231, https://doi.org/10.1016/j.epsl.2016.07.022, 2016.
Schnabel, W.: Geologische Karte von Niederösterreich. Geologie der österreichischen Bundesländer, Wien, Geologische Bundesanstalt, 2002.
Siame, L., Bellier, O., Braucher, R., Sebrier, M., Cushing, M., Bourles, D. L., Hamelin, B., Baroux, E., de Voogd, B., Raisbeck, G., and Yiou, F.: Local erosion rates versus active tectonics: cosmic ray exposure modelling in Provence (South-East France), Earth Planet. Sci. Lett., 220, 345–364, https://doi.org/10.1016/s0012-821x(04)00061-5, 2004.
Siedl, W., Strauss, P., Sachsenhofer, R. F., Harzhauser, M., Kuffner, T., and Kranner, M.: Revised Badenian (middle Miocene) depositional systems of the Austrian Vienna Basin based on a new sequence stratigraphic framework, Austrian J. Earth Sc., 113, 87–110, https://doi.org/10.17738/ajes.2020.0006, 2020.
Sprafke, T.: Löss in Niederösterrich Archiv quartärer Klima- und Landschaftsveränderungen, Würzbug University Press, 253 pp. (PhD thesis), 2016.
Stone, J. O.: Air pressure and cosmogenic isotope production, J. Geophys. Res., 105, 23753, https://doi.org/10.1029/2000JB900181, 2000.
Stiny, J.: Zur Kenntnis jugendlicher Krustenbewegungen im Wiener Becken, Jahrbuch der Geologischen Bundesanstalt, 82, 75–102, 1932.
Štor, T., Schaller, M., Merchel, S., Martínek, K., Rittenour, T., Rugel, G., and Scharf, A.: Quaternary evolution of the Ploučnice River system (Bohemian Massif) based on fluvial deposits dated with optically stimulated luminescence and in situ produced cosmogenic nuclides, Geomorphology, 329, 152–169, https://doi.org/10.1016/j.geomorph.2018.12.019, 2019.
Šujan, M., Lačný, A., Braucher, R., Magdolen, P., and ASTER Team: Early Pleistocene age of fluvial sediment in the Stará Garda Cave revealed by 26Al/10Be burial dating: implications for geomorphic evolution of the Malé Karpaty Mts. (Western Carpathians), Acta Carsol., 46, 251–264, https://doi.org/10.3986/ac.v46i2-3.5157, 2017.
Šujan, M., Braucher, R., Šujan, M., Hók, J., Povinec, P. P., Šipka, F., ASTER Team, Rugel, G., and Scharf, A.: The tectono-sedimentary evolution of a major seismogenic zone with low slip rate activity: A geochronological and sedimentological investigation of the Dobrá Voda Depression (Western Carpathians), Sediment. Geol., 383, 248–267, https://doi.org/10.1016/j.sedgeo.2019.02.003, 2019.
Vandenberghe, J.: River terraces as a response to climatic forcing: formation processes, sedimentary characteristics and sites for human occupation, Quaternary Int., 370, 3–11, https://doi.org/10.1016/j.quaint.2014.05.046, 2015.
Vermeesch, P.: CosmoCalc: an Excel add-in for cosmogenic nuclide calculations, Geochem. Geophy. Geosy., 8, 1–14, https://doi.org/10.1029/2006GC001530Q08003, 2007.
Vermeesch, P.: IsoplotR: A free and open toolbox for geochronology, Geosci. Front., 9, 1479–1493, https://doi.org/10.1016/j.gsf.2018.04.001, 2018.
Vlačiky, M., Šujan, M., Rybár, S., and Braucher, R.: Nová Vieska locality: fauna, sediments and their dating-new results, in: 15th Christmas Geological Workshop SGS-New Findings of the Structure and Evolution of the Western Carpathians, Mente et Malleo (MeM)-Newsl. Slovak Geol. Soc.(SGS), 2, 57, 2017.
Ward, G. K. and Wilson, S. R.: Procedures for comparing and combining radiocarbon age determinations: a critique, Archaeometry, 20, 19–31, 1978.
Wessely, G.: Structure and development of the Vienna Basin in Austria, in: The Pannonian Basin: A Study in Basin Evolution, edited by: Royden, L. H. and Horváth, F., AAPG Mem., 333–346, 1988.
Zámolyi, A., Salcher, B., Draganits, E., Exner, U., Wagreich, M. Gier, S. Fiebig, M., Lomax, J., Surányi, G., Diel, M., and Zámolyi, F.: Latest Pannonian and Quaternary evolution at the transition between Eastern Alps and Pannonian Basin: new insights from geophysical, sedimentological and geochronological data, Int. J. Earth Sci., 106, 1695–1721, https://doi.org/10.1007/s00531-016-1383-3, 2017.
Zhao, Z., Granger, D., Zhang, M., Kong, X., Yang, S., Chen, Y., and Hu, E.: A test of the isochron burial dating method on fluvial gravels within the Pulu volcanic sequence, West Kunlun Mountains, China, Quat. Geochronol., 34, 75–80, https://doi.org/10.1016/j.quageo.2016.04.003, 2016.
- How to cite
- Abstract
- Kurzfassung
- Introduction
- Geology and geomorphological setting of the sample location
- Data and methods of age determination
- Results
- Discussion
- Conclusions
- Data availability
- Author contributions
- Competing interests
- Disclaimer
- Acknowledgements
- Financial support
- Review statement
- References
- Supplement