the Creative Commons Attribution 4.0 License.
the Creative Commons Attribution 4.0 License.
 | 06 Mar 2023
Chronological and sedimentological investigations of the Late Pleistocene succession in Osterbylund (Schleswig-Holstein, Germany)
Christine Thiel
Michael Kenzler
Hans-Jürgen Stephan
Manfred Frechen
Brigitte Urban
Melanie Sierralta
Thiel, C., Kenzler, M., Stephan, H.-J., Frechen, M., Urban, B., and Sierralta, M.: Chronological and sedimentological investigations of the Late Pleistocene succession in Osterbylund (Schleswig-Holstein, Germany), E&G Quaternary Sci. J., 72, 57–72, https://doi.org/10.5194/egqsj-72-57-2023, 2023.
The age of the push moraine complex Wallsbüll-Böxlund, Schleswig-Holstein, is unclear despite investigations in this area for decades. To address the timing of formation of both the push moraine complex and the peat and soils found in its depressions, an outcrop in Osterbylund (OBL) was investigated. Optically stimulated luminescence and dating, as well as pollen analyses, were undertaken with the aim to correlate the soils OBL 1 to OBL 4 to interglacials and interstadials. The chronological studies were accompanied by detailed sedimentological investigations. The results of the pollen analyses put the peat unambiguously to the Eemian; the peat is equivalent to OBL 1. The overlying sands and the other intercalated soils are to be placed into the early Weichselian. While for OBL 2 the assignment to the Brörup interstadial is clear, it is more difficult to clearly correlate OBL 3 and OBL 4 to an interstadial due to poor luminescence signal resetting of the sands, especially above OBL 4. Considering all data available, it is most likely that OBL 3 formed during the Odderade interstadial and OBL 4 during the Keller interstadial. From the Eemian to early Weichselian ages of the peat and soils it is evident that the push moraine complex is of Saalian age; a Weichselian ice margin further in the west, as assumed in other studies, can therefore be excluded.
Die Altersstellung des Stauchmoränenkomplexes Wallsbüll-Böxlund in Schleswig-Holstein ist trotz jahrzehntelanger Untersuchungen noch ungeklärt. Die in einem Aufschluss in Osterbylund (OBL) aufgeschlossenen Sedimente und Torfe sowie Böden wurden zur Klärung dieser Frage und auch zur Korrelation der Böden OBL 1 bis OBL 4 mit den bekannten Interglazialen und Interstadialen mittels optisch stimulierter Lumineszenz und Uran-Thorium sowie Pollenanalysen datiert. Detaillierte sedimentologische Aufnahmen ergänzten die chronologischen Arbeiten. Die Pollenanalysen ordnen den in Depressionen vorkommenden Torf dem Eem zu; der Torf ist mit OBL 1 gleichzusetzen. Die aufliegenden Sande und die übrigen eingeschalteten Böden können alle in das Frühweichsel gestellt werden. Während für OBL 2 die Stellung in das Brörup-Interstadial aufgrund der Daten belegbar ist, gestalten sich die Zuordnungen für OBL 3 und OBL 4 etwas schwieriger, da schlechte Bleichung der Lumineszenzsignale der Sande insbesondere oberhalb von OBL 4 Unsicherheiten mit sich bringen. Unter Berücksichtigung der Gesamtheit der Daten ist eine Korrelation von OBL 3 mit dem Odderade-Interstadial und von OBL 4 mit dem Keller-Interstadial am wahrscheinlichsten. Aus diesen Daten ergibt sich zudem eine saalezeitliche Entstehung des Stauchmoränenwalls; ein, wie in anderen Studien angenommen, weichselzeitlicher Eisrand noch weiter westlich als der hier untersuchte Standort kann somit ausgeschlossen werden.
- Article
(11349 KB) - Full-text XML
-
Supplement
(1364 KB) - BibTeX
- EndNote


The extent of the Weichselian ice sheet and the environment in the southern Baltic region and bordering areas in northern Germany has received large attention (e.g. Houmark-Nielson, 2010; Kenzler et al., 2017, 2018; Rinterknecht et al., 2014). In contrast to detailed knowledge on the late Weichselian ice dynamics and its climatic implications (e.g. Hughes et al., 2016; Lüthgens et al., 2020), the early Weichselian in this area has not yet been investigated in its entirety. This period, however, is especially interesting due to the changes between cold and warm phases. While these climate variations are well preserved in ice cores (e.g. Seierstad et al., 2014), there is a lack of local terrestrial archives documenting the highly variable conditions at that time.
Among the few terrestrial sites in northern Germany where palaeosols as indicators for warm phases are preserved is the push moraine ridge in Osterbylund, northern Schleswig-Holstein, close to the Danish border (Fig. 1). However, whether the palaeosols represent the Weichselian remains controversially discussed. It has been argued that the soils got deformed by the youngest Saalian (“Warthian”) glacier advance during marine isotope stage (MIS) 6 and had therefore been interpreted as “intra-Saalian”, with an attribution of the lowermost and most intensively developed soil to the intra-Saalian “Treene interglacial” (e.g. Stremme, 1981, 1986; Stremme et al., 1982; Stremme and Weinhold, 1982; Zöller, 1986). In contrast, it has been claimed that the soils are of post-Saalian age, with the lowermost soil representing the Eemian interglacial, not being glacially deformed; the overlying soils represent Weichselian interstadials (Gripp et al., 1965).
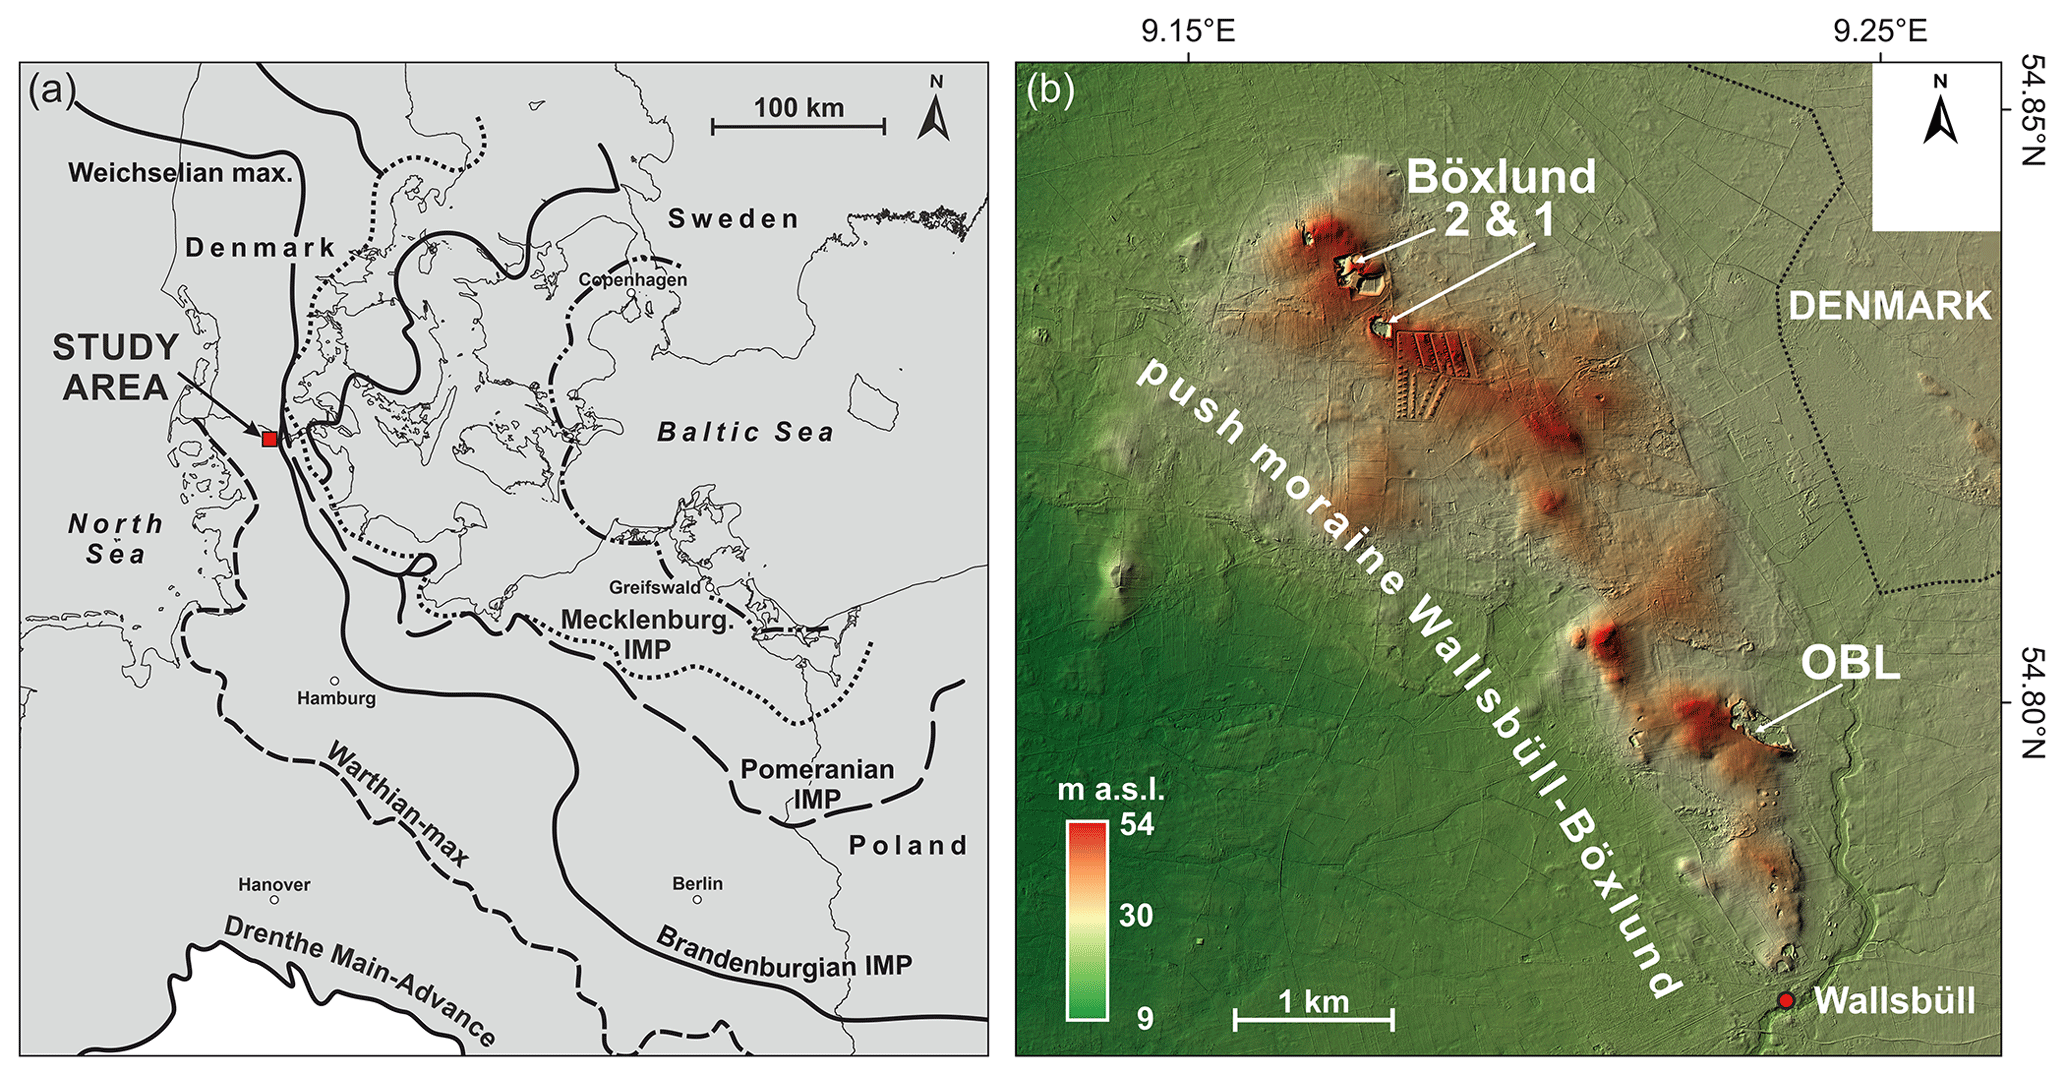
Figure 1Overview of the Baltic region in which the study area is located, (a) showing the ice marginal positions of the Saalian and Weichselian glaciations and (b) the push moraine complex Wallsbüll-Böxlund; OBL = Osterbylund.
To address the debate on the age of the push moraine ridge and with it on the palaeosol formation, optically stimulated luminescence (OSL) dating is the method of choice, as it can be applied to the clastic sediments underlying and covering the soils. In luminescence dating, the time elapsed since the last exposure to daylight is determined; this is in general referred to as the burial age. From that it is evident that not the soil formation itself is being dated, but that age constraints can be provided.
In our study we present detailed sedimentological investigations of the sediment succession in the push moraine complex near Osterbylund, Schleswig-Holstein, Germany, together with OSL ages from the sediment over- and underlying the palaeosols. In addition, pollen analyses from a peat underlying the clastic sediments are presented together with an attempt to date the peat using dating. The combination of the data is then used to correlate the investigated strata and the palaeosols to MISs, with the aim to add another jigsaw piece to the glacial and intraglacial development in the western Baltic region.
For decades, several sand–gravel pits have been opened in a 9 km long, SE–NW stretching push moraine ridge between Wallsbüll and Böxlund, northern Schleswig-Holstein, close to the Danish border (Fig. 1). Two of them (Böxlund 1 and 2; Fig. 1b) have been intensely investigated over decades due to the occurrence of palaeosols (e.g. Stremme and Weinhold, 1980). Because of the presence of several organic-rich horizons, the sand–gravel pit in Osterbylund became of special interest. It is situated on the same ridge (Fig. 1) a few kilometres SW of the Danish border. The push moraine is surrounded by Weichselian sandur plains originating from meltwater streams of the Weichselian end moraines draining westwards into the North Sea. The surfaces of these plains have an elevation no higher than +25 m above present sea level (a.s.l.). The Saalian push moraine complex is 20 to 30 m higher than these plains (topographical map of Germany 1:25 000; sheets Medelby, 1121, and Wallsbüll, 1221), with the highest point, called Lundtop, reaching +53.8 m a.s.l.
The continuous exploitation of the pit revealed not only the complexity of the sand succession and the intercalated soils and organic-rich horizons but also various peat layers. Further, two folded palaeosols in superposition were found (see Stephan, 1988). Based on detailed sedimentary and structural studies, Stephan (1988) showed that the deformation had developed by a periglacial sheet sliding downslope with thrust folding, probably initiated by an undercut of the moraine slope by Weichselian meltwater streams.
In Fig. 2, a generalised view of the sediments, structure, and deformation is given. The lower and median parts are mainly meltwater sands, in most cases strongly deformed by glacial pressure (folded and cut by thrust faults). Blocks of till and folded till beds are incorporated in the sands mostly getting smaller upwards, rarely reaching the surface. The northeastern part of the deformed sequence is covered by a thick undulating till sheet overlain by periglacial sands, which are several metres thick, not deformed, and concordantly filling push synclines, upwards with slightly undulating or increasingly even stratification. Several palaeosols (named OBL 1–4) have been observed within these sandy deposits; the lower two soils show distinct humus-rich Ah horizons (according to AG Boden, 2005). Towards the centres of the synclines the lowermost humus layer is often graded into a peat.
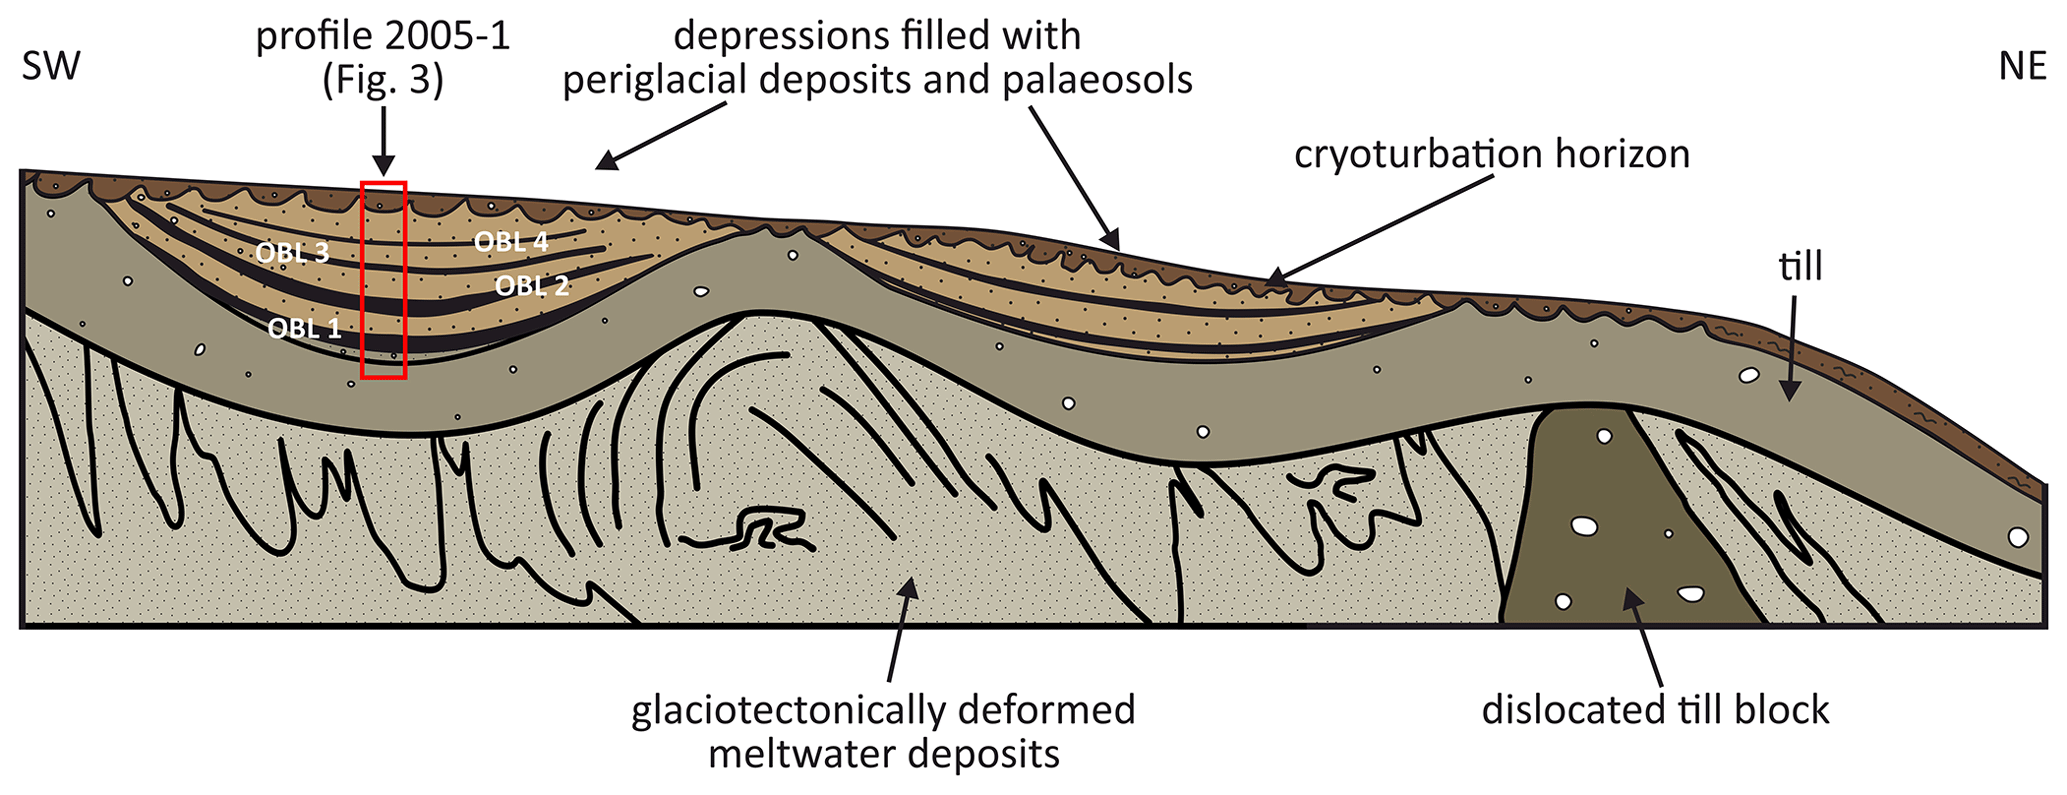
Figure 2Generalised sketch of the push moraine in Osterbylund. In the depression, the four palaeosols OBL 1 to OBL 4 are exposed (see Figs. 3 and 4).
Different outcrop walls have been investigated over the last 2 decades, showing various sedimentological features which can be used to obtain an integrated picture. Detailed investigations and sampling for dating and pollen analyses were carried out in 2003, 2004, and 2005. The field studies in 2012 (see Stephan et al., 2017) and 2016 focussed on the sedimentological description to obtain a better understanding of the geological and geomorphological processes at the site.
3.1 Exposure and sampling in 2003
A standardised profile of the investigated exposures (54.798216∘ N, 9.232047∘ E) is given in Fig. 3 (composite profile 2003).
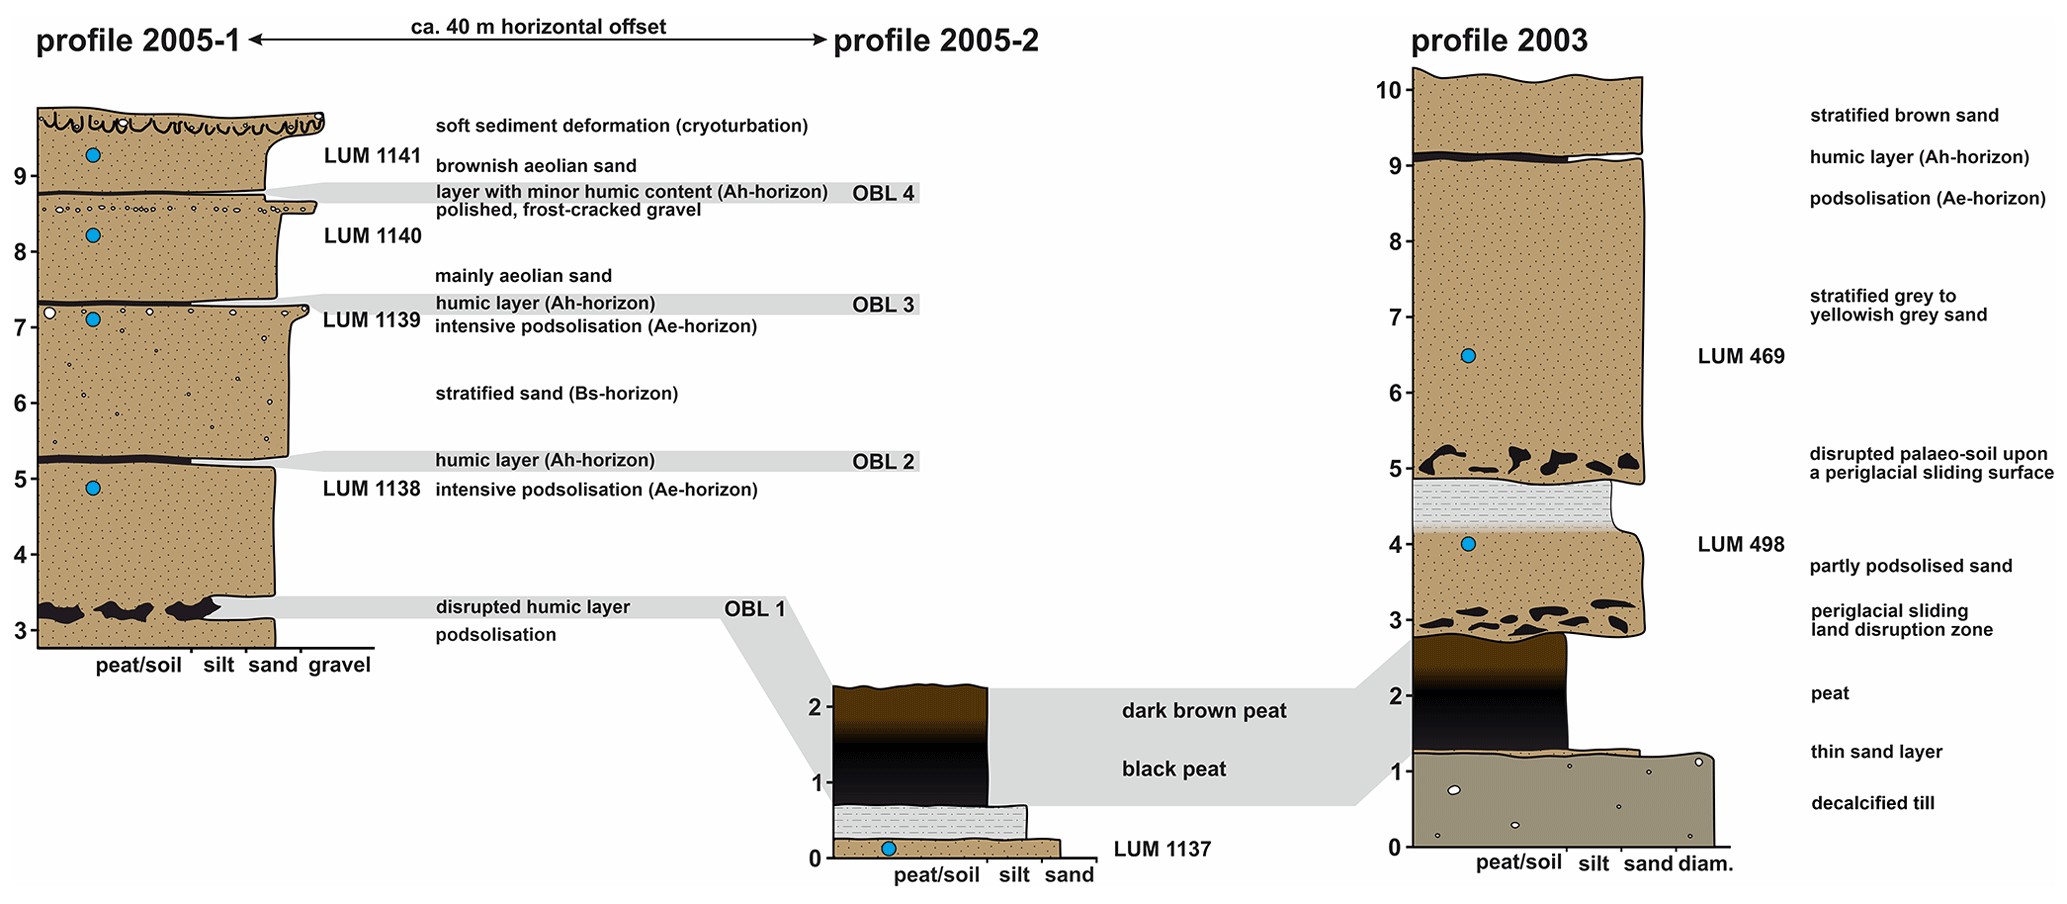
Figure 3Profiles investigated in the years 2003 to 2005, indicating the locations where samples for luminescence dating (LUM) were taken. Sample LUM 470 originates from an isolated block, which hampers the correlation. Therefore, the sample is not marked in the profile.
At the bottom, a greyish-brown till is exposed, overlain by grey sand, only 1 cm thick, upwards followed by a 1.8 m thick peat, which can be parted into a lower black and an upper blackish-brown peat (Fig. 3). The black peat is compact and has a platy structure, while the overlying peat shows an only slightly platy structure but many well-preserved fragments of plants and wood. Both peat layers were sampled for dating (TIMS no. < 700, Table S1 in the Supplement) and pollen analyses.
The peat is discordantly overlain by mainly fine- to medium-grained sand; the transition between peat and sand exhibits dislocated peat fragments. The sand appears partly weakly podsolised, and its lamination is altered by mass movements. About 1 m above the peat an OSL sample (LUM 498) was taken (Figs. 3, S1). The sand graded upwards into greyish silt, overlain by a strongly disturbed mud, which is up to 15 cm thick and interbedded with relics of an Ae horizon (Fig. 3). Above the mud, there is grey to yellowish-grey laminated sand of about 4 m in thickness. This sand was sampled some metres above the mud (LUM 469). At its top, a thin and slightly humic Ah horizon is present and overlain by a brownish sand (see composite profile 2003 in Fig. 3). One OSL sample (LUM 470) was taken from an isolated block about 60 m to the northeast below a brown clay. The sedimentary conditions at this site are slightly unclear; the material may belong to a gravity flow.
3.2 Exposure and sampling in 2004 and 2005
The generalised profile of an exposure north of the site investigated in 2003 is presented in Fig. 3 (profiles 2005-1 and 2005-2). The same peat bed as found in 2003 was exposed in a small incision originating from water run-off (54.798351∘ N, 9.232048∘ E; profile 2005-2); the palaeosols were present at 54.798218∘ N, 9.231425∘ E (profile 2005-1). All four palaeosols (OBL 1–4) were present at this exposure (Fig. 4).
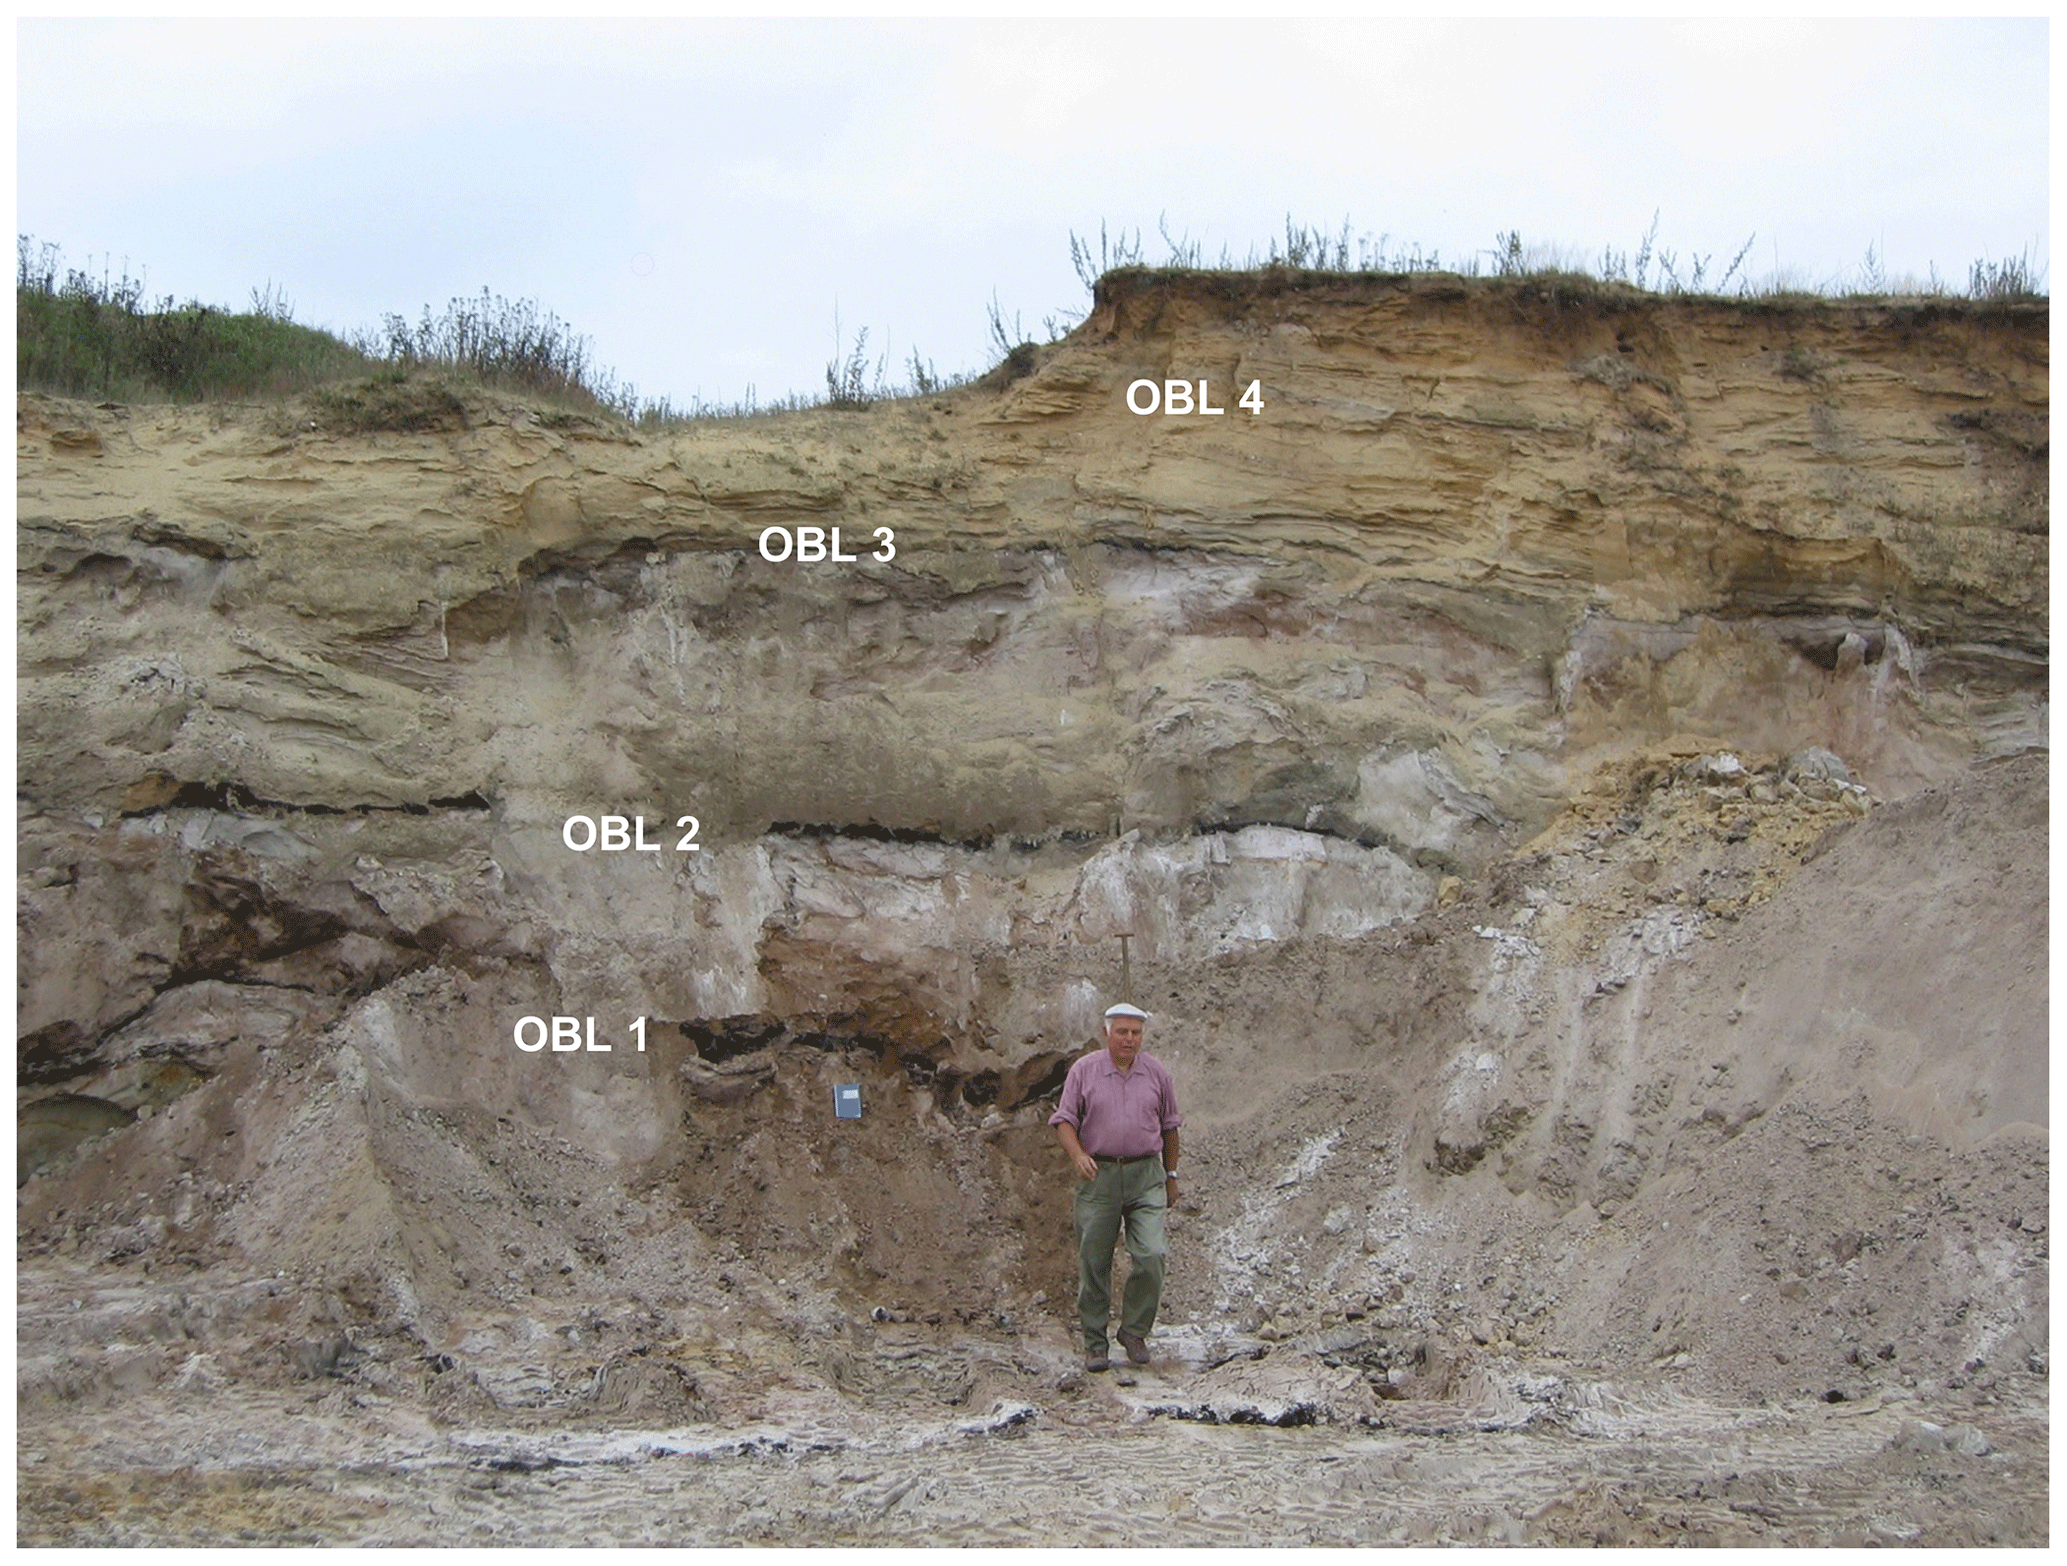
Figure 4Photograph of the NW-facing outcrop investigated in 2005 showing OBL 1–OBL 4. This photograph corresponds to profile 2005-1 in Fig. 3.
The bottom part (profile 2005-2) is composed of a ca. 0.2 m thick very fine-grained sand, covered by silt ca. 0.4 m in thickness. One sample for OSL dating (LUM 1137) was taken from the sand. The silt is overlain by 1.5 m thick peat; there, a series of samples for dating was taken (TIMS no. >700; Table S1). Above the peat, most parts of the overlying succession are dug off, with the peat forming the sole of an excavation plane (terrace). About 40 m further to the west (profile 2005-1) the peat graded into a thick humus layer with an underlying podsol (OBL 1 in profile 2005-1, Fig. 3), both periglacially disturbed and partly displaced. Above the humus layer, a 1.8 m thick mainly fine- to medium-grained, laminated sand followed, overlain by an Ah horizon (OBL 2) with intense podsolisation (distinct leached horizon and a thick yellow to rusty brown Bsh horizon). Just below OBL 2, a sample for luminescence dating was taken (LUM 1138). On top of the weak soil, there are about 2 m thick stratified sands with few gravels; these sands are distinctly podsolised and overlain by a thin humus layer (OBL 3). One sample for OSL dating (LUM 1139) was taken from the leached sand (Fig. 3; profile 2005-1, Fig. S2).
The podsol is covered by fine- to medium-grained laminated brownish sands, which are most likely of aeolian origin. One sample for OSL dating (LUM 1140) was taken 0.75 m above the podsol from the sand. This sequence was overprinted close to the top by a thin and weak podsol with a very thin Ah layer (OBL 4); ca. 0.2 m below this Ah layer there is an intercalation with gravel. The gravels are polished and frequently split by frost. Above the Ah layer laminated brownish sands, ca. 1 m in thickness, are found. These sands are cryoturbated at the top. The cryoturbated zone has an admixture of some gravels and few stones, evidencing transport of coarse material from outcropping till further up the slope. The uppermost sample for OSL dating (LUM 1141) was taken 0.5 m above the Ah layer of OBL 4.
3.3 Exposure in 2016
The exposure investigated in 2016 (54.798162∘ N, 9.230141∘ E; Fig. 5) is located 100 m to the west of profile 2005-2.

Figure 5Photograph and sketches of the profiles investigated in 2016. A detailed lithological description is given in Fig. 6 and in the main text.
Based on its sedimentological and pedological characteristics, profile 2016-2 has been subdivided into five lithological units (Unit I to V; Fig. 6):
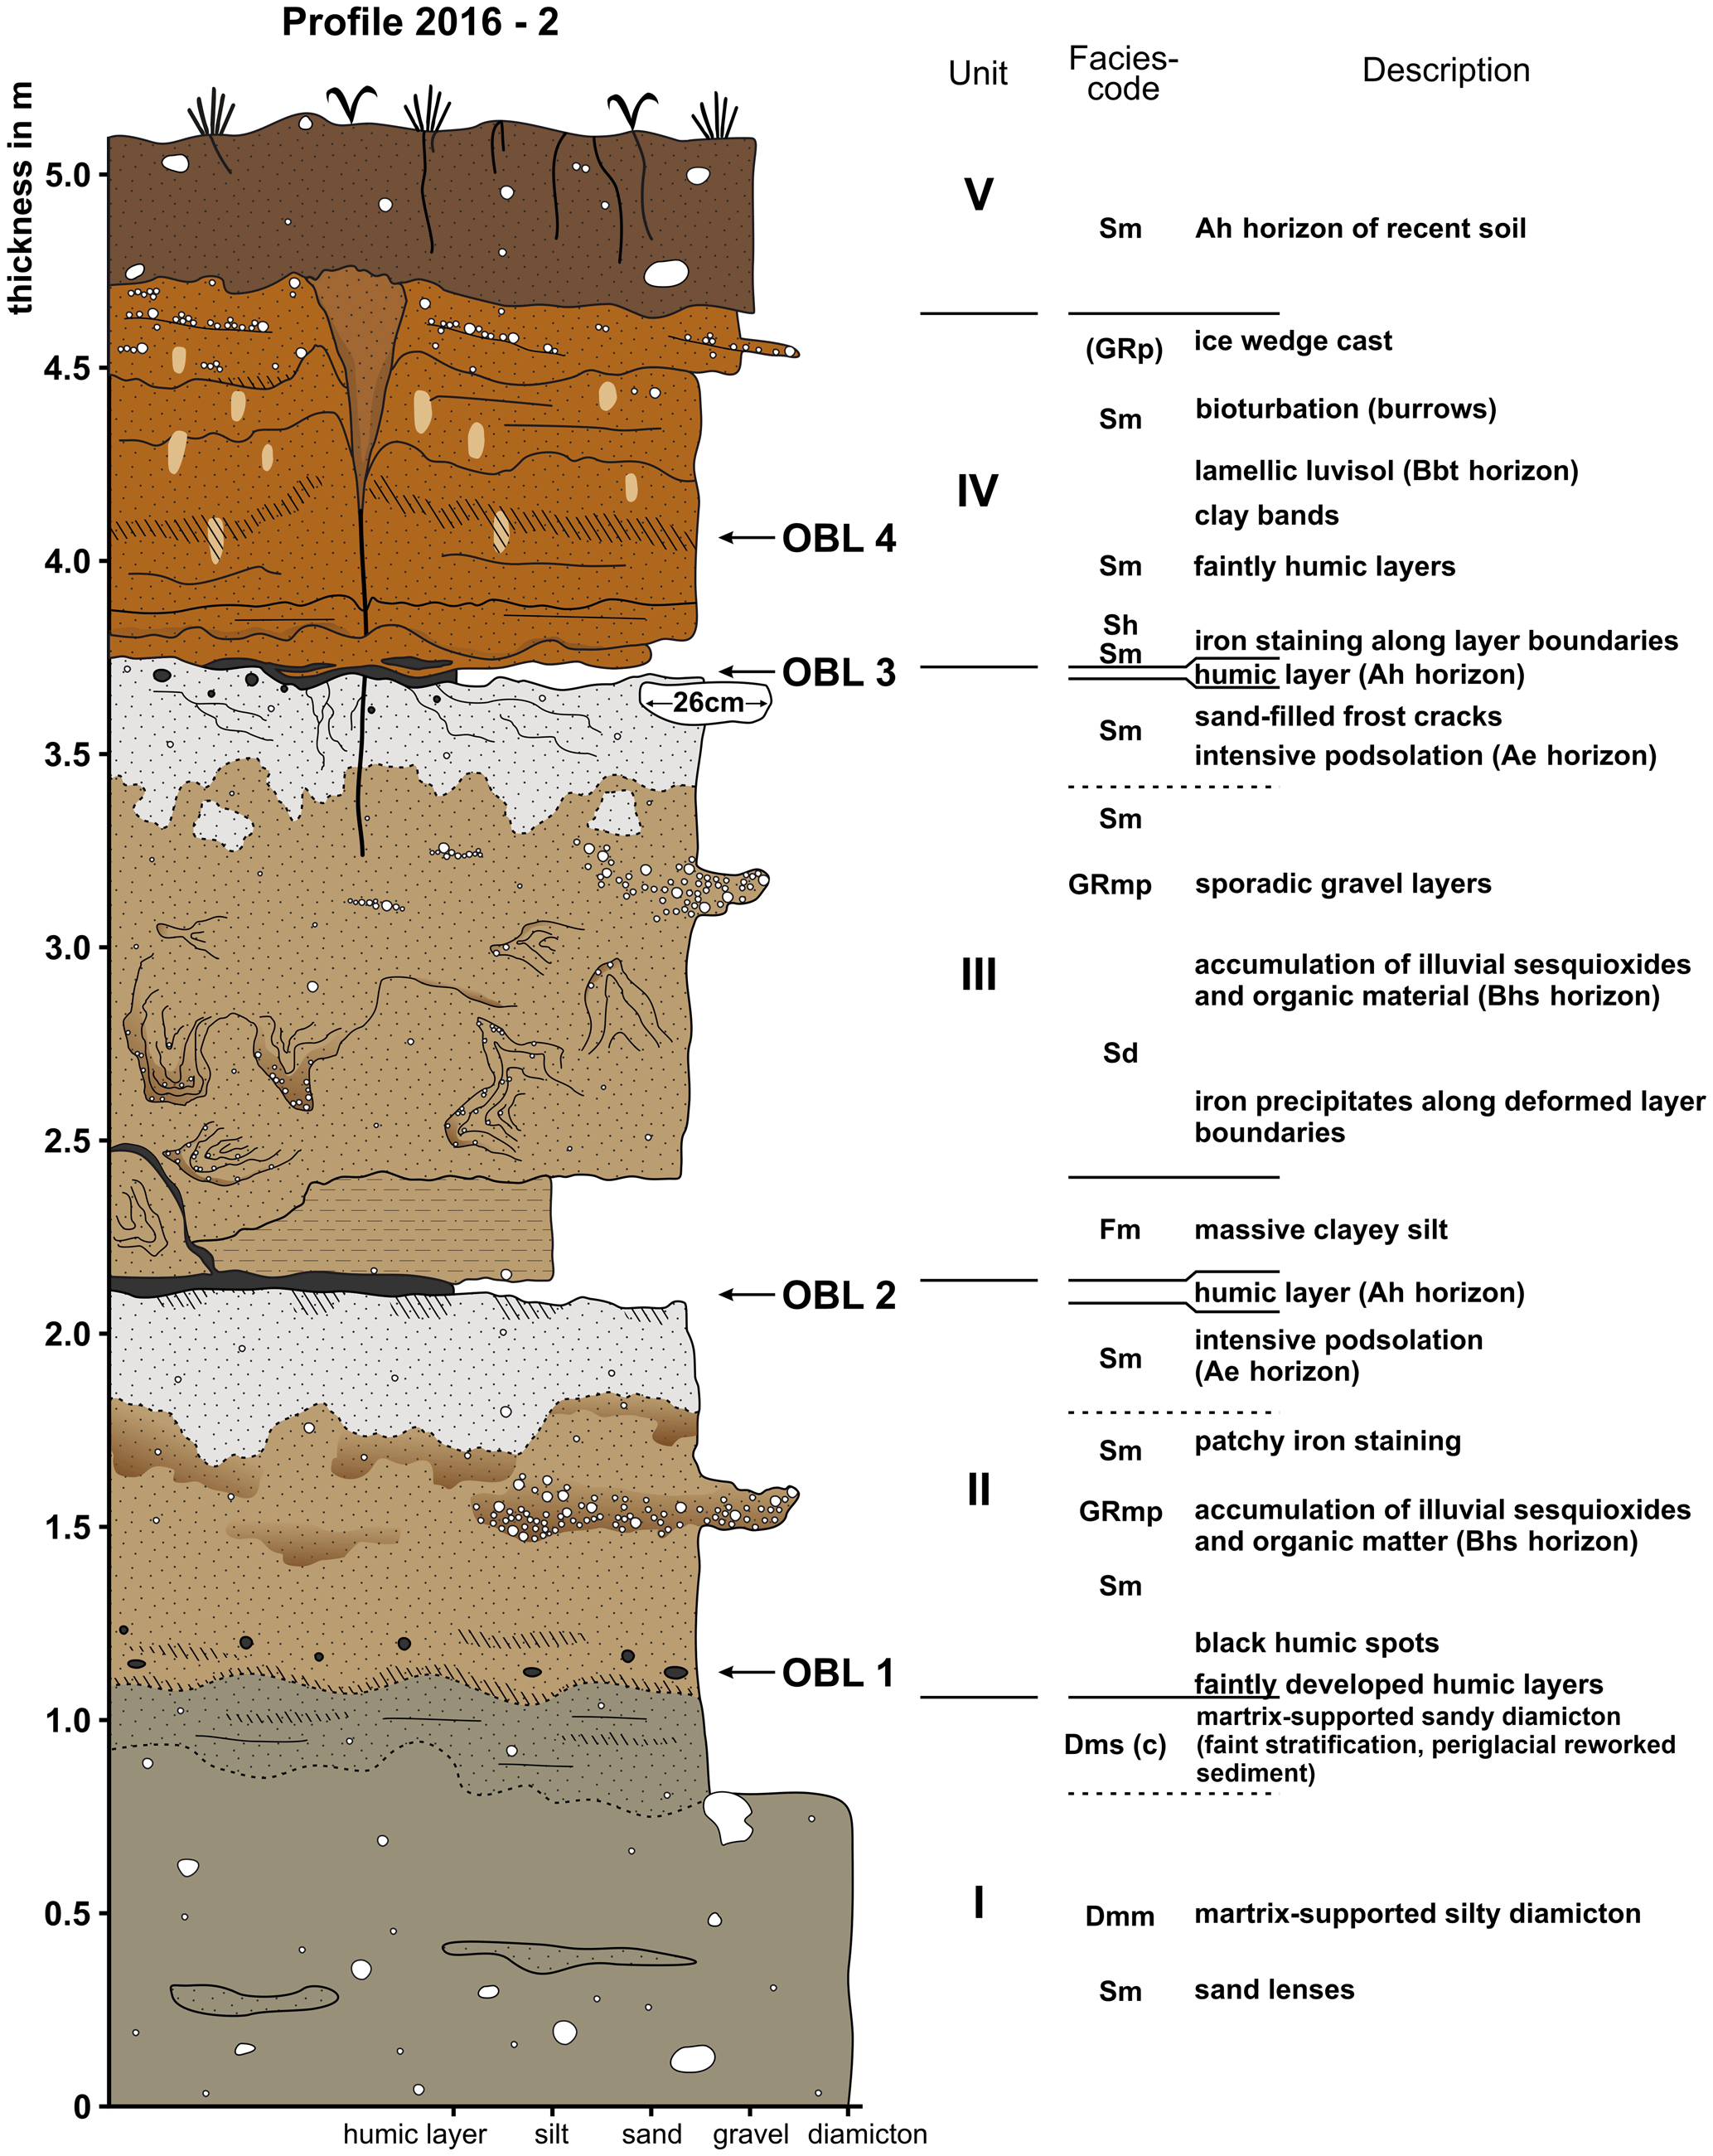
Figure 6Detailed lithological log of profile 2016-2. The profile is subdivided into five lithological units I to V, for which a detailed description is given in the main text.
Unit I comprises two superimposed diamict layers, with a total thickness of at least 1 m. The lower boundary was not visible due to slope debris. The basal part of the outcropping strata consists of a stiff, matrix-supported silty, greenish-grey diamicton with sporadic medium- to coarse-grained sand lenses. The transition to the 20–30 cm thick overlying matrix-supported sandy diamicton is gradual. Faint subhorizontally stratified domains are visible in this uppermost greenish-grey part of unit I (Fig. 6).
The 1.3 m thick unit II is composed of massive medium-grained sand intercalated with granule lenses and pebble stingers in the middle part (Figs. 6 and 7a–c). At the undulating base, a centimetre-thick faintly developed humic layer is present, which marked the transition from unit I to unit II. Isolated black humic spots at the centimetre scale are scattered across the basal 20 cm of unit II (OBL 1). The middle part shows rusty oxidation domains and patchy iron staining at the decimetre scale due to accumulation of illuvial sesquioxides and organic matter. The uppermost 20–30 cm sandy parts are better sorted with very sporadic fine-grained gravel clasts. The sands are leached due to intensive podsolisation. The uppermost 5–10 cm of unit II is formed by a humic layer (OBL 2).
The overlying 1.7 m thick unit III is characterised by medium-grained partly deformed sand layers and a basal clayey silt lens at the decimetre scale (Fig. 7a). The lower sandy part is dominated by soft sediment deformation structures recognisable by iron precipitates along lithological boundaries. Sporadic discontinuous gravel layers occur in the middle part of the unit. The upper part displays as intensive podsolisation marked by leached sand. Several outsized clasts occur in the uppermost part of this unit, some of which are broken. The top of unit III is made of a discontinuous humic layer at the millimetre to centimetre scale (OBL 3). From the base of this humic layer subvertical sand-filled cracks and fissures penetrate the underlying leached sand (Fig. 7c). From a pedological point of view, unit III can be subdivided into the following three soil horizons (Fig. 6): an up to 1.3 m thick Bsh horizon with accumulated illuvial sesquioxides and organic material, an up to 0.4 m thick intensively podsolised Ae horizon (leached sand), and an uppermost discontinuous humic Ah horizon. A hiatus represents the boundary to the overlying unit IV, which is up to 1.6 m thick and consists of massive to faintly (sub-)horizontal stratified medium-grained sand. Iron staining is present in the lower part along lithological boundaries. Several burrow-like structures identifiable by colour changes are visible in the middle part (Fig. 7b). Further features are clay bands at the millimetre scale, a faintly visible 5–10 cm thick humic layer in the lower middle part (OBL 4), and a sporadic fine-grained gravel stringer in the upper part (Figs. 5, 6, and 7b). From the top of this unit a wedge-shaped structure vertically penetrates the underlying deposits up to unit III (Figs. 6 and 7a).
The uppermost 30 cm thick unit V is dominated by non-stratified medium-grained sand and isolated fine- to medium-grained gravel clasts. A significant root penetration characterises this brownish unit, which represents the Holocene soil.
The chronological approach is threefold: next to absolute dating of the clastic sediments using OSL, it was attempted to date the peat using . Additionally, pollen analyses were conducted for a qualitative allocation of the peat to possible warm phases.
4.1 Optically stimulated luminescence dating
In total, eight samples were taken for OSL dating from three different profiles (see Table 1, Fig. 3) by hammering tubes into freshly cleaned sediment walls. After sampling, the tubes were sealed to avoid light exposure, and the material from immediately around the tubes was sampled for dose rate determination.
Table 1Summary of radionuclide concentrations, total dose rates (DR), and optically stimulated luminescence information. De= equivalent dose, n = number of aliquots, SE = standard error, and σOD= overdispersion. The water contents used for dose rate calculation are given in the text.
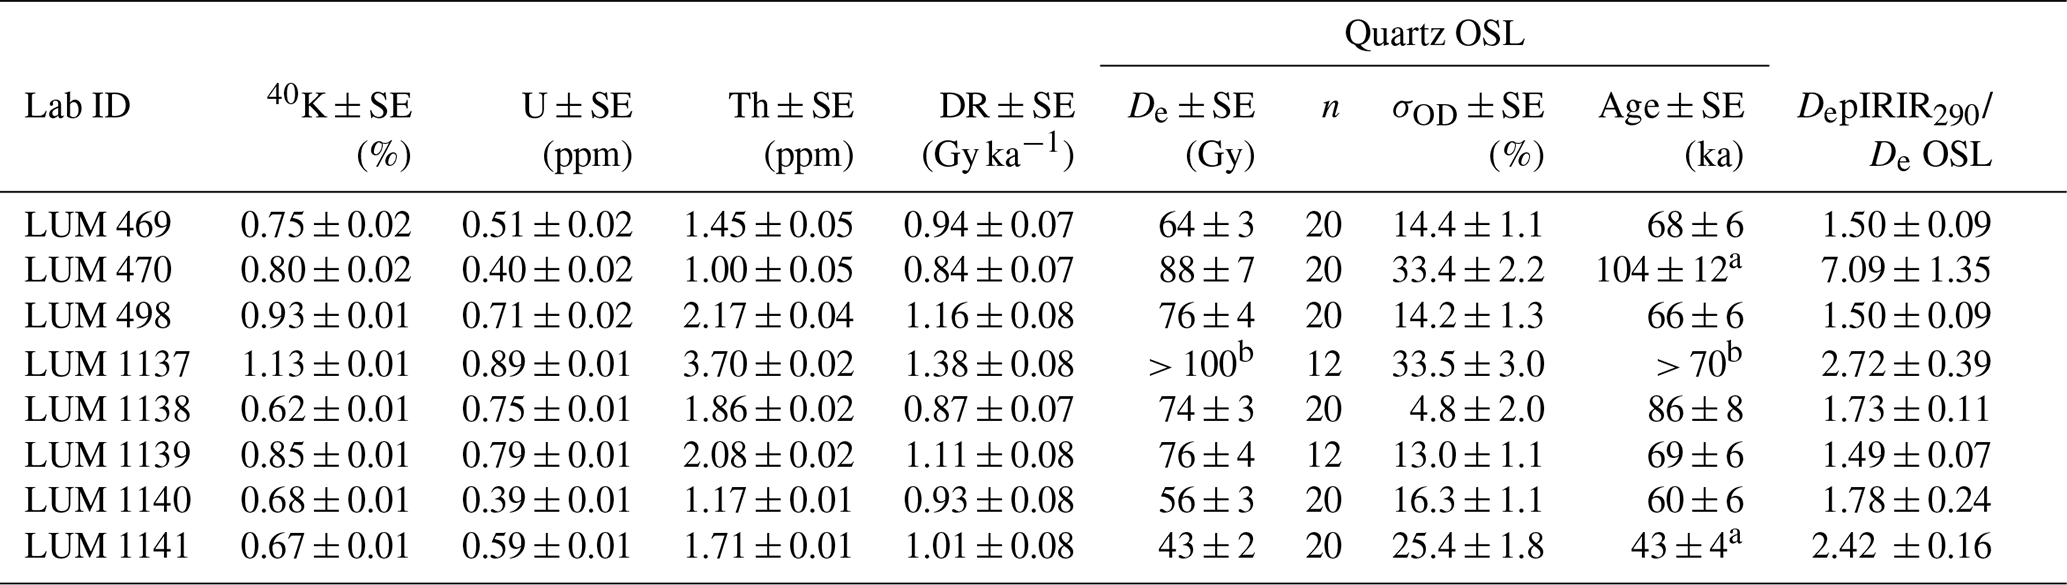
a = poorly bleached, b = saturated and poorly bleached.
4.1.1 Dose rate determination
The sub-samples for dose rate determination were dried at 120 ∘C and then manually homogenised prior to packing in Marinelli beakers (∼700 g); these were tightly wrapped and stored for at least 1 month prior to counting with a high-resolution gamma spectrometer to ensure equilibrium between radon and its daughter nuclides.
The concentrations of uranium, thorium, and potassium as given in Table 1 were converted into sediment dose rates using the conversion factors given in Guérin et al. (2011) and were modified by the life-time burial water content using the expressions given in Aitken (1985). For the aeolian sands (LUM 1140 and LUM 1141) a water content of 10±5 % was used. LUM 1137 originates from the sand in the depression just above the till. The sand was water-logged most of its burial time; this made us use a water content of 25±5 %. Similar conditions were most likely present in the sands from which sample LUM 470 was taken so that we assumed the same water content for this sample. According to the hydromorphic features observed in the soils and sands, the other samples must have undergone changing conditions from wet to dry, with the wet phases dominating. Therefore, we assumed a water content of 17.5±5 % for the remaining samples. The cosmic part of the dose rates was determined following Prescott and Hutton (1994) and added to the sediment dose rate, resulting in the total dose rates summarised in Table 1.
4.1.2 Equivalent dose measurements
The light-proof tubes containing the sub-sample for equivalent dose determination were opened in red light in the luminescence dating laboratory at the Leibniz Institute for Applied Geophysics, Hanover. The outer ends of each sample were discarded to ensure that any sediment exposed to light is not used.
After dry sieving, the dominating grain size fraction was chemically treated with hydrochloric acid (HCl), sodium oxalate, and hydrogen peroxide in order to remove carbonates, clay remnants, and organic matter, respectively. The samples were thoroughly washed with distilled water between each treatment step. After drying the samples at 50 ∘C, the quartz-rich fraction was separated from the potassium-rich feldspar (in the following called K-feldspar) fraction by heavy liquid separation using sodium polytungstate (quartz: ρ≥2.62 g cm−3; K-feldspar: ρ≤2.58 g cm−3). The dried quartz extracts were then purified using 40 % hydrofluoric acid for 1 h, followed by an HCl (30 %) treatment and washing with distilled water. The etched fractions were sieved again in order to avoid contamination with small particles.
The coarse-grained quartz extracts were mounted in a single layer on stainless steel discs as medium-sized (6 mm) aliquots using silicon oil as adhesive. Preference would have been given to smaller aliquots (e.g. Duller, 2008); however, the samples were not very sensitive, and we chose to increase the aliquot size for better analytical data. The luminescence measurements were made with automated Risø TL/OSL-DA-20 readers (Thomsen et al., 2006), equipped with calibrated beta sources allowing for in situ beta irradiation. The quartz fractions were stimulated with an array of blue light-emitting diodes (LEDs), and the luminescence was detected through a 7.5 mm Hoya U-340 filter in the ultraviolet region.
The purity of the quartz extracts was checked by means of the IR/OSL depletion ratio (Duller, 2003); there was no significant IRSL signal present, indicated by an IR depletion ratio within 5 % of unity. These initial measurements also indicated fast decay of the quartz luminescence signal; this is supported by a comparison with calibration quartz (Fig. 8a).
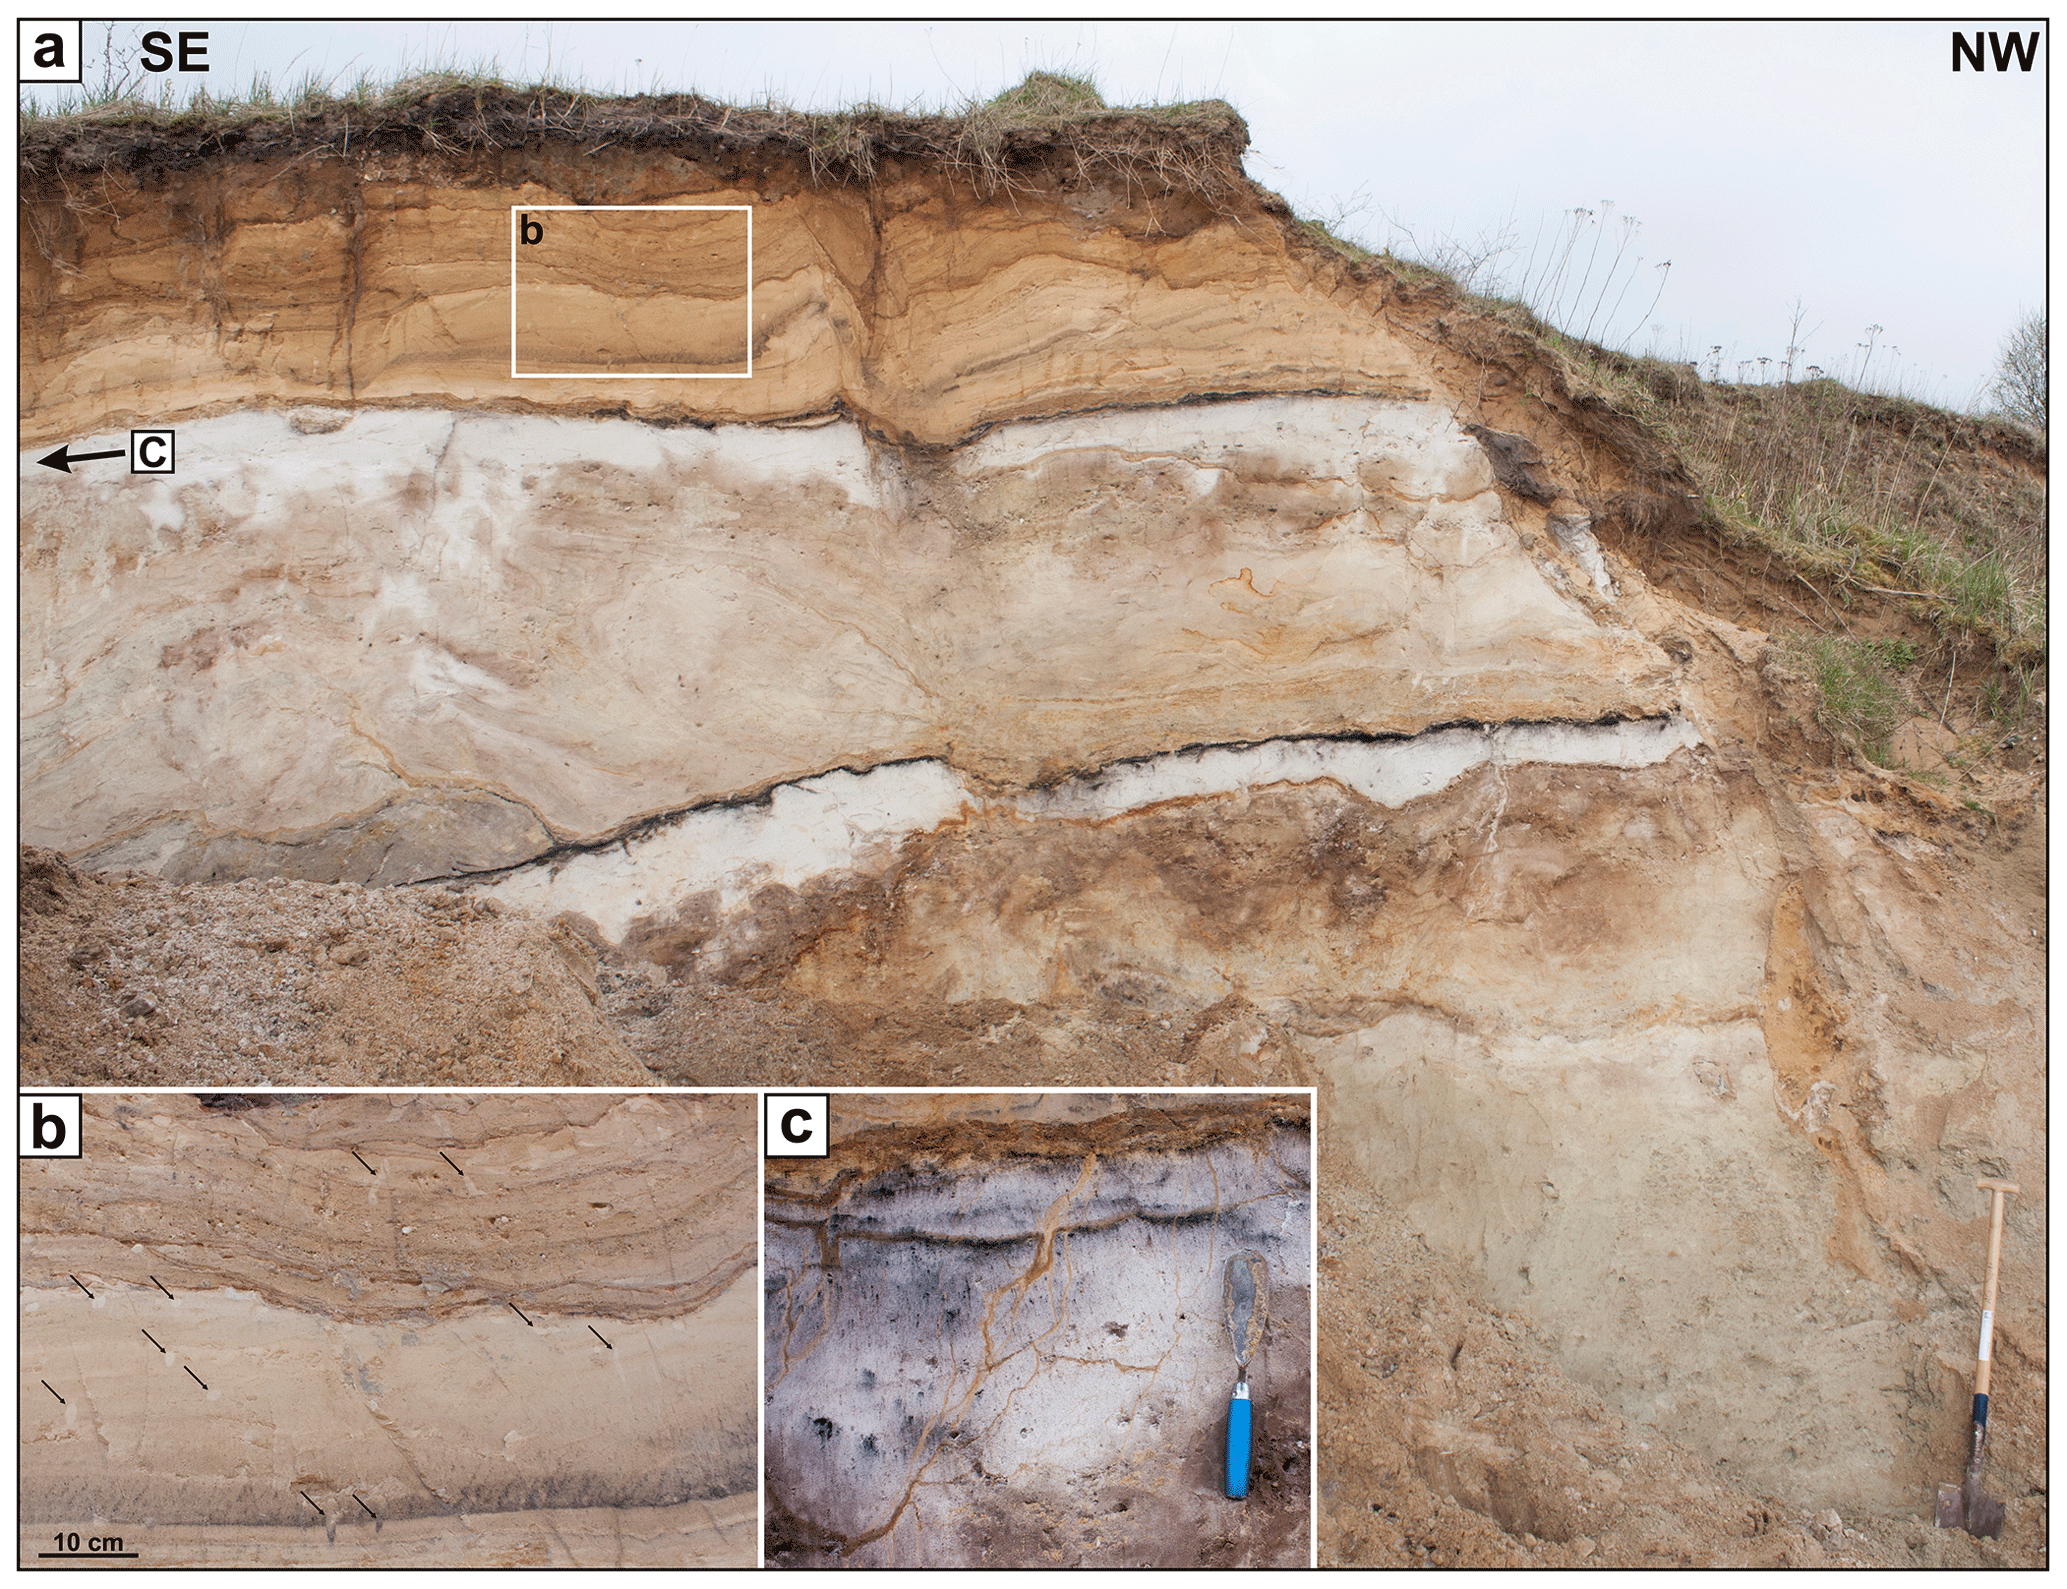
Figure 7Detailed photographs of profile 2016-2. (a) Features of lithological units II and III. (b) Burrow-like structures identifiable by colour changes. (c) Base of OBL 3 with subvertical sand-filled cracks and fissures penetrating the underlying leached sands.

Figure 8(a) Natural decay curve of one representative aliquot (sample LUM 1140) in comparison to calibration quartz (batch 30) showing that the quartz OSL signal from the Osterbylund samples is dominated by the fast component. Preheat plateaus for samples (a) LUM 498 and (b) LUM 1141. The temperatures shown in red circles are the preheat temperatures used in the De measurements and dose recovery experiments.
Preheat plateau measurements were conducted on two samples (LUM 498 and LUM 1141) to find the most appropriate temperature settings for the single-aliquot regenerative dose (SAR) procedure (Murray and Wintle, 2000). The preheat temperatures varied from 160 to 300 ∘C (three aliquots per sample), with the cut-heat temperature set 40 ∘C lower. The results of the tests are shown in Fig. 8. There is no clear plateau for either of the samples; between 240 and 260 ∘C there is not much variation, and the errors are small. It was chosen to set the preheat to 260 ∘C (10 s), and the OSL read-out was conducted at 125 ∘C for 40 s (Lx). After administering a fixed test dose of about 7 Gy to correct for potential sensitivity changes, the sample was heated to 220 ∘C, followed by another OSL read-out at 125 ∘C for 40 s (Tx). Each SAR cycle ended with a blue OSL clean-out at 280 ∘C (40 s) to minimise recuperation (Murray and Wintle, 2003). The initial 0.4 s minus a background of the subsequent 1.2 s was used to build the dose response curves, which were then fitted with a single exponential function.
Dose recovery tests were conducted on each sample. Three aliquots per quartz sample were bleached for 400 s with blue light, followed by a pause of 10 000 s and subsequently another 400 s illumination with blue light (inside the Risø TL/OSL DA-20 reader). The aliquots were then given a beta dose close to their natural dose and measured using the protocol described above.
4.1.3 Testing for incomplete OSL signal resetting
In sedimentary settings in which transport and deposition are very rapid, the mineral grains might not have received sufficient daylight exposure prior to deposition. Thus, there may be a residual signal adding to the burial dose, which would result in age overestimation. While in aeolian sediments poor signal resetting is very unlikely (e.g. Roberts, 2008), there may be significant residual signals in glacial and glaciofluvial sediments (e.g. King et al., 2014).
Incomplete signal resetting can, for example, be investigated by (i) using a comparison of blue light OSL and infrared stimulated luminescence (IRSL) signals (e.g. Murray et al., 2012) as these two dosimeters show different bleaching behaviour and (ii) statistical parameters such as overdispersion (OD) (Galbraith et al., 1999).
To compare the quartz OSL results with IRSL of feldspar, the post-IR IRSL signal (Buylaert et al., 2012) on coarse-grained K-feldspar was measured on at least three aliquots per sample, prepared with a diameter of 2 mm on stainless steel discs. The aliquots were stimulated with IR LEDs, and the IRSL signals were collected through a blue filter combination (Corning 7-59 and Schott BG-39) in the blue-violet region of the light spectrum. The K-feldspar extracts were preheated at 320 ∘C (60 s) prior to IR (50 ∘C, 200 s) and post-IR IR stimulation (290 ∘C, 200 s). The test dose was set to about 50 % of the expected De (calculated from quartz De, taking into account the larger dose rate to feldspar). Dose response curves were fitted with a single exponential function, using the initial 2 s minus a background of the last 20 s of the decay curves. The ratios are listed in Table 1.
The overdispersion, which expresses the amount of scatter in De distribution on top of the known uncertainties in measurements and analysis, was calculated for each quartz sample using Analyst version 4.57. The values are given as σOD in % and are summarised in Table 1.
4.2 230Th U dating
For dating all samples were prepared at the Leibniz Institute for Applied Geophysics, Hanover, for isotopic measurements following the leachate/leachate protocol of Schwarcz and Latham (1989) adopted to peat dissolution requirements (Sierralta et al., 2012; Waas et al., 2011). A double spike and a 229Th spike were used for the quantification of uranium and thorium contents, respectively.
To construct the isochrons at least three sub-samples were prepared from the horizons of interest. Measurements were performed with a thermal ionisation mass spectrometer (Finnigan MAT 262 RPQ) applying the double filament technique with a peak jump routine. Mass fractionation was controlled during measurement by the double-spike ratio . All isotopic results are given in Table S1. Activities of the isotopes were calculated from the measured atomic ratios after normalisation to the double-spike ratio to correct for the thermal fractionation. The external reproducibility is 0.3 % (2σ) as determined by the measurements of the standard solution NBL U112A.
4.3 Pollen analysis
The material taken from the peat (profile 2005-2, Fig. 3) was prepared for palynological analysis in the laboratories of the Institute of Ecology of Leuphana University Lüneburg. About 1–3 g per sample was treated by standard palynological methods, which included dispersion with 10 % NaOH, carbonate removal by 10 % HCl, flotation to separate organics from the inorganic matrix using sodium metatungstate (3Na2 ⋅ WO4 ⋅ 5WO2 ⋅ H2O), and acetolysis (Faegri and Iversen, 1989; Moore et al., 1991). One slide of 24×32 mm per sample was analysed under a transmitted-light microscope for pollen, non-pollen palynomorphs, and micro-charcoal particles at 40× magnification. Pollen and spores were identified using a reference collection of the Laboratory of the Institute of Ecology, Leuphana University Lüneburg, and the atlases of Moore et al. (1991) and Beug (2004). Percentages of all recorded taxa are based on a pollen sum composed of terrestrial taxa; pollen and spores deriving from cryptogams, aquatic plants, Ericaceae, and Cyperaceae were excluded. Due to bad pollen preservation the sum of 300 tree pollen per sample could not always be achieved; only 13 samples contained a statistically solid amount of pollen and spores. Pollen calculations for diagram construction were performed with the software packages Tilia, Tilia Graph, and Tilia View (Grimm, 1990).
5.1 Dose rates and luminescence data
The total dose rates (Table 1) for the sands range from 0.87 ± 0.07 Gy ka−1 (LUM 1138) to 1.38 ± 0.08 Gy ka−1 (LUM 1137; Table 1) and are thus rather low. The low radioactivity in the sediment results in large sensitivity to water content assumptions. We did not undertake any field or laboratory water content measurements on our samples but put our observations in the field in perspective to dose rate ranges presented in the literature (Lüthgens et al., 2011; Kenzler et al., 2017; Pisarska-Jamroży et al., 2018) and from recent stationary measurements (tensiometer) from the Schuby station, run by the Landesamt für Landwirtschaft, Umwelt und ländliche Räume (LLUR), Flintbek (data from Marek Filipinski, personal communication, 2021), with absolute errors of ±5 % accounting for changes in water content over time. Nevertheless, the uncertainty of these assumptions on the final age may have an effect one must not lose sight on and may bias the results.
The satisfactory measurement performance of equivalent dose determination is shown by the good dose recovery test results. The mean measured to given doses range from 0.91 ± 0.01 (LUM 1139) to 1.09 ± 0.09 (LUM 470), with an average of 0.99 ± 0.02 (n=8). In addition, recycling ratios are all within 10 % of unity, and recuperation is below 5 % for all aliquots, implying reliable De estimates for samples which are not in saturation (Murray and Wintle, 2003; Wintle and Murray, 2006).
The non-saturated (i.e. < 2 ⋅ D0; characteristic saturation limit; Wintle and Murray, 2006) De's range from 43 ± 2 Gy (LUM 1141) to 88 ± 7 Gy (LUM 470), resulting in ages between 43 ± 4 and 104 ± 12 ka, respectively. For the latter sample both the σOD of 33.4±2.2 % and the ratio of 7.09 ± 1.35 indicate, at first sight, very poor bleaching. In a well-bleached setting, the should be 1.7 or less, taking into account the about 0.7 Gy ka−1 larger total dose rate of feldspar due to the internal contribution of K and Rb and negligible anomalous fading for the pIRIR290 signal (Murray et al., 2012). Where the quartz De approaches saturation, the ratio starts to deviate and gets increasingly larger, because the OSL signal and correspondingly De cannot grow any larger. Therefore, for samples with quartz Des in or close to saturation, no conclusion on the bleaching can be drawn using the ratio. The same holds true for overdispersion. For a well-bleached sample, it is generally assumed that the σOD is less than 20 % (e.g. Jacobs et al., 2008). Even though these assumptions are based on small aliquots and single grain measurements, these values may be used as approximations for medium aliquots. According to this, poor signal resetting may be present in sample LUM 1137, with an σOD of 33.5±3.0 % (Table 1). In addition, the OSL signal is in saturation, resulting in a minimum age of >70 ka. As mentioned above, it is difficult to judge whether the large overdispersion of this sample exclusively originates from poor bleaching. Murray et al. (2002) illustrated that the shape and width of dose distributions change significantly as the dose response curve approaches saturation. This effect may be observed here. The ratio of 2.72 ± 0.39 again implies insufficient signal resetting; however, with the OSL being in saturation the much larger pIRIR290 De reflected in the ratio is not necessarily due to poor resetting but may be the true dose. A conclusion on the effect of poor bleaching cannot be made for this sample. For all other samples, the σOD is well below 30 % (Table 1). The σOD of 25.4±1.8 % from the top sample of profile 2004-1 (LUM 1141) evidences the admixture of older material, as observed in the field. The ratio for this sample is 2.42 ± 0.16 and thus supports the field observations and statistical data. The ratios for the other samples range from 1.49 ± 0.07 (LUM 1139) to 1.78 ± 0.24 (LUM 1140), indicating, together with the σOD values, good signal resetting for all those samples.
5.2 Dating of the peat
The uranium and thorium content range between 0.04–0.24 ppm and 0.12–0.64 ppm, respectively. The highest uranium content is found in the lowermost sample. The concentration of uranium decreases upwards and slightly increases to the top of the sampled horizons. A similar behaviour is observed for the thorium content. The activity ratios of are small (1.05–1.43), thus indicating a high amount of detrital material. Isochron dating is mandatory for such samples. The Rosholt-type I plot showing vs. for both the black and brown peat layers is presented in Fig. S3. The scatter in data is large, and the best-fit line is highly variable. The Rosholt plot therefore provides first evidence for open-system behaviour of the two data sets. To finally check for open-system behaviour Osmond plots were prepared and are presented in Figs. S4 and S5 (Osmond et al., 1970; Osmond and Ivanovich, 1992). The data points scatter much wider than analytical error would suggest, and the data imply open-system behaviour for the whole succession. Therefore, no age calculations can be performed (Geyh, 2008).
5.3 Palynological zonation
The zonation of the pollen diagram follows the pollen zonation of Behre (1962), Müller (1974), and Menke and Tynni (1984) for the Eemian of northern Germany (Fig. 9). For the zone description given here, we refer only to the subdivision of the Eemian of Rederstall (Menke and Tynni, 1984) due to its geographical vicinity to Osterbylund. The depths given with the zones are the sampling depths in the peat from profile 2005-2 (Fig. 3).
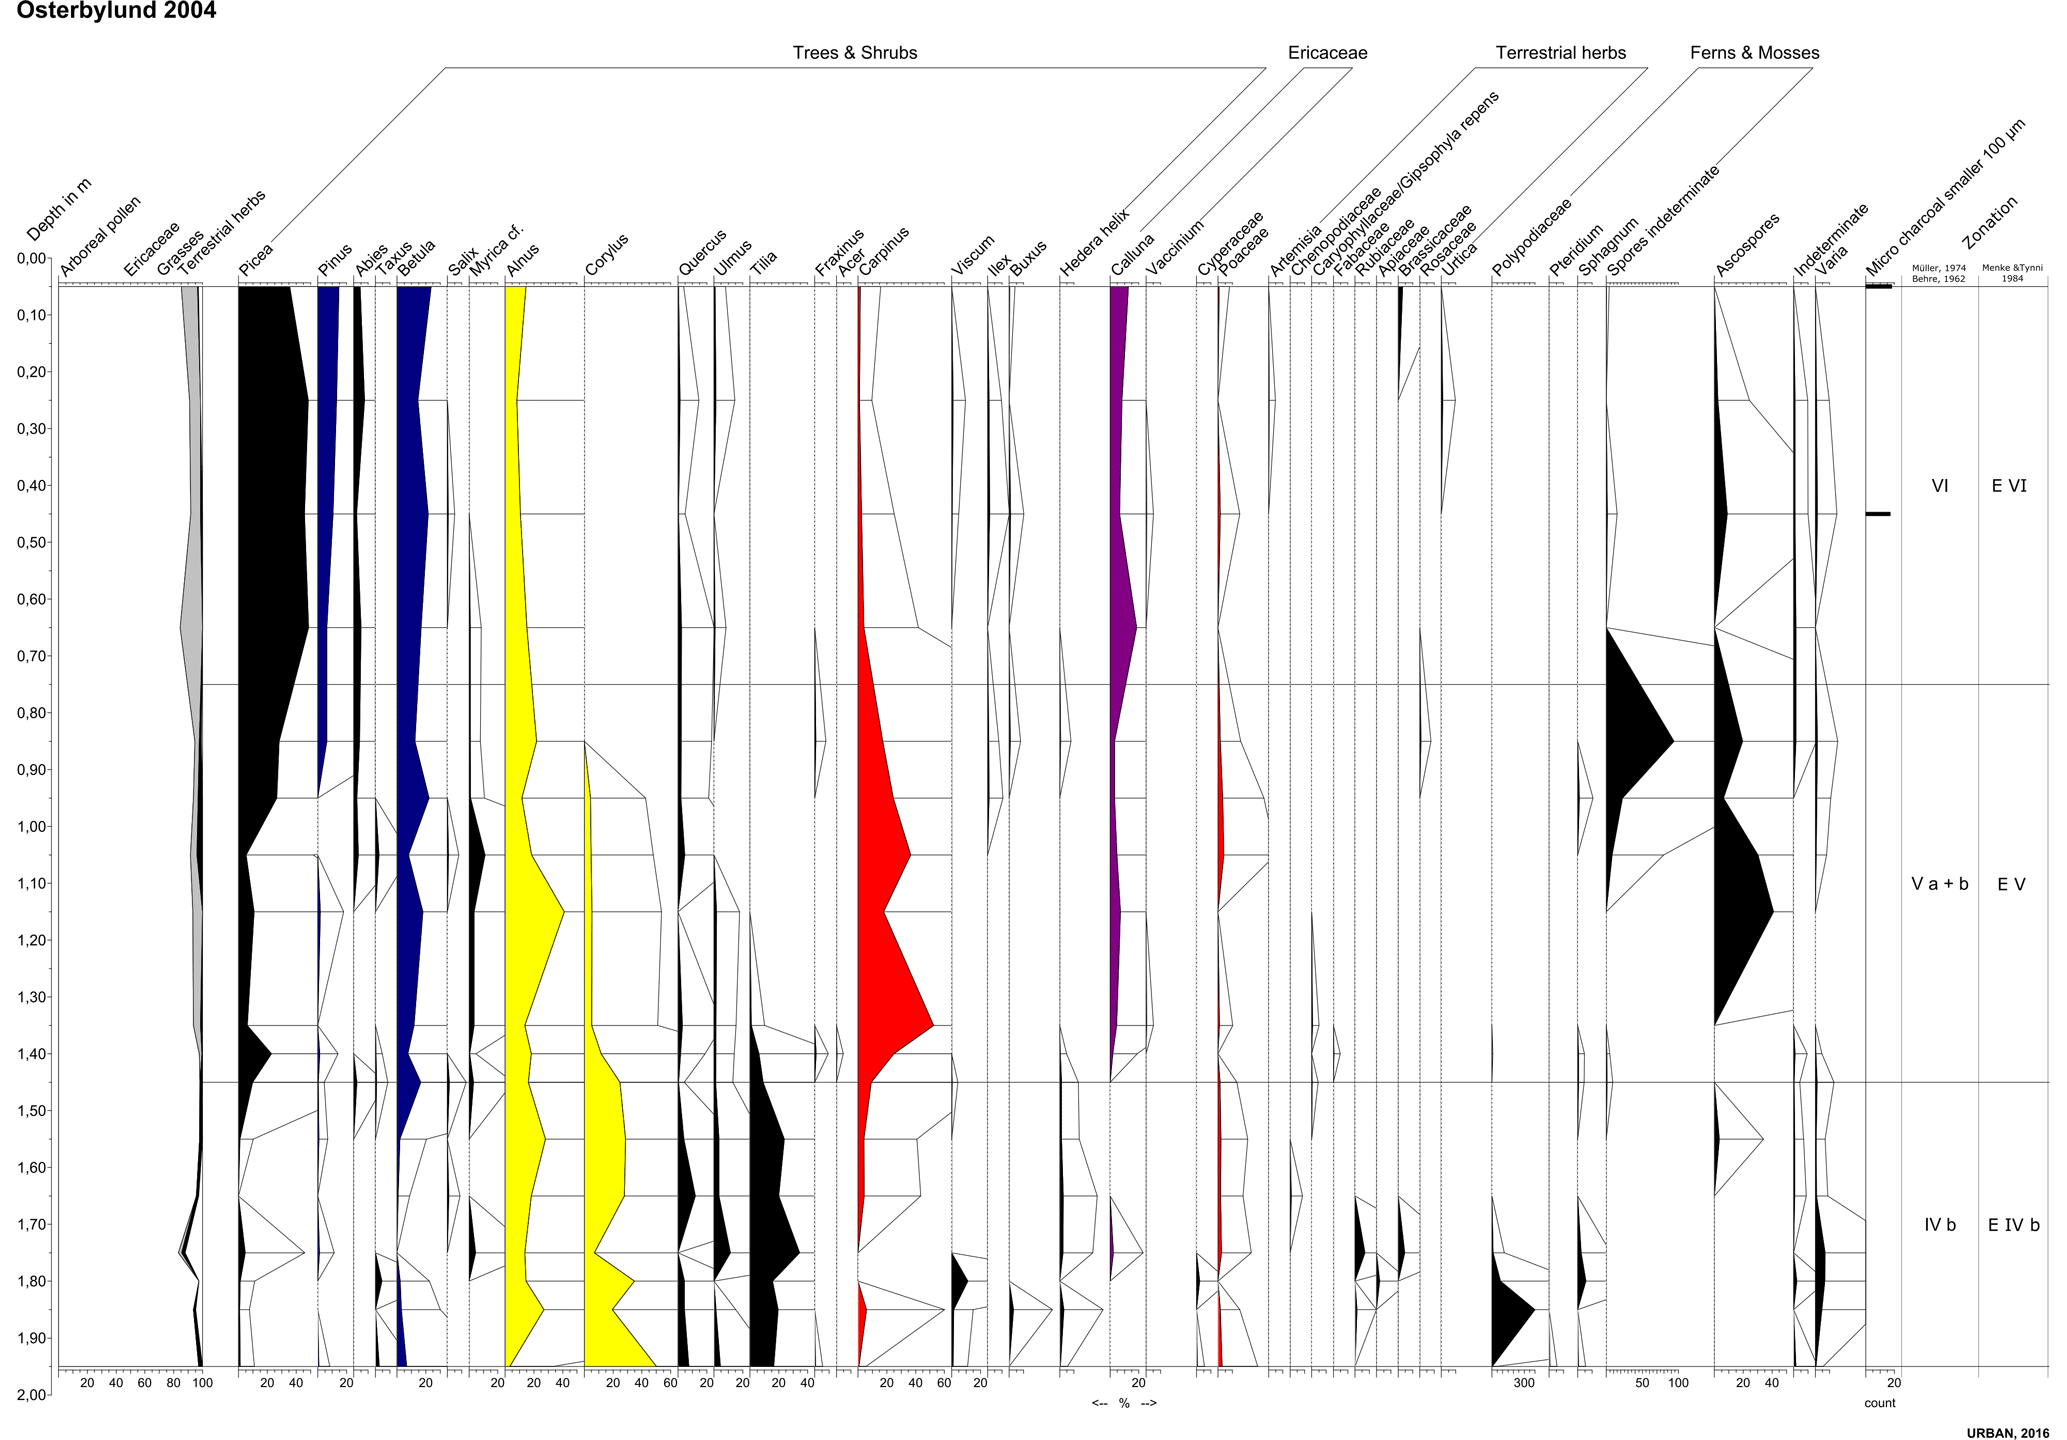
Figure 9Pollen diagram from the brown and black peats sampled in 2004 (profile 2005-2). Pollen calculations for diagram construction were performed with the software packages Tilia, Tilia Graph, and Tilia View (Grimm, 1990).
-
Zone E IVb (1.45–1.95 m). This part of the diagram is characterised by high amounts of Corylus between 20 %–40 % and Tilia (around 20 %), whereas Taxus reaches values of about 10 %. Viscum, Ilex, Hedera helix, as well as Buxus, reach higher values in comparison to the preceding and following zone. Quercus and Ulmus are present with amounts below 10 %; Picea and Carpinus pollen are occurring with even smaller amounts. In the lower part of the zone Polypodiaceae spores are abundant, and Sphagnum spores occur with higher amounts during this zone compared to the rest of the investigated material. Towards the top of the zone the curves of Picea and particularly of Carpinus strongly increase, whereas Tilia drops below 10 %. During the entire zone Alnus does not reach more than 20 %. The overlap of Tilia and Corylus decreases, and Carpinus spread marks the upper boundary of zone E IVb.
-
Zone E V (1.45–0.75 m). This zone is strongly dominated by Carpinus (up to 40 %), decreasing towards the top of the zone, and by Picea which increases parallel to the drop of Carpinus. The amounts of Betula have increased up to 20 %, whereas Corylus has dropped below about 5 %, disappearing entirely towards the top of the zone. Alnus is increasing (up to 40 %) in the lower part of the zone and decreasing towards its top. Abies is found to occur continuously from about the middle part of the zone. Quercus slightly increases again towards the top of zone. Taxus is found in small amounts associated with the start of the Abies curve. Ilex, Viscum, and Buxus are only present in small amounts. Myrica and Ericaceae, mainly Calluna, as well as Poaceae and further non-arboreal pollen (NAP), increase as well. Ascomycete spores and the sum of unidentified spores, probably deriving from mosses, reach rather high values. The upper boundary of Zone V is drawn at the drop of the Carpinus curve below 10 % and the increase of Picea, Pinus, and Abies.
-
Zone E VI (0.05–0.75 m). The youngest pollen zone of the peat layer is mainly characterised by Picea, Pinus, Abies, and Betula. Picea reaches high amounts of about 40 %, and the Pinus curve is only increasing towards the top of the zone. The curves of Ulmus, Quercus, and Carpinus dropped down to 1 % and below 1 %. Alnus is still present with lower amounts of around 10 %. Within the NAP the first occurrence of Artemisia is as notable as a remarkable increase of Calluna of up to nearly 20 %.
The correlation between the individual profiles is based on the humic layers representing palaeosols (OBL 1–4) and the OSL ages. The sedimentological investigations in 2016 lead to the conclusion that the lower diamicton is a subglacial traction till (Evans et al., 2006) deposited during a Saalian advance of the Scandinavian Ice Sheet. The sand lenses present (Figs. 5 and 6) could either be formed by supraglacial, englacial, or subglacial drainage systems and had been subsequently incorporated into the till. The faintly stratified upper part of unit I (Fig. 6) could either be a supraglacial melt-out till (Lukas and Rother, 2016) or the result of periglacial reworking processes after or during an ice decaying phase.
OBL 1 is to be correlated with the up to 2 m thick peat found during the excavations in profiles 2003 and 2005-2, filling a depression on the surface of the till (see Figs. 2 and 3). Due to the open-system behaviour of the peat, no ages can be presented. The OSL age of 86 ± 8 ka (LUM 1138; Fig. 3) from well-bleached sediments well above OBL 1 shows that the peat is older than the Odderade interstadial (Fig. 10). The corresponding sample LUM 470 is poorly bleached and cannot add any information. Further age constraint is exclusively provided by the pollen analysis, as the OSL sample (LUM 1137) underlying the peat is both poorly bleached and saturated; no accurate age can be presented for this sample.
The onset of the Corylus, Tilia, and Taxus curves and the maximum distribution of Corylus characteristic for Eemian pollen zone E IVa (Menke and Tynni, 1984) are not recorded in the peat layer of Osterbylund. Peat growth at the investigated location started only during the second half of pollen zone IV, the Tilia phase of Menke and Tynni (1984) which is characterised by the dominance of Tilia and of Corylus, next to Ulmus and Quercus. Taxus only reaches values of about 10 % during E IVb at Osterbylund, further indicating that peat growth started only after the pronounced Taxus phase (Menke and Tynni, 1986) during the younger part of zone IVb. This zone corresponds to pollen zone IVb of Behre (1962) and Müller (1974), respectively. According to varve counts of Eemian deposits at Munster-Breloh and estimates of the duration of pollen zones of Müller (1974), zone IVb should have had a duration of 1100 years.
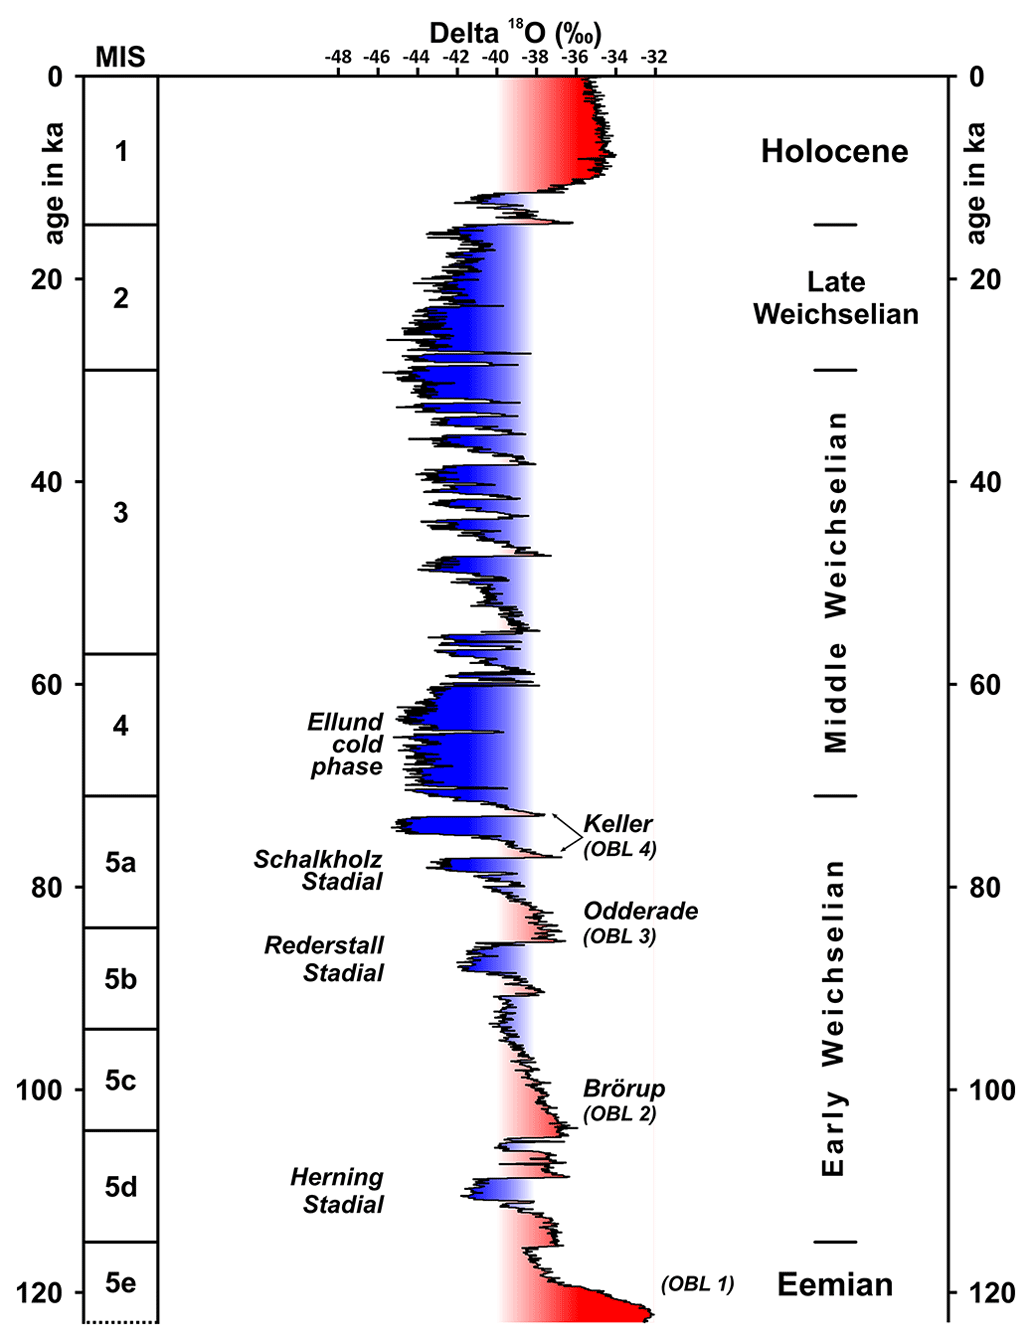
Figure 10Oxygen isotope curve (NGRIP Community Members, 2004) showing the marine isotope stages (MIS) and Late Pleistocene subdivision. After the Eemian (5e; OBL 1) three phases warm enough for soil formation (interstadials) are present and in Osterbylund represented by palaeosols: Brörup = OBL 2, Odderade = OBL 3, and Keller = OBL 4.
The following zone, which seems to be fully preserved, corresponds to the Carpinus zone E V (Menke and Tynni, 1984) and can be correlated with pollen zones Va and Vb of Müller (1974). The occurrence of Viscum, Hedera helix, and Buxus in this and the following zones has been recorded from other western European Eemian sites (Litt, 1994; Zagwijn, 1996; Kühl and Litt, 2007) including adjacent areas from northern Germany (Behre, 1962; Behre and Lade, 1986; Müller, 1974; Menke and Tynni, 1984; Ziemus, 1989; Behre et al., 2005) and characterises the thermal optimum of the interglacial. Müller (1974) has estimated the duration of zone E V, Va and Vb, to about 4000 years.
The youngest recorded pollen zone in Osterbylund, correlated with zone E VI (Menke and Tynni, 1984) and zone VI of Müller (1974), shows a decrease of deciduous thermophilous trees and the expansion of Picea, Pinus, Abies, and Betula, marking the beginning of the termination of the interglacial. The overrepresentation of Picea in the profile of Osterbylund compared to other profiles from northern Germany might be caused by local peat bog conditions favouring spruce-rich forest swamps (Menke and Tynni, 1984). This interpretation and the large occurrence of Calluna in the upper zone from about 0.75 m upwards are in agreement with a change in peat composition. Compared to central or southern German locations (Grüger, 1979; Urban et al., 1991; Litt, 1994; Litt et al., 1996), the relative low representation of Abies during this late interglacial phase at Osterbylund and at other northern German sites, e.g. Lichtenberg (Veil et al., 1994; Hein et al., 2021), is caused by the northern limit of the distribution area of Abies which lay in Jutland during that time (Zagwijn, 1989). The transition to pollen zone VII and the entire pollen zone VII, representing the end of the interglacial, are not recorded as the uppermost part of the peat has been eroded. Müller (1974) estimated the duration of Eemian pollen Zone VI (E VI after Menke and Tynni, 1984) to about 1000 years, whereas Kühl and Litt (2007) published a revised extrapolation of 2000 years.
According to these time estimates, the duration of the Eemian peat layer formation at Osterbylund, which comprises pollen zones E IVb, E V, and most parts of E VI (Menke and Tynni, 1984; Müller, 1974), can roughly be estimated to about 6000 years. Turner (2002) pointed out that the entire duration of the terrestrial Eemian north of the Alps or Pyrenees was less than 13 000 years, which matches the results of Urban (2007) who proposed a duration of 10 ka for pollen zones E1–E6 of the Eemian sensu stricto (Zagwijn, 1961) and 10 000 years for the entire interglacial. The terrestrial Eemian has been correlated with MIS5e of the deep-sea chronology (Shackleton, 1969, Mangerud et al., 1979; Fig. 10) and spans the time between about 126 to 115 ka (summarised in Urban, 2007). The age of the peat layer of Osterbylund therefore can be estimated to be about 120 ka.
The reworking of the OBL 1 palaeosol will thus have occurred after MIS5e. Due to the soil formation processes and the resulting post-depositional changes, the interpretation of the depositional environment cannot be reconstructed unambiguously. Slope movements under periglacial conditions are conceivable (Stephan et al., 2017), which filled former depressions of the landscape topography (Guerra et al., 2017). In addition, denudation processes may have partly contributed to the deposition, at least of the lower and middle part of unit II (Fig. 6). In this context, the occurrence of channel-like structures filled with granules is of importance. The better sorting of the upper sandy part of unit II might indicate that aeolian processes have also contributed to the deposition. In unit II the Ah horizon at the top (= OBL 2) illustrates a halt in sedimentation and consequently a hiatus; at least some erosion of the former Ah horizon is likely. The age of 86 ± 8 ka (LUM 1138, Fig. 3) from just below OBL 2 puts the formation of this palaeosol either into the Brörup or the Odderade interstadial (Fig. 10). Considering that there is no indication of a hiatus, it is more likely that OBL 2 is to be correlated with the Brörup interstadial.
The formation of unit III (Fig. 6), which brackets OBL 2 and OBL 3 (Figs. 3 and 4), is probably related to slope movements (Stephan et al., 2017, and their Fig. 7) under periglacial conditions (Millar, 2013). Especially soft sediment deformation structures indicate gravity-induced failures along the basin slope (Blair and McPherson, 2009). This assumption is supported by the outsized clasts within the upper part of this sand package, which have been transported downslope. Furthermore, the sand-filled cracks and fissures suggest freeze–thaw action and the existence of permafrost and thus subarctic conditions. The seasonal thawing of the active layer induced frost creeping of larger stones and boulders down the slope. Some of these boulders show fragmentation due to volume expansion of freezing water in fissures. This clearly implies cold climate conditions during the deposition of the sandy part of this unit. OBL 3 developed most likely under an interstadial climate after 69 ± 6 ka (LUM 1139), which is the age of the underlying sand. The equivalent sample LUM 469 was dated to 68 ± 6 ka, supporting the age constrain. According to these dating results, one could assign the soil formation to either the Odderade or Keller interstadial (Fig. 10).
Above the OBL 3 palaeosol there are aeolian sands, for which good OSL signal resetting had to be expected. While the age of 60 ± 6 ka (LUM 1140) just below the humic horizon of OBL 4 (Fig. 3) seems reliable according to the OSL testing and statistical parameters, the sand covering the palaeosol was poorly bleached, which results in a possibly overestimated age of 43 ± 4 ka (LUM 1141). If that age was the true depositional age, it would fall into MIS3, thus implying a significant hiatus, for which no field evidence was present. From the sedimentological observations it is not possible to reconstruct a distinct depositional environment to these sands (Fig. 6). The burrow-like structures across this unit display the occurrence of digging animals such as rodents. If true, this could indicate a tundra-steppe ecosystem in a periglacial landscape (Dupal et al., 2013). This assumption is supported by the existence of ice wedge casts. If such an ice wedge was accidentally sampled, even younger material than representative for the sandy layer could have been sampled. It is therefore not possible to finally conclude on the age of the sand overlying OBL 4.
However, there are no phases warm enough for soil formation during this period, and despite this unknown, assignment of this humic horizon to the Keller interstadial (Fig. 10) seems feasible, thereby assigning OBL 3 to the Odderade interstadial. The sandy deposits of the upper section of unit VI would therefore belong to the Ellund cold phase or even younger (Fig. 10).
Because of the unequivocal palynological assignment of the peat to the Eemian, an upper limit to the age of the palaeosols (OBL 2–4) above the peat is clear. Thus, the entire push moraine complex (Fig. 1) has to be of Saalian age. This observation makes a Weichselian glacial margin even further west unlikely, i.e. south of the Danish border, as discussed by Houmark-Nielsen (2007). All palaeosols formed during the early Weichselian (MIS 5a–d), which is in agreement with the observations of Gripp et al. (1965). While the pollen data provide a clear view on the age of OBL 1, the luminescence data cannot be interpreted unambiguously; they have to be seen in their entirety and not on their own.
The aim of this study was not only to unravel the age of the push moraine complex Wallsbüll-Böxlund, Schleswig-Holstein, but also to assign the peat and palaeosols present in depressions in Osterbylund to interglacials and interstadials in order to add another jigsaw piece to the understanding of the glacial history in the western Baltic region.
The attempt to date the peat layers using dating failed due to the open-system behaviour of both the brown and the black peat. However, the pollen analyses allowed for clear assignment of the peat and thus of the palaeosol OBL 1 to the Eemian. This coincides with the saturated and correspondingly old age of the sands underlying the peat; the sands above the peat were dated to the early Weichselian. While for palaeosol OBL 2 the assignment to the Brörup interstadial is clear, the correlation of the palaeosols OBL 3 and OBL 4 to any interstadial is hampered due to the limited luminescence data available. Poor luminescence signal resetting especially of the sands above OBL 4 makes an assessment of an upper limit for the palaeosol formation difficult. However, from the field, as well as luminescence data, it is most likely that OBL 3 formed during the Odderade interstadial and OBL 4 during the Keller interstadial. This observation contrasts previous findings claiming that only two post-Eemian thermomers, i.e. Brörup and Odderade interstadials, are to be expected due to the insolation of the Northern Hemisphere. The weakly developed OBL 4 seems to indicate though that warm oceanic currents in the North Atlantic and correspondingly in northern Germany resulted in another – terrestrial – third weak thermomer and is thus not unique to marine settings and ice cores.
With Eemian up to early Weichselian ages of the peat and palaeosols, filling the depression it is evident that the push moraine complex is of Saalian age; a Weichselian ice margin further in the west as assumed in other studies is therefore unlikely. It is certainly worth investigating the position and ages of the Weichselian ice margins in the future as this would complement the studies from Denmark and NE Germany.
Data are available from the authors upon request.
Treated and untreated material for luminescence dating, as well as dose rate samples, are stored at the Leibniz Institute for Applied Geophysics. Remaining material from the peat is stored at both Leibniz Institute for Applied Geophysics ( dating) and Leuphana University Lüneburg (pollen analysis).
The supplement related to this article is available online at: https://doi.org/10.5194/egqsj-72-57-2023-supplement.
HJS and MF initiated the study. HSJ, MF, MS, BU, and MK investigated the sites in the field and took samples. CT undertook the luminescence dating. MS was responsible for dating. BU analysed and interpreted the pollen. CT and HJS prepared the manuscript with contributions from MS, BU, and MK.
The contact author has declared that none of the authors has any competing interests.
Publisher’s note: Copernicus Publications remains neutral with regard to jurisdictional claims in published maps and institutional affiliations.
The technical assistance of Sonja Riemenschneider, Gudrun Drewes, Sabine Mogwitz, and Petra Posimowski (LIAG) is very much appreciated. Margot Böse and Tony Reimann are thanked for their constructive comments, which helped to improve the manuscript. Christopher Lüthgens is thanked for the editorial handling.
This research has been supported by the Deutsche Forschungsgemeinschaft (grant no. KE 2023/2–1).
This paper was edited by Christopher Lüthgens and reviewed by Margot Böse and Tony Reimann.
Ad-hoc-Arbeitsgruppe Boden (AG Boden): Bodenkundliche Kartieranleitung, edited by: Bundesanstalt für Geowissenschaften und Rohstoffe in Zusammenarbeit mit den Staatlichen Geologischen Diensten, Hannover, 5th edn., 438 pp., ISBN 9783510959204, 2005.
Aitken, M. J.: Thermoluminescence Dating, Academic Press, London, 351 pp., 1985.
Behre, K.-E.: Pollen- und diatomeenanalytische Untersuchungen an letztinterglazialen Kieselgurlagern der Lüneburger Heide, Flora, 152, 325–370, https://doi.org/10.1016/S0367-1615(17)32595-8, 1962.
Behre, K.-E. and Lade, U.: Eine Folge von Eem und 4 Weichsel-Interstadialen in Oerel/Niedersachsen und ihr Vegetationsablauf, E&G Quaternary Sci. J., 36, 11–36, https://doi.org/10.3285/eg.36.1.02, 1986.
Behre, K.-E., Hölzer, A., and Lemdahl, G.: Botanical macro-remains and insects from the Eemian and Weichselian site of Oerel (northwest Germany) and their evidence for the history of climate, Veget. Hist. Archaeobot. 14, 31–53, 2005.
Beug, H. J.: Leitfaden der Pollenbestimmung für Mitteleuropa und angrenzende Gebiete, Verlag Dr. Friedrich Pfeil, München, Germany, 542 pp., 2004.
Blair, T. C. and McPherson, J. G.: Processes and forms of alluvial fans, in: Geomorphology of desert environments, edited by: Parsons, A. J. and Abrahams, A. D., 413–467, https://doi.org/10.1007/978-1-4020-5719-9_14, 2009.
Buylaert, J.-P., Jain, M., Murray, A. S., Thomsen, K. J., Thiel, C., and Sohbati, R.: A robust feldspar luminescence dating method for Middle and Late Pleistocene sediments, Boreas, 41, 435–451, 2012.
Duller, G. A. T.: Distinguishing quartz and feldspar in single grain luminescence measurements, Rad. Measure., 37, 161–165, 2003.
Duller, G. A. T.: Single-grain optical dating of Quaternary sediments: why aliquot size matters in luminescence dating, Boreas, 37, 589–612, 2008.
Dupal, T. A., Andrenko, O. V., and Vinogradov, V. V.: Mammals of the Periglacial Hyperzone of the End of the Pleistocene and Formation of the Modern Rodent Fauna in the Mountains, Contemp. Prob. Ecol., 6, 94–104, 2013.
Evans, D. J. A., Phillips, E. R., Hiemstra, J. F., and Auton, C. A.: Subglacial till: Formation, sedimentary characteristics and classification, Earth-Sci. Rev,. 78, 115–176, 2006.
Faegri, K. and Iversen, J.: Textbook of Pollen Analysis, edited by: Faegri, K., Kaland, P. E., and Krzywinski, K., 4th Edn., John Wiley and Sons, Chichester, 328 pp., 1989.
Galbraith, R. F., Roberts, R. G., Laslett, G. M., Yoshida, H., and Olley, J. M.: Optical dating of single and multiple grains of quartz from Jinmium rock shelter, Northern Australia: Part I: experimental design and statistical models, Archaeometry, 41, 339–364, 1999.
Geyh, M. A.: 230Th/U-dating of intergarcial and interstadial fen peat and lignite: Potential limits, E&G Quaternary Sci. J., 57, 77–94, https://doi.org/10.3285/eg.57.1-2.4, 2008.
Grimm, E. C.: TILIA and TILIA. GRAPH: PC spreadsheet and graphics software for pollen data (Version 2.0.b.4), INQUA – Commission for the Study of the Holocene, Working-Group on Data-Handling Methods, Newsletter 4, 5–7, 1990.
Gripp, K., Dücker, A., and Johannsen, A.: Ekskursion til Sild, Slesvig og Øst-Holstein, Meddelelser fra Dansk Geologisk Forening, 15, 603–617, 1965.
Grüger, E.: Spätriss, Riss/Würm und Frühwürm am Samerberg in Oberbayern – ein vegetationsgeschichtlicher Beitrag zur Gliederung des Jungpleistozäns, Geol. Bavarica, 80, 5–64, 1979.
Guérin, G., Mercier, N., and Adamiec, G.: Dose-rate conversion factors: update, Ancient TL, 29, 5–8, 2011.
Guerra, A. J. T., Fullen, M. A., Jorge, M. C. O., Bezerra, J. F. R., and Shokr, M. S.: Slope Processes, Mass Movement and Soil Erosion: A Review, Pedosphere, 27, 27–41, 2017.
Hein, M., Urban, B., Tanner, D. C., Buness, A. H., Tucci, M., Hoelzmann, P., Dietel, S., Kaniecki, M., Schultz, J., Kasper, T., von Suchodoletz, H., Schwalb, A., Weiss, M., and Lauer, T.: Eemian landscape response to climatic shifts and evidence for northerly Neanderthal occupation at a palaeolake margin in Northern Germany, Earth Surf. Process. Landf., 2021, 2884–2901, https://doi.org/10.1002/esp.5219, 2021.
Houmark-Nielsen, M.: Extent and age of Middle and Late Pleistocene glaciations and periglacial episodes in southern Jylland, Denmark. DGF, B. Geol. Soc. Denmark, 50, 9–35, 2007.
Houmark-Nielsen, M.: Extent, age and dynamics of Marine Isotope Stage 3 glaciations in the southwestern Baltic Basin, Boreas, 39, 343–359, 2010.
Hughes, A. L. C., Gyllencreutz, R., Lohne, Ø. S., Mangerud, J., and Svendsen, J. I.: The last Eurasian ice sheets – a chronological database and time-slice reconstruction, DATED-1, Boreas, 45, 1–45, 2016.
Jacobs, Z., Roberts, R. G., Galbraith, R. F., Deacon, H. J., Grün, R., Mackay, A., Mitchell, P., Vogelsang, R., and Wadley, L.: Ages for the Middle Stone Age of southern Africa: implications for human behavior and dispersal, Science, 322, 733–735, 2008.
Kenzler, M., Tsukamoto, S., Meng, S., Frechen, M., and Hüneke, H.: New age constraints from the SW Baltic Sea area – implications for Scandinavian Ice Sheet dynamics and palaeo-environmental conditions during MIS 3 and early MIS 2, Boreas, 46, 34–52, 2017.
Kenzler, M., Rother, H., Hüneke, H., Frenzel, P., Strahl, J., Tsukamoto, S., Li, Y., Meng, S., Gallas, J., and Frechen, M.: A multi-proxy palaeoenvironmental and geochronological reconstruction of the Saalian-Eemian-Weichselian succession at Klein Klütz Höved, NE Germany, Boreas, 47, 114–136, https://doi.org/10.1111/bor.12255, 2018.
King, G. E., Robinson, R. A. J., and Finch, A. A.: Towards successful OSL sampling strategies in glacial environments: deciphering the influence of depositional processes on bleaching of modern glacial sediments from Jostedalen, Southern Norway, Quaternary Sci. Rev., 89, 94–107, 2014.
Kühl, N. and Litt, T.: Quantitative Time-Series Reconstruction of Holsteinian and Eemian Temperatures Using Botanical Data, in: The Climate of Past Interglacials, edited by: Sirocko, F., Litt, T., Claussen, M., and Sanchez-Goni, M. F., 239–254, https://doi.org/10.1016/S1571-0866(07)80041-8, 2007.
Litt, T.: Paläoökologie, Paläobotanik und Stratigraphie des Jungquartärs im nordmitteleuropäischen Tiefland, Dissertationes Botanicae 227, Cramer, Berlin-Stuttgart, 185 pp., ISBN 978-3-443-64139-9, 1994.
Litt, T., Junge, F. W., and Böttger, T.: Climate during the Eemian in north-central Europe – a critical review of the palaeobotanical and stable isotope data from central Germany, Veg. Histor. Archaeob., 5, 247–256, 1996.
Lukas, S. and Rother, H.: Moränen versus Till: Empfehlungen für die Beschreibung, Interpretation und Klassifikation glazialer Landformen und Sedimente, E&G Quaternary Sci. J., 65, 95–112, https://doi.org/10.3285/eg.65.2.01, 2016.
Lüthgens, C., Böse, M., and Preusser, F.: Age of the Pomeranian ice-marginal position in northeastern Germany determined by Optically Stimulated Luminescence (OSL) dating of glaciofluvial sediments, Boreas, 40, 598–615, 2011.
Lüthgens, C., Hardt, J., and Böse, M.: Proposing a new conceptual model for the reconstruction of ice dynamics in the SW sector of the Scandinavian Ice Sheet (SIS) based on the reinterpretation of published data and new evidence from optically stimulated luminescence (OSL) dating, E&G Quaternary Sci. J., 69, 201–223, https://doi.org/10.5194/egqsj-69-201-2020, 2020.
Mangerud, J., Sonstegaard, E., and Sejrup, H. P.: Correlation of the Eemian (interglacial) stage and the deep-sea oxygen-isotope stratigraphy, Nature, 277, 189–192, 1979.
Menke, B. and Tynni, R.: Das Eeminterglazial und das Weichselfrühglazial von Rederstall/Dithmarschen und ihre Bedeutung für die mitteleuropäische Jungpleistozän-Gliederung, Geologisches Jahrbuch A, 7, 1–120, 1984.
Millar, S.: Mass movement processes in the periglacial environment, in: Treatise on Geomorphology, edited by: Shroder, J., Giardino, R., and Harbor, J., Academic Press, San Diego, CA, Vol. 8, Glacial and Periglacial Geomorphology, 374–391, https://doi.org/10.1016/B978-0-12-374739-6.00217-7, 2013.
Moore P. D., Webb J. A., and Collins, M. E.: Pollen analysis, Oxford, 216 pp., 1991.
Müller, H.: Pollenanalytische Untersuchungen und Jahresschichtenzählungen an der eem-zeitlichen Kieselgur von Bispingen/Luhe, Geologisches Jahrbuch A, 21, 149–169, 1974.
Murray, A. S. and Wintle, A. G.: Luminescence dating of quartz using an improved single-aliquot regenerative-dose protocol, Rad. Measure., 32, 57–73, 2000.
Murray, A. S. and Wintle, A. G.: The single aliquot regenerative dose protocol: potential for improvements in reliability, Rad. Measure., 37, 377–381, 2003.
Murray, A. S., Wintle, A. G., and Wallinga, J.: Dose estimation in using quartz OSL in the nonlinear region of the growth curve, Rad. Protect. Dosim., 101, 371–374, 2002.
Murray, A. S., Thomsen, K. J., Masuda, N., Buylaert, J.-P., and Jain, M.: Identifying well-bleached quartz using the different bleaching rates of quartz and feldspar luminescence signals, Rad. Measure., 47, 688–695, 2012.
NGRIP Community Members: High-resolution record of Northern Hemisphere climate extending into the last interglacial period, Nature, 431, 147–151, 2004.
Osmond, J. K. and Ivanovich, M.: Uranium-series mobilization and surface hydrology, in: Uranium-series disequilibrium, edited by: Ivanovich, M. and Harmon, R. S., 2nd ed. Oxford Science Publications, 259–289, RN:25066325, 1992.
Osmond, J. K., May, J. P., and Tanner, W. F.: Age of the Cape Kennedy barrier-and-lagoon complex, J. Geophys. Res., 75, 5459–5468, 1970.
Pisarska-Jamroży, M., Belzyt, S., Börner, A., Hoffmann, G., Hüneke, H., Kenzler, M., Obst, K., Rother, H., and Van Loon, A. T.: Evidence from seismites for glacioisostatically induced crustal faulting in front of an advancing land-ice mass (Rügen Island, SW Baltic Sea), Tectonophysics, 745, 338–348, 2018.
Prescott, J. R. and Hutton, J. T.: Cosmic ray contributions to dose rates for luminescence and ESR dating: large depths and long-term variations, Rad. Measure., 23, 497–500, https://doi.org/10.1016/1350-4487(94)90086-8, 1994.
Rinterknecht, V., Börner, A., Bourlès, D., and Braucher, R.: Cosmogenic 10Be dating of ice sheet marginal belts in Mecklenburg-Vorpommern, Western Pomerania (northeast Germany), Quat. Geochronol., 19, 42–51, 2014.
Roberts, H. M.: The development and application of luminescence dating to loess deposits: a perspective on the past, present and future, Boreas, 37, 483–507, 2008.
Schwarcz, H. P. and Latham, A. G.: Dirty calcites: 1. uranium series dating of contaminated calcite using leachates alone, Chem. Geol. (Isotope Geoscience Letters), 80, 35–43, 1989.
Seierstad, I. K., Abbott, P. M., Bigler, M., Blunier, T., Bourne, A. J., Brook, E., Buchardt, S. L., Buizert, C., Clausen, H. B., Cook, E., Dahl-Jensen, D., Davies, S. M., Guillevic, M., Johnsen, S. J., Pedersen, D. S., Popp, T. J., Rasmussen, S. O., Severinghaus, J. P., and Vinther, B. M.: Consistently dated records from the Greenland GRIP, GISP2 and NGRIP ice cores for the past 104 ka reveal regional millennial-scale δ18O gradients with possible Heinrich event imprint, Quaternary Sci. Rev., 106, 29–46, 2014.
Shackleton, N. J.: The last interglacial in the marine and terrestrial records, P. Roy. Soc. London 174, 134–154, 1969.
Sierralta, M., Urban, B., and Frechen, M.: dating results from opencast mine Schöningen. Forschungen zur Urgeschichte aus dem Tagebau von Schöningen, Band 1, 143–154, https://doi.org/10.11588/propylaeum.465, 2012.
Stephan, H. J.: Osterbylund – Aufschlusskurzbericht 1121/33-I, 2 p., Flintbek (Geologisches Landesarchiv, LLUR), https://doi.org/10.1016/S1571-0866(07)80053-4, 1988.
Stephan, H.-J., Burbaum, B., Frechen, M., Kenzler, M, Krienke, K., Thiel, C., Lungershausen, U., Tummuscheit, A., Urban, B., and Sierralta, M.: Exkursion E2: Quartärgeologie und Archäologie im Norden Schleswig-Holsteins. Tagungsband und Exkursionsführer – 80. Tagung der Arbeitsgemeinschaft Norddeutscher Geologen, 6–9 June 2017, Rendsburg, 123–150, 2017.
Stremme, H. E.: Quartär-Exkursionen in Schleswig-Holstein zur 7th Session of the International Geological Correlation Programme, Project 24, Quaternary Glaciations in the Northern Hemisphere Schleswig-Holstein, Germany (21–23 September 1980), 1981.
Stremme, H. E.: Die Korrelation quartärer Paläoböden in Nordwest-Deutschland, Zeitschrift für Geomorphologie, Suppl.-Vol. 61, 89-100, ISBN 978-3-443-21061-8, 1986.
Stremme, H. E. and Weinhold, H.: Böxlund (westlich von Flensburg), fossile Böden der Treene-Warmzeit mit Stauchung durch Warthe-Gletscher und fossile Böden der Eem-Warmzeit, mit einem Beitrag von S. Christensen, in: Quartär-Exkursionen/ Quaternary-Excursions in Schleswig-Holstein, edited by: Stremme, H. E. and Menke, B., 79–89 pp., 1980.
Stremme, H. E., Felix-Henningsen, P., Weinhold, H., and Christensen, S.: Paläoböden in Schleswig-Holstein, Geologisches Jahrbuch F14, 311–361, 1982.
Thomsen, K. J., Bøtter-Jensen, L., Denby, P. M., Moska, P., and Murray, A. S.: Developments in luminescence measurement techniques, Rad. Measure., 41, 768–773, 2006.
Turner, C.: Problems of the Duration of the Eemian Interglacial in Europe North of the Alps, Quaternary Res., 58, 45–48, 2002.
Urban, B.: Interglacial pollen records from schöningen, North Germany, in: The Climate of the Past Interglacials, edited by: Sirocko, F., Litt, T., Claussen, M., and Sanchez-Goni, M. F., 417–444, 2007.
Urban, B., Elsner, H., Hölzer, A., Mania, D., and Albrecht, B.: Eine eem- und frühweichselzeitliche Abfolge im Tagebau Schöningen, Landkreis Helmstedt, Eiszeitalter und Gegenwart (E&G) 41, 85–99, 1991.
Veil, S., Breest, K., Höfle, H.-C., Meyer, H.-H., Plisson, H., Urban-Küttel, B., Wagner, G., and Zöller, L.: Ein mittelpaläolithischer Fundplatz aus der Weichsel-Kaltzeit bei Lichtenberg, Lkr. Lüchow-Dannenberg, Germania, 72, 1–66, 1994.
Waas, D., Kleinmann, A., and Lepper, J.: Uranium-series dating of fen peat horizons from pit Nachtigall in northern Germany, Quaternary Int., 241, 111–124, 2011.
Wintle, A. G. and Murray, A. S.: A review of quartz optically stimulated luminescence characteristics and their relevance in single-aliquot regeneration dating protocols, Rad. Measure., 41, 369–391, 2006.
Zagwijn, W. H.: Vegetation, climate and radiocarbon datings in the Late Pleistocene of the Netherlands, Part I,: Eemian and Early Weichselian. Mededelingen van de Geologische Stichting Nieuwe Series 14, 15–45, 1961.
Zagwijn, W. H.: Vegetation and climate during warmer intervals in the Late Pleistocene of Western and Central Europe, Quaternary Int., 3/4, 57–67, 1989.
Zagwijn, W. H.: An analysis of Eemian climate in western and central Europe, Quaternary Sci. Rev., 15, 451–469, 1996.
Ziemus, H.: Waldentwicklung der Eem-Warmzeit im südwestlichen Schleswig-Holstein am Beispiel einer Kernbohrung, Schr. Naturwiss. Ver. Schlesw.-Holst., 59, 1–17, 1989.
Zöller, L.: Zur Gliederung von Warthe-Vereisung und Treene-Warmzeit im Aufschluss Böxlund – neue Beobachtungen, Z. Geomorphol., Suppl. Vol. 61, 101–108, 1986.
- How to cite
- Abstract
- Kurzfassung
- Introduction
- Geological setting
- Field investigations
- Age determination of the sands and peat
- Results
- Discussion
- Conclusions
- Data availability
- Sample availability
- Author contributions
- Competing interests
- Disclaimer
- Acknowledgements
- Financial support
- Review statement
- References
- Supplement