the Creative Commons Attribution 4.0 License.
the Creative Commons Attribution 4.0 License.
 | 25 May 2020
The genesis of Yedoma Ice Complex permafrost – grain-size endmember modeling analysis from Siberia and Alaska
Lutz Schirrmeister
Elisabeth Dietze
Heidrun Matthes
Guido Grosse
Jens Strauss
Sebastian Laboor
Mathias Ulrich
Frank Kienast
Sebastian Wetterich
The late Pleistocene Yedoma Ice Complex is an ice-rich and organic-bearing type of permafrost deposit widely distributed across Beringia and is assumed to be especially prone to deep degradation with warming temperature, which is a potential tipping point of the climate system. To better understand Yedoma formation, its local characteristics, and its regional sedimentological composition, we compiled the grain-size distributions (GSDs) of 771 samples from 23 Yedoma locations across the Arctic; samples from sites located close together were pooled to form 17 study sites. In addition, we studied 160 samples from three non-Yedoma ice-wedge polygon and floodplain sites for the comparison of Yedoma samples with Holocene depositional environments. The multimodal GSDs indicate that a variety of sediment production, transport, and depositional processes were involved in Yedoma formation. To disentangle these processes, a robust endmember modeling analysis (rEMMA) was performed. Nine robust grain-size endmembers (rEMs) characterize Yedoma deposits across Beringia. The study sites of Yedoma deposits were finally classified using cluster analysis. The resulting four clusters consisted of two to five sites that are distributed randomly across northeastern Siberia and Alaska, suggesting that the differences are associated with rather local conditions. In contrast to prior studies suggesting a largely aeolian contribution to Yedoma sedimentation, the wide range of rEMs indicates that aeolian sedimentation processes cannot explain the entire variability found in GSDs of Yedoma deposits. Instead, Yedoma sedimentation is controlled by local conditions such as source rocks and weathering processes, nearby paleotopography, and diverse sediment transport processes. Our findings support the hypothesis of a polygenetic Yedoma origin involving alluvial, fluvial, and niveo-aeolian transport; accumulation in ponding waters; and in situ frost weathering as well as postdepositional processes of solifluction, cryoturbation, and pedogenesis. The characteristic rEM composition of the Yedoma clusters will help to improve how grain-size-dependent parameters in permafrost models and soil carbon budgets are considered. Our results show the characteristic properties of ice-rich Yedoma deposits in the terrestrial Arctic. Characterizing and quantifying site-specific past depositional processes is crucial for elucidating and understanding the trajectories of this unique kind of ice-rich permafrost in a warmer future.
Der spätpleistozäne Yedoma Eiskomplex ist ein eisreicher und organikhaltiger Permafrosttyp, der in Beringia weit verbreitet ist. Durch den hohen Eisanteil wird der Yedoma Eiskomplex im Zuge des Klimawandels als besonders anfällig für tiefgreifende Störungen betrachtet und damit ein potentieller Kipppunkt des Klimasystems. Um seine Entstehung, die lokalen Eigenschaften und die regionale sedimentologische Zusammensetzung besser zu verstehen, haben wir die Korngrößenverteilung von 771 Proben an 23 Yedoma-Standorten in der Arktis zusammengestellt; räumlich eng zusammenhängende Probenserien wurden zu 17 Untersuchungsstandorten zusammengefasst. Darüber hinaus wurden 160 Proben aus nicht Yedoma-Ablagerungen von drei Eiskeilpolygon- und Überschwemmungsgebieten als holozäne Referenzen untersucht. Die multimodalen Korngrößenverteilungen zeigen, dass eine Vielzahl von Sedimentbildungs-, Transport- und Ablagerungsprozessen an der Yedoma-Entstehung beteiligt waren. Um diese Prozesse zu erkennen, wurde eine robuste Endmembermodellierungsanalyse (rEMMA) durchgeführt. Neun robuste Endmember (rEM) charakterisieren die Yedoma-Ablagerungen über ganz Beringia. Die untersuchten Standorte der Yedoma-Ablagerungen wurden anschließend mittels Clusteranalyse klassifiziert. Die daraus resultierenden vier Cluster umfassen zwei bis fünf Untersuchungsstandorte, die unregelmäßig über den Nordosten Sibiriens und Alaska verteilt sind. Die breite Palette von rEMs zeigt, dass nicht allein äolische Sedimentationsprozesse für die Variabilität in den Korngrößenverteilungen von Yedoma-Ablagerungen verantwortlich sind. Vielmehr wird die Sedimentation der Yedoma-Ablagerungen eher durch lokale Bedingungen wie Ausgangsgesteine, ehemalige Topographie und multiple Transportprozesse gesteuert. Das stützt die Hypothese einer polygenetischen Yedoma-Entstehung, die alluvialen, fluvialen und nival-äolischen Transport und Akkumulation in polygonalen Tümpeln und in-situ Frostverwitterung sowie postsedimentäre Frostverwitterung, Solifluktion, Kryoturbation und Pedogenese beinhaltet. Die charakteristische rEM Zusammensetzung der Yedoma Cluster kann auch helfen korngrößenspezifische Parameter besser in der Kohlenstoffbudgetierung und Permafrostmodellierung zu berücksichtigen. Damit trägt die Charakterisierung und Quantifizierung standortspezifischer Ablagerungsprozesse in der Vergangenheit dazu bei, die charakteristischen Eigenschaften eisreicher Yedoma-Ablagerungen in der terrestrischen Arktis aufzuklären. Dies ist entscheidend für das Verständnis der Fortentwicklung dieses besonderen Permafrosttyps in einer wärmeren Zukunft.
- Article
(8126 KB) - Full-text XML
-
Supplement
(2327 KB) - BibTeX
- EndNote


The formation and distribution of late Pleistocene Yedoma Ice Complex deposits located in western (Siberia) and eastern (Alaska and northwest Canada) Beringia are still widely debated (Table S1 in the Supplement). These permanently frozen (permafrost) deposits are of silt- and sand-rich organic-bearing sediments up to tens of meters thick interspersed with large syngenetic ice wedges that contain high amounts of excess ground ice, making them highly sensitive to degradation in a warming climate. Syngenetic ice wedges and segregated intrasedimental ice (ice lenses and bands) constitute the largest portion (50 %–95 %) of this type of deposit by volume in most Yedoma regions (Kanevskiy et al., 2011, 2016; Strauss et al., 2013; Ulrich et al., 2014), next to clastic and organic components (Schirrmeister et al., 2013). Thus, ground ice aggradation is clearly one of the most critical factors in Yedoma Ice Complex genesis (hence also the name “Ice Complex”), and ice forms a main component of the entire deposit, in clear contrast to the accumulation of sedimentary deposits in temperate regions where ice does not play a role either in the formation of deposits or as a structural and stratigraphic component.
In terms of depositional and stratigraphic characteristics, various Yedoma types seem to exist (Kaplina, 1981; Sher et al., 2005; Strauss et al., 2012; Murton et al., 2015) across the area of 1.4×10⁶ km2 where Yedoma deposits currently occur (Strauss et al., 2017). Because of their carbon storage and high ice content, Yedoma deposits have been suggested as a potential “tipping element” for future climate warming (Lenton, 2012). Permafrost models require the parametrization of the types of Yedoma deposits, for example in terms of their grain-size composition, to better constrain factors such as the hydraulic conductivity and pore space volume where water can freeze (Dall'Amico et al., 2011). The estimation of carbon storage potential also seems to be linked with grain-size composition (Palmtag and Kuhry, 2018), making a better granulometric characterization of Yedoma types useful for carbon budget studies.
Most of the studies on Yedoma formation agree that it was dominated by the growth of syngenetic ice wedges in polygonal tundra landscapes during the late Pleistocene (Schirrmeister et al., 2013). The ice wedges formed in low-center polygon nets during the interstadial Marine Isotope Stage 3 (MIS 3) and the stadial MIS 2 promoted by long-lasting continental cold climate conditions with short thaw phases during late Pleistocene summers (for references see Table S1). The widespread formation of ice-wedge polygons in much of Beringia was closely related to the persistence of stable, poorly drained accumulation areas with a low topographic gradient (Schirrmeister et al., 2013).
More debated is the origin of allochthonous clastic Yedoma components. Different hypotheses have been suggested, pointing especially to the role of aeolian processes during Yedoma formation. Studies in Yukon and Alaska interpret Yedoma as loess or retransported loess (“muck”; Péwé, 1955, 1975; Muhs et al., 2008). A range of other hypotheses have emerged to explain the late Pleistocene deposition processes in the Siberian Yedoma region, interpreting the clastic Yedoma deposits as being derived from multiple, rather local sediment sources and transport pathways, as well as from secondary sediment deformation and cryogenic reworking (Schirrmeister et al., 2011, 2013; Siegert et al., 2002) and Cryosol formation (Orthels, Turbels, or Histels; Walter Anthony et al., 2014; Table S1), with an aeolian fraction as one of many components of the sediment material.
Grain-size distributions (GSDs) are known to provide essential information about source-to-sink relations, transport modes, sorting, and depositional processes (Folk and Ward, 1957; Visher, 1969; Sun et al., 2002; Bartholdy et al., 2007; Weltje and Prins, 2007; Dietze et al., 2014; Ulrich et al., 2019). Here, we analyzed (i) to what extent regional- to continental-scale aeolian processes contributed to Yedoma genesis and (ii) what the role of local sedimentation processes was. Assuming rather similar environmental (i.e., land cover) and climatic conditions across the Yedoma region at the time of Yedoma formation during the late Pleistocene, we suggest that Yedoma types and varieties originated in different bedrock and paleotopographic configurations (Table S2). We test this hypothesis by analyzing the GSDs of more than 700 Yedoma samples from across the Arctic in order to identify sedimentological endmembers (EMs) that can be associated with certain depositional regimes. The development of site-specific and region-wide interpretations of Yedoma depositional processes helps to elucidate the typical composition, formation, and transformation conditions of these deposits, which are an important indicator for the late Pleistocene paleoenvironment in Beringia.
2.1 Study region
The nonglaciated lowlands and formerly exposed shelf areas between the Eurasian and Laurentide ice sheets formed a land bridge, commonly named Beringia, between Eurasia and northern America during the late Pleistocene (Hultén, 1937). Study sites in eastern Beringia are situated on the Alaska North Slope with exposures along the Itkillik and Colville rivers, on the northern part of the Seward Peninsula, and in the Vault Creek (VC) tunnel near Fairbanks in Interior Alaska (Fig. 1a, Table S2). In western Beringia, Yedoma exposures and drill cores from numerous coastal and delta sites in the Laptev and East Siberian seas region were studied between 1998 and 2014, mainly along the Laptev Sea and New Siberian Islands coasts (Fig. 1b, c, Table S2). In addition, Yedoma sites were studied in the Yakutian inland, at the key site Duvanny Yar in the Kolyma lowlands, at the Kytalyk site in the Yana-Indigirka Lowland, in the Batagay Mega-slump in the Yana Highlands, and in Central Yakutia (Table 2). All Yedoma deposits that contributed samples to this study were formed during the late Pleistocene MIS 3 and MIS 2 periods (Table S2). Sediments from Holocene ice-wedge polygons from two study areas in Yakutia (Kytalyk, Yana-Indigirka lowland, and Pokhodsk, Kolyma Lowland) were used for comparison as we consider those low-center polygons as final formation areas of the Yedoma Ice Complex (Tables 1, S2).
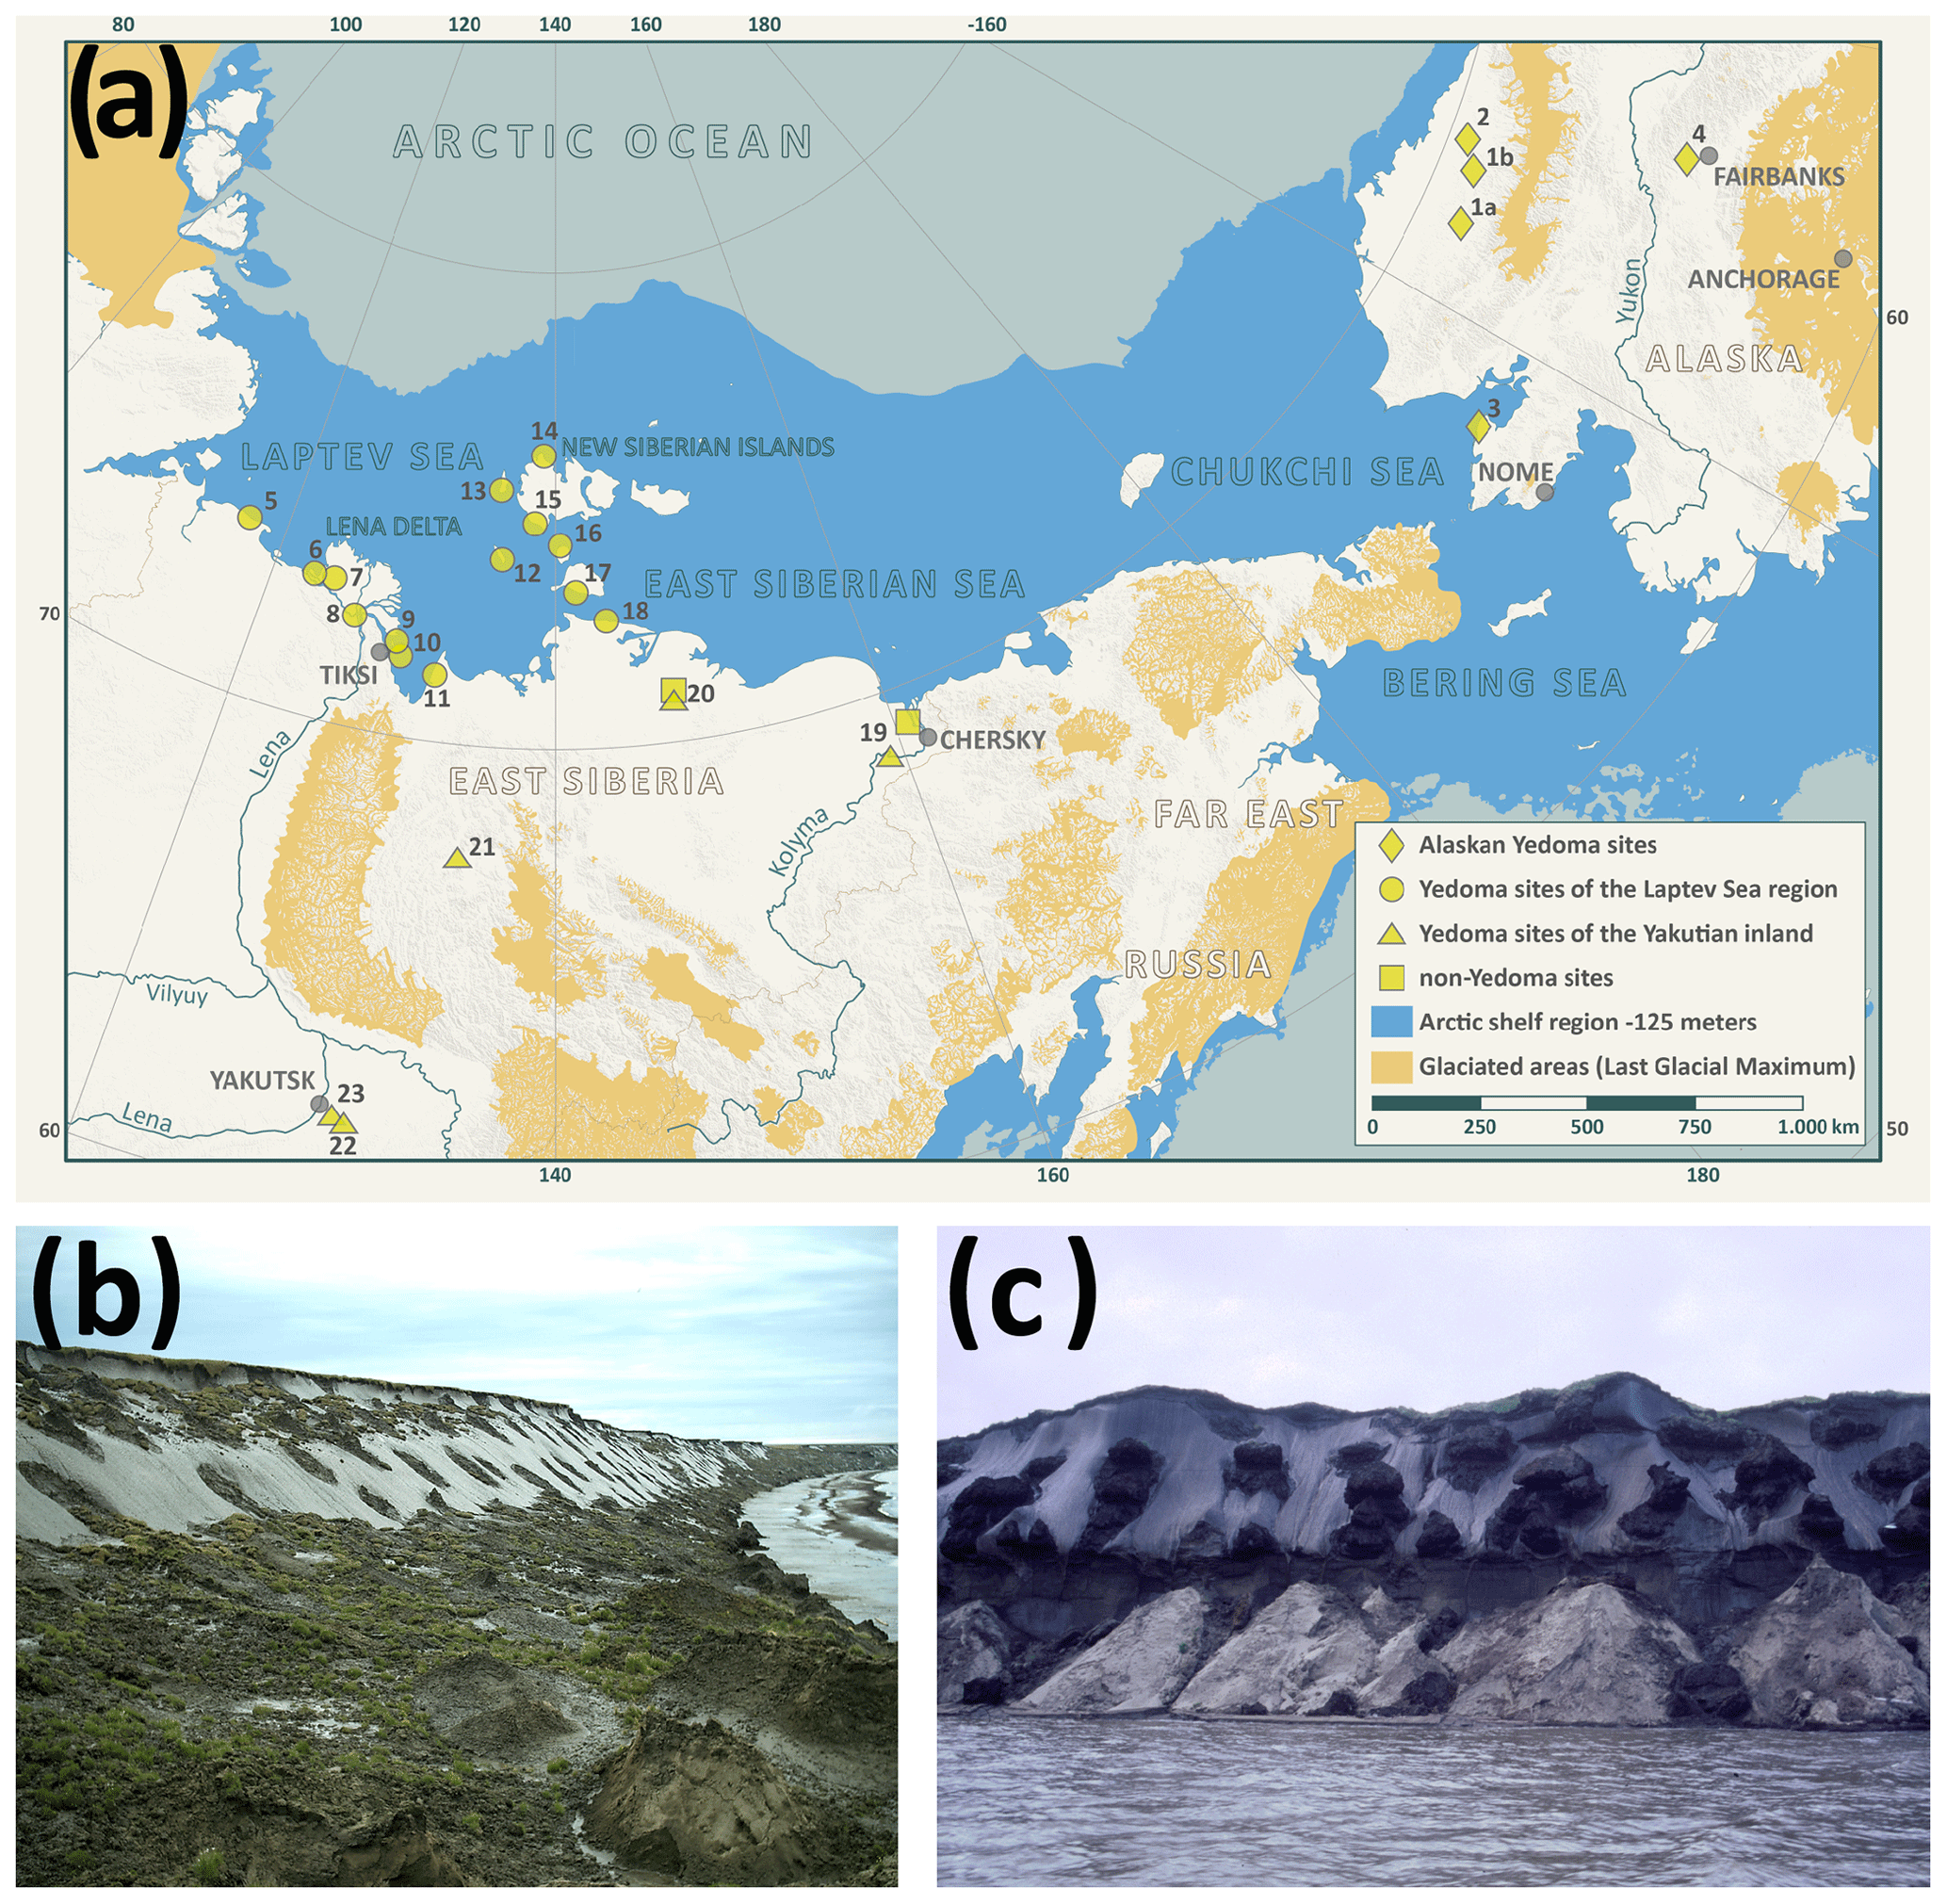
Figure 1(a) Study region showing the distribution of investigated Yedoma sites. Study locations are grouped into three major Yedoma regions: Alaska (diamonds), Laptev and East Siberian sea coasts including the Lena Delta (circles), and the Yakutian inland (triangles). Investigated non-Yedoma sites are also shown (squares). The background map indicates the outline of maximum Last Glacial Maximum areas according to Ehlers et al. (2011) and the subaerially exposed Arctic shelf areas (Beringia) based on a −125 m sea-level lowstand using the bathymetric data from ETOPO2 (2006). Location numbers and additional characteristics are explained in Table S2. Exemplary Yedoma study sites shown are (b) Mamontov Klyk on the western Laptev Sea coast (no. 5 in Fig. 1a) and (c) Kurungnakh Sise Island in the Lena Delta (no. 8 in Fig. 1a).
2.2 Analytical methods
We compiled 671 samples from previous studies and 100 unpublished samples from 23 individual Yedoma locations in Alaska and Yakutia and added 103 samples of 13 drill cores and 57 modern surface sediments from non-Yedoma ice-wedge polygons from five Yakutian sites as references (see Table S2). The modern polygon pond substrate was collected from the uppermost 5 cm at the substrate–water interface. For all Yedoma sites, all available samples from each site were used for the following analysis.
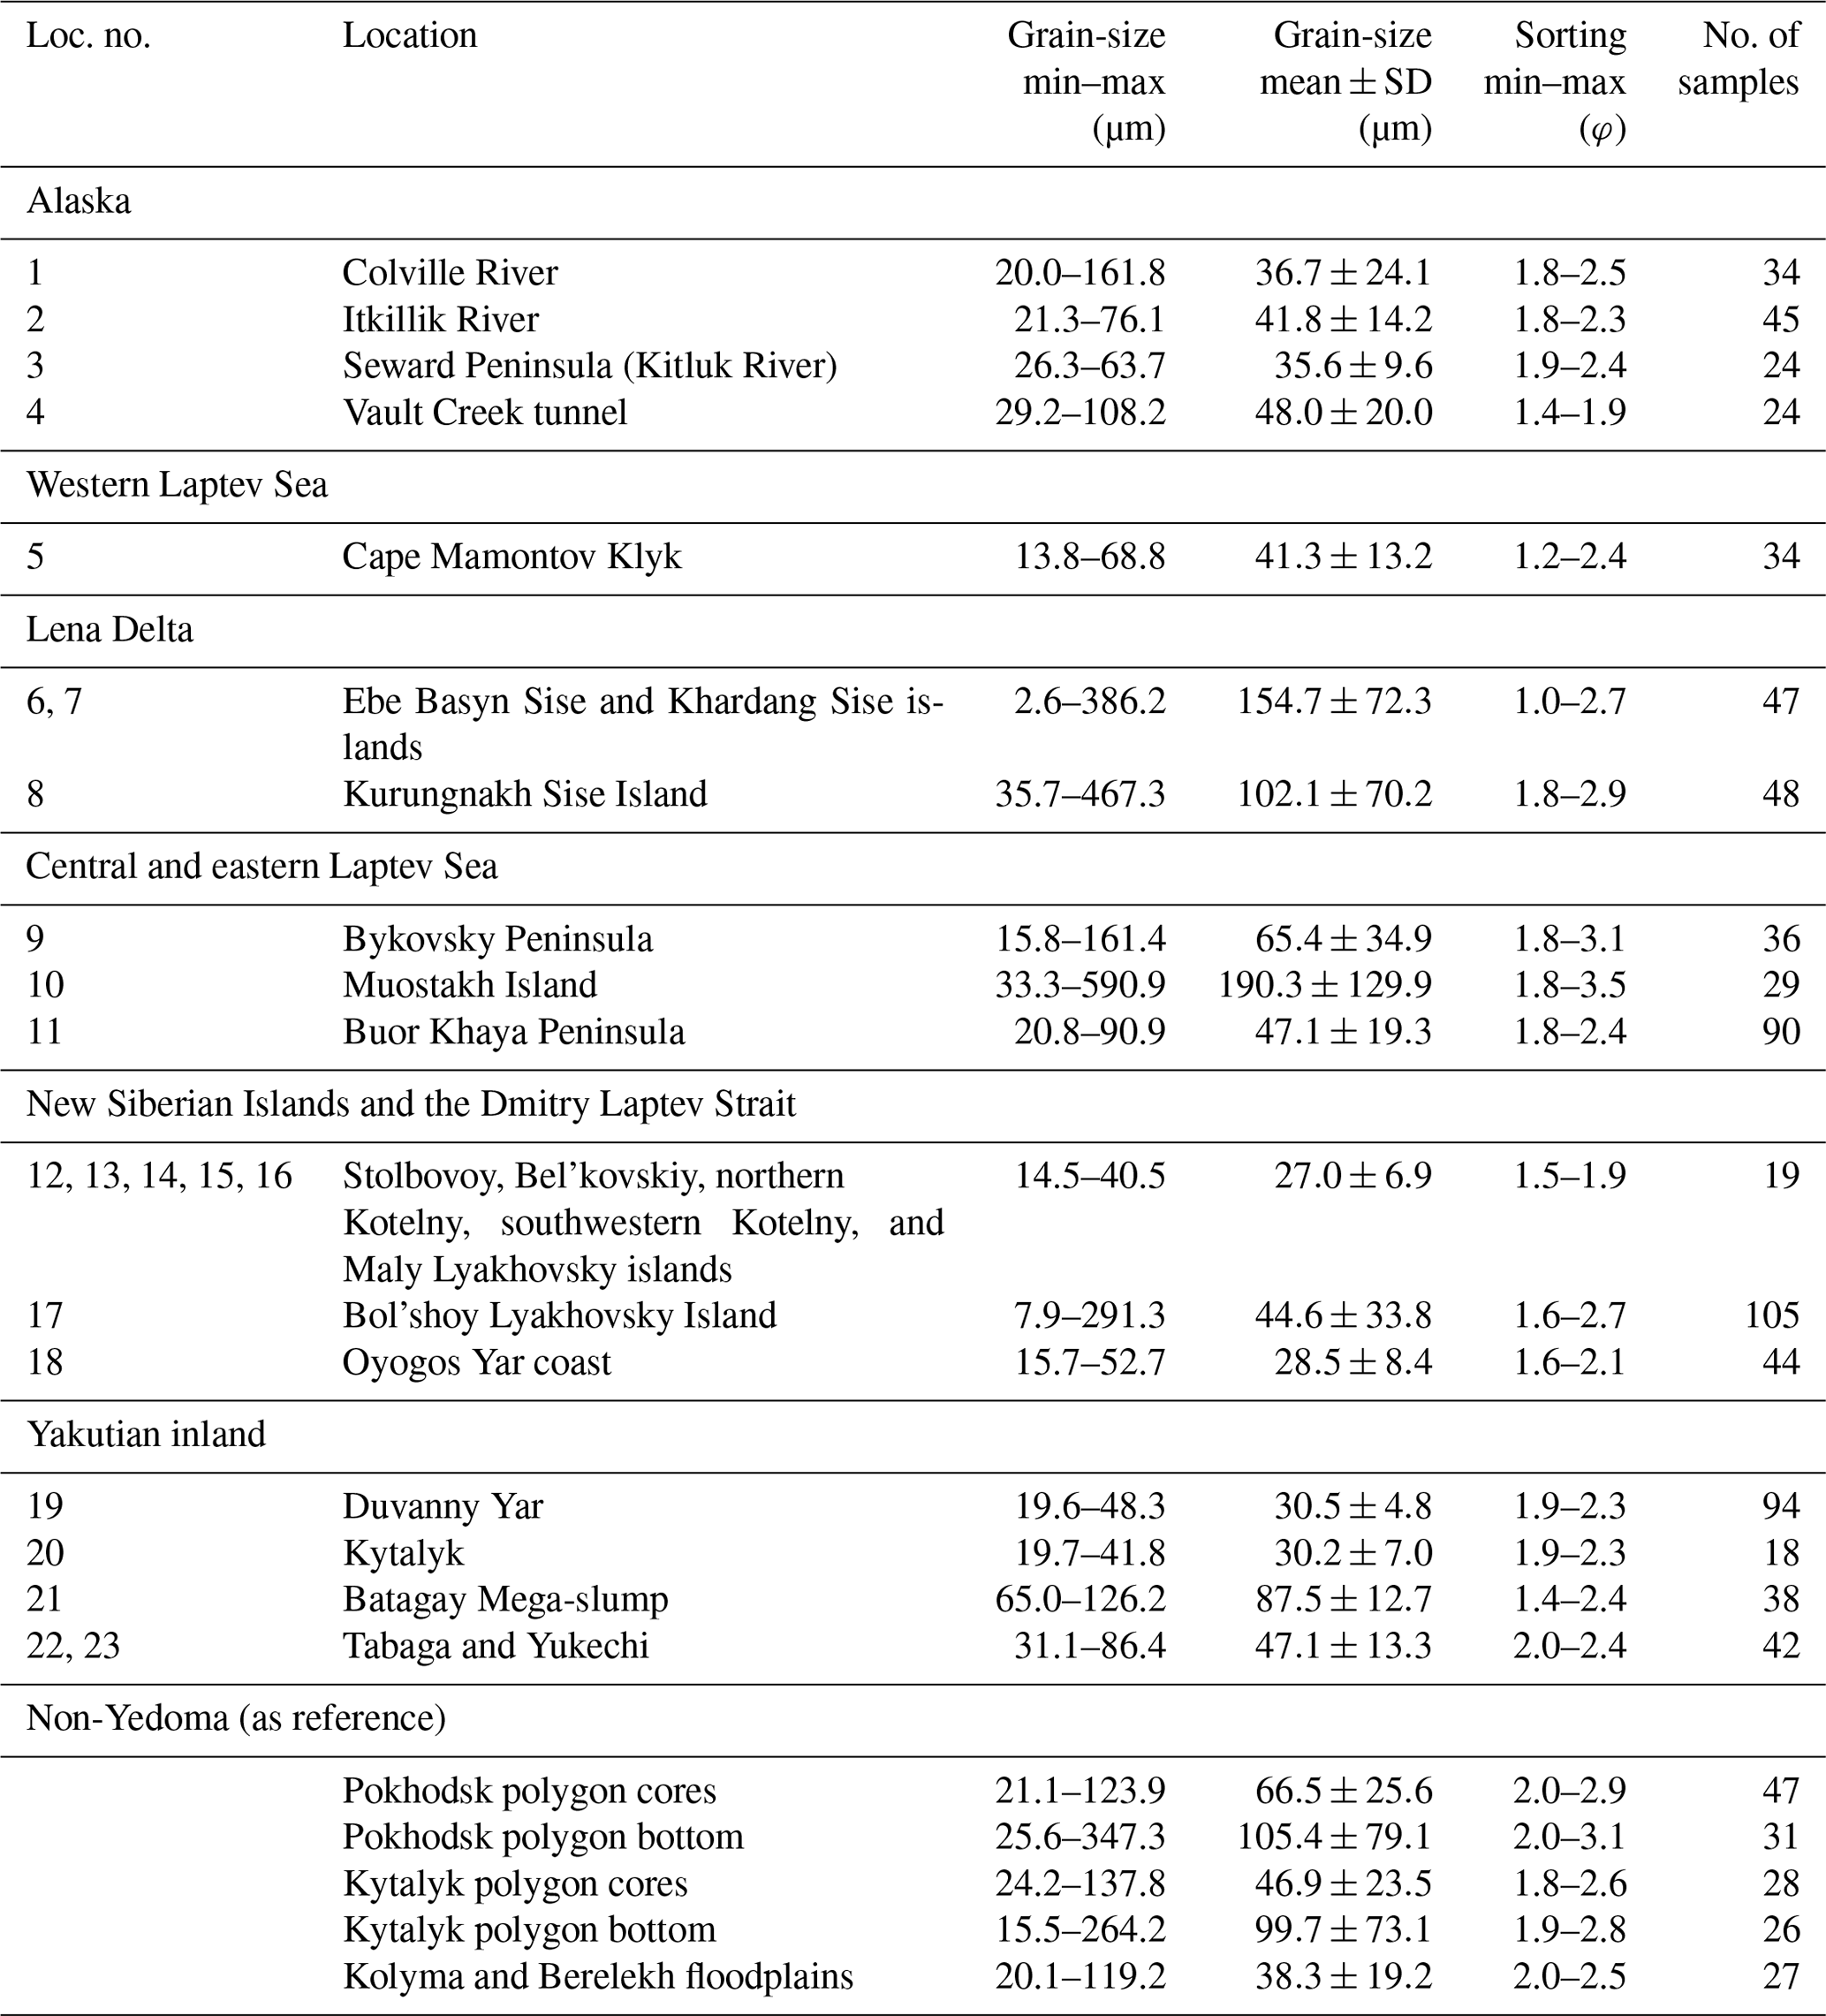
Table 1Grain-size minimum and maximum, arithmetic grain-size mean, sorting, and sample numbers of the collections from the combined 17 Yedoma study sites and the non-Yedoma reference sites.
Sampling and grain-size analysis followed a similar protocol for all samples (see references in Table S2). Frozen sediment samples were taken by hammer and hatchet from outcrops on seashores, riverbanks, and thaw slumps during expeditions. Numerous vertically overlapping subprofiles 1 to 5 m in height were sampled and merged into a combined profile of the site-specific stratigraphy. The correlation of sampling positions was carried out by comparing height measurements using measuring tape or laser theodolite. At VC, Alaska (no. 4 in Fig. 1a), samples were taken in a tunnel with the same approach. In addition, permafrost drill cores from Bol'shoy Lyakhovsky Island (no. 17), Buor Khaya Peninsula (no. 11), and Yukechi (no. 23, Table 1) were taken and later subsampled at a 20 to 30 cm resolution in a cold laboratory in Germany. All samples were freeze-dried in the laboratory, manually homogenized without destroying the particles, and split into subsamples for the various analyses.
For grain-size analysis 5–10 g of a sample was treated three times a week over several weeks with 100 mL of 3 % H2O2 in a horizontal shaker to remove organic matter. The suspension was tested and the pH value adjusted to 6–8. At the end of sample preparation, the samples were centrifuged and dried. Of the dry organic-free sediment samples, 1 g was then dispersed in 1 L of 0.01 normal NH4OH and shaken for about 24 h in an overhead shaker. After that, the sample was split into subsamples to obtain a solid content of 8 %–12 % (sufficient transparency for a laser beam). The subsamples were sieved through a 1 mm sieve to avoid the destruction of the diffraction sample cell by larger particles. There is mostly no, or sometimes a little, content (<1 %) of sieve remains larger than 1 mm. It should be noted that due to the methodical assumption of spherical grains in laser grain-size analysis, the final grain size can sometimes be slightly above the upper limit of 1 mm. Hence, we here consider the GSD up to 2000 µm. Finally, the subsamples were measured in a laser diffraction particle analyzer (Beckman Coulter LS 200) with 92 channel sizes between 0.375 and 2000 µm using the Fraunhofer optical model preprogrammed in the LS 200 analyzer. Three or more subsamples of each main sample were analyzed, and their combined GSD was calculated with the analytical software of the laser diffraction particle analyzer. Grain-size parameters such as sand–silt–clay distribution, arithmetic mean in micrometers (µm), and sorting in phi (φ) were calculated using GRADISTAT 8.0 (Blott and Pye, 2001).
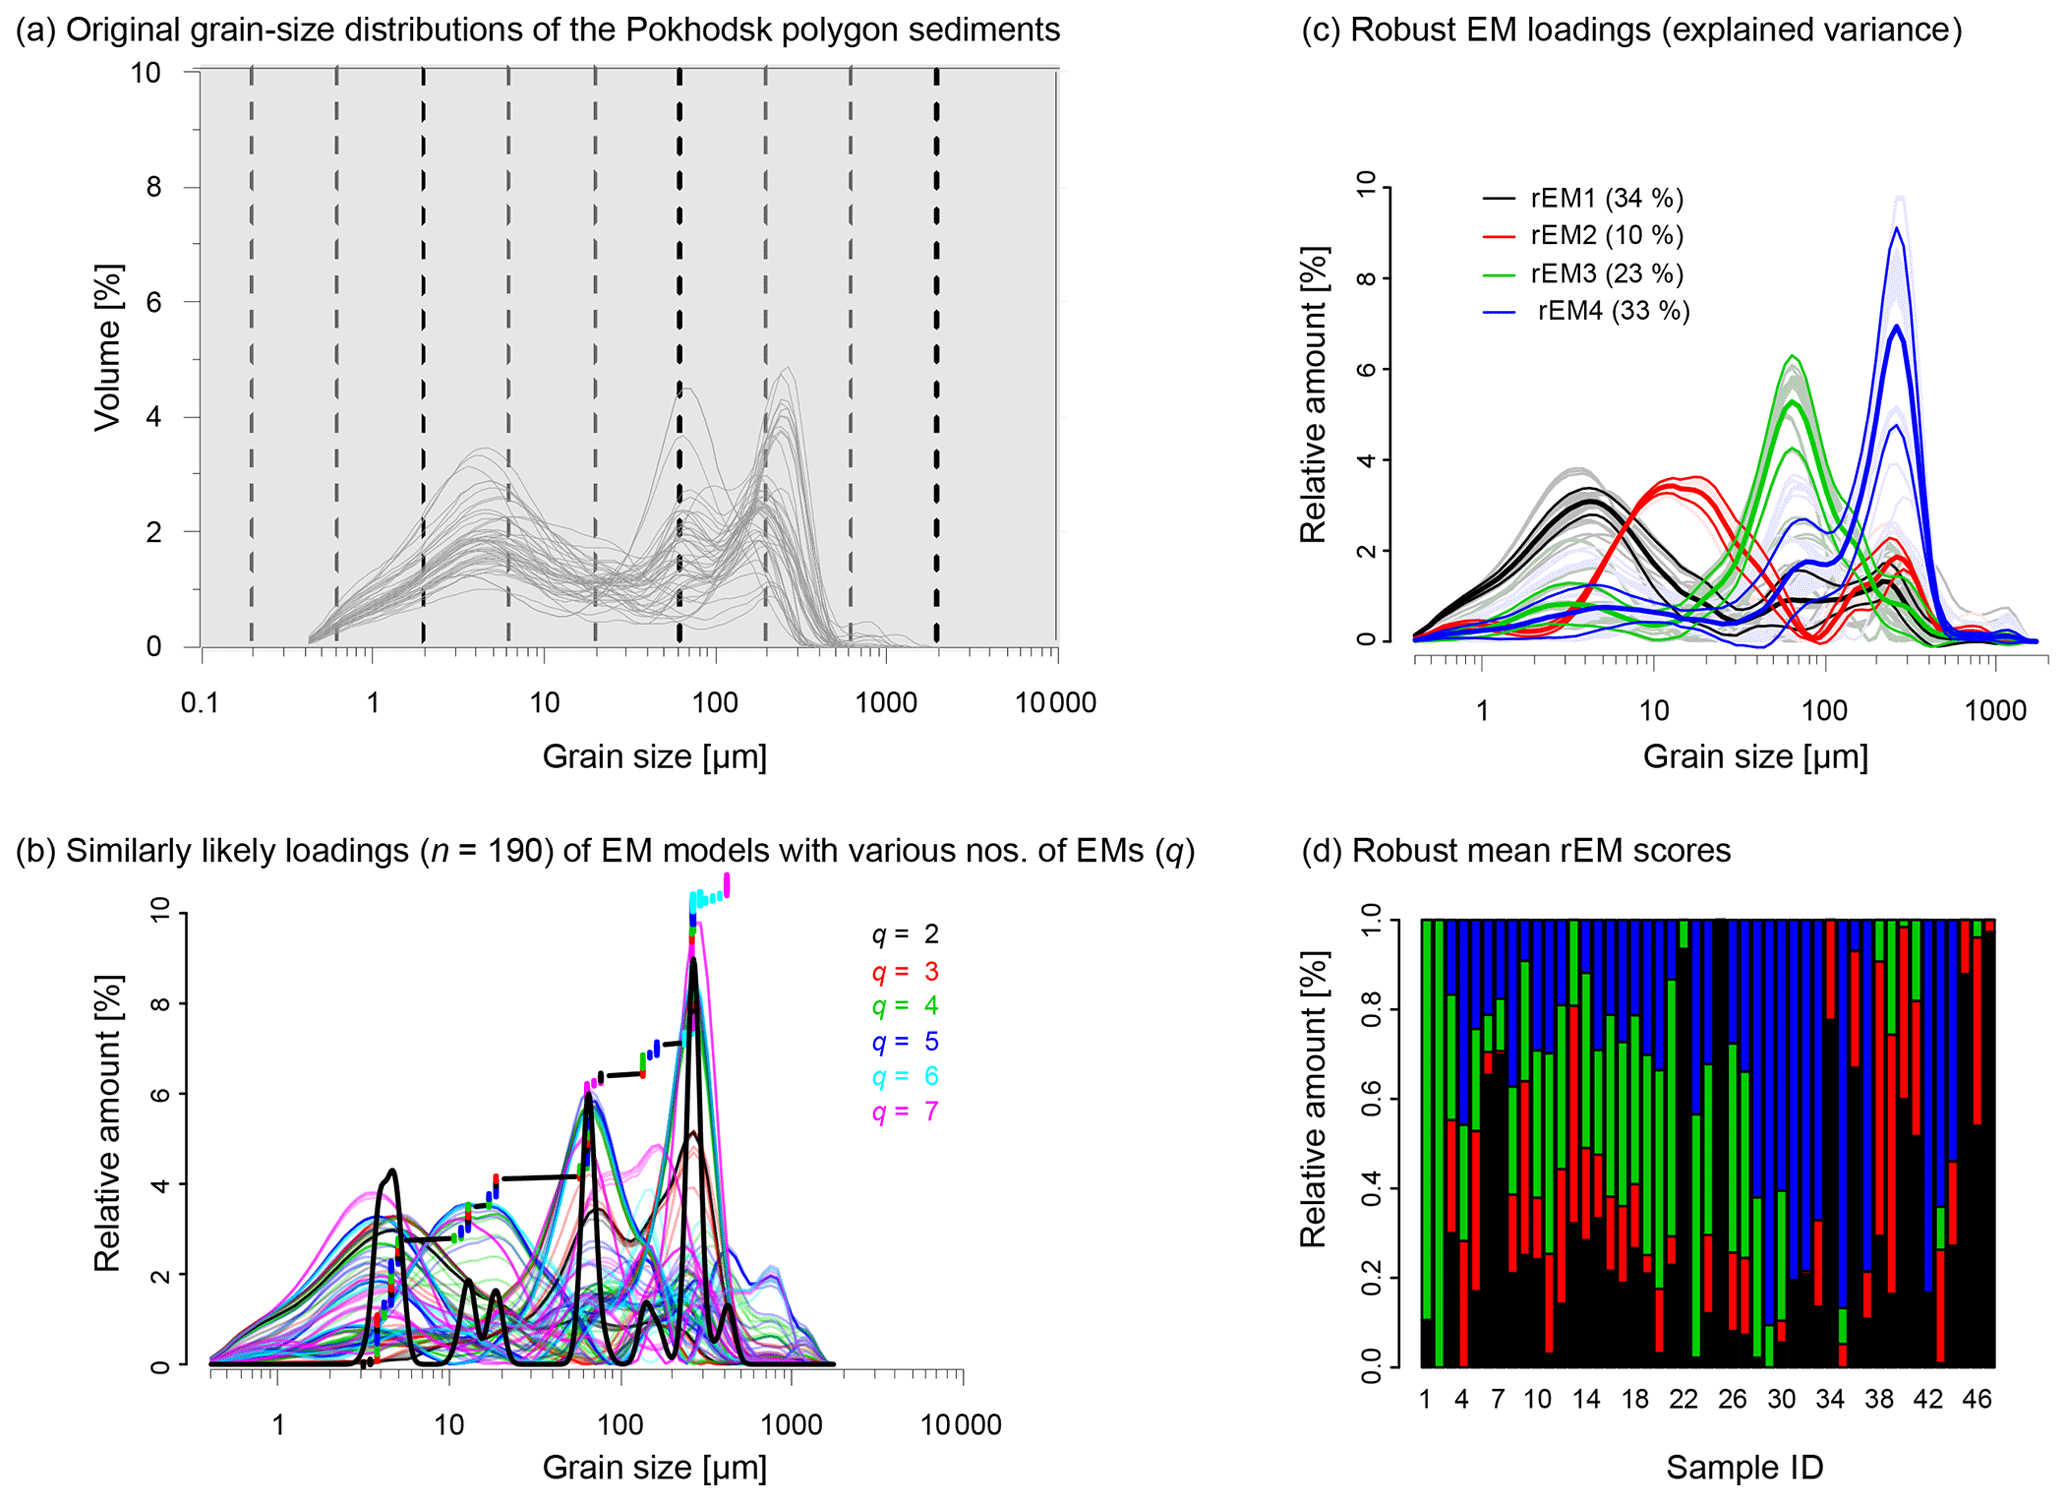
Figure 2Example of grain-size analysis and the different steps of rEM modeling analysis (R package rEMMAgeo; Dietze and Dietze, 2019). (a) All grain-distributions of a site, (b) identification of rEM from all similarly likely endmembers with a >50 % explained variance, (c) mean and 1 standard deviation of rEM, and (d) mean robust scores of respective rEM (more details are explained in the text).
To have a sufficient number of individual samples for further analysis (here, n>15), we combined the 23 studied Yedoma sites into 17 regional groups by merging sites located close together (Table 1). To distinguish characteristic grain-size subpopulations from specific regions and to disentangle formation and transformation processes, we unmixed the polymodal GSDs of each site and the overall record using a robust endmember modeling analysis (rEMMA) run in the open-source R package EMMAgeo following Dietze et al. (2012, 2014) and Dietze and Dietze (2019). A type of eigenspace analysis, rEMMA is similar to principal component analysis but with the capacity to transform the endmember (EM) components so that the loadings can be interpreted as GSDs (see details in Dietze et al., 2012). The scores provide a quantitative estimate of how much an EM contributes to a sample. To obtain a robust estimate of EMs from a measured GSD, several EM models were analyzed with the following steps (see background in Dietze et al., 2012):
-
The ranges of a weight transformation parameter and likely numbers of possible EMs were identified from the measured data set (Fig. 2a).
-
Robust EMs (rEMs) were defined as grain-size subpopulations that appear independent of model parameters. For a number of parameter sets, rEMMA was then performed. All model solutions with an overall explained variance of >50 % were used to determine the rEMs, which consistently appeared among all chosen solutions (with similar main modes and shape, identified in Fig. 2b). An average over all similar EMs was calculated to describe the rEM.
-
An uncertainty estimate for the loadings (contribution of grain-size classes to each rEM) of each mean rEM was calculated from the spread of the modeled rEM loadings (Fig. 2c).
-
Mean scores (Fig. 2d) were calculated for the mean rEM loadings and a weight transformation limit that optimized the explained variance in the data set. The uncertainty estimate for the scores was calculated via a Monte Carlo simulation (see Dietze and Dietze, 2019). From the rEM loadings and scores, variances explained by sample and class were calculated.
To group the study sites further based on the rEM analysis, the rEMs, along with their explained variances, were used for a hierarchical cluster analysis (Anderberg, 1973). The explained variances in the primary modes of all rEMs were summed within nine grain-size classes that contain the most common rEM modes (see rEMMA results below) into coarse sand (>750 µm), medium sand (281–750 µm), fine sand (101–280 µm), coarse silt (51–100 and 28–50 µm), medium silt (12–27 µm), fine silt (8–11.9 µm), very fine silt (4–7.9 µm), and clay (<4 µm). As the explained variances represent the fraction of a certain rEM for a specific site, a chi-square distance measure was used; distances dij between two sites i and j were determined using the following formula:
where exvar(EMk(i)) is the explained variance in the kth rEM of site i. The clustering method used was “complete”, meaning after the creation of a new cluster, distances to the remaining clusters were calculated using the larger of both original distances. The bootstrapping approach from the R package pvclust (Suzuki and Shimodaira, 2006) was used to assess the significance of possible clusters. Using this method supplied probabilities for each edge in the cluster dendrogram, allowing the choice of statistically certain clusters. The package supplies a basic bootstrapping probability significance value and a corrected approximately unbiased significance value, which we used to assess the statistical significance of the cluster edges and to determine the significant clusters.
In addition to cluster analyses, we combined the studied Yedoma sites into three spatially explicit regions for Arctic-wide comparisons: (1) Alaska; (2) the Laptev and East Siberian sea coasts, including the Lena Delta; and (3) the Yakutian inland.
3.1 Results of classical grain-size analyses
GSD curves of Yedoma sites reflect strong regional heterogeneity. The sand–silt–clay diagram of all studied samples (Fig. 3) shows the various compositions of the Yedoma sequences. The studied Yedoma deposits consisted mostly of poorly to very poorly sorted material with maxima in the silt and fine sand fractions (Table 1), with a certain proportion of the clay fraction. In addition, coarse sand and gravels were also observed in the field. Most sites are silt-dominated, but sites in the Lena Delta and on the Laptev Sea coast are sand-dominated.
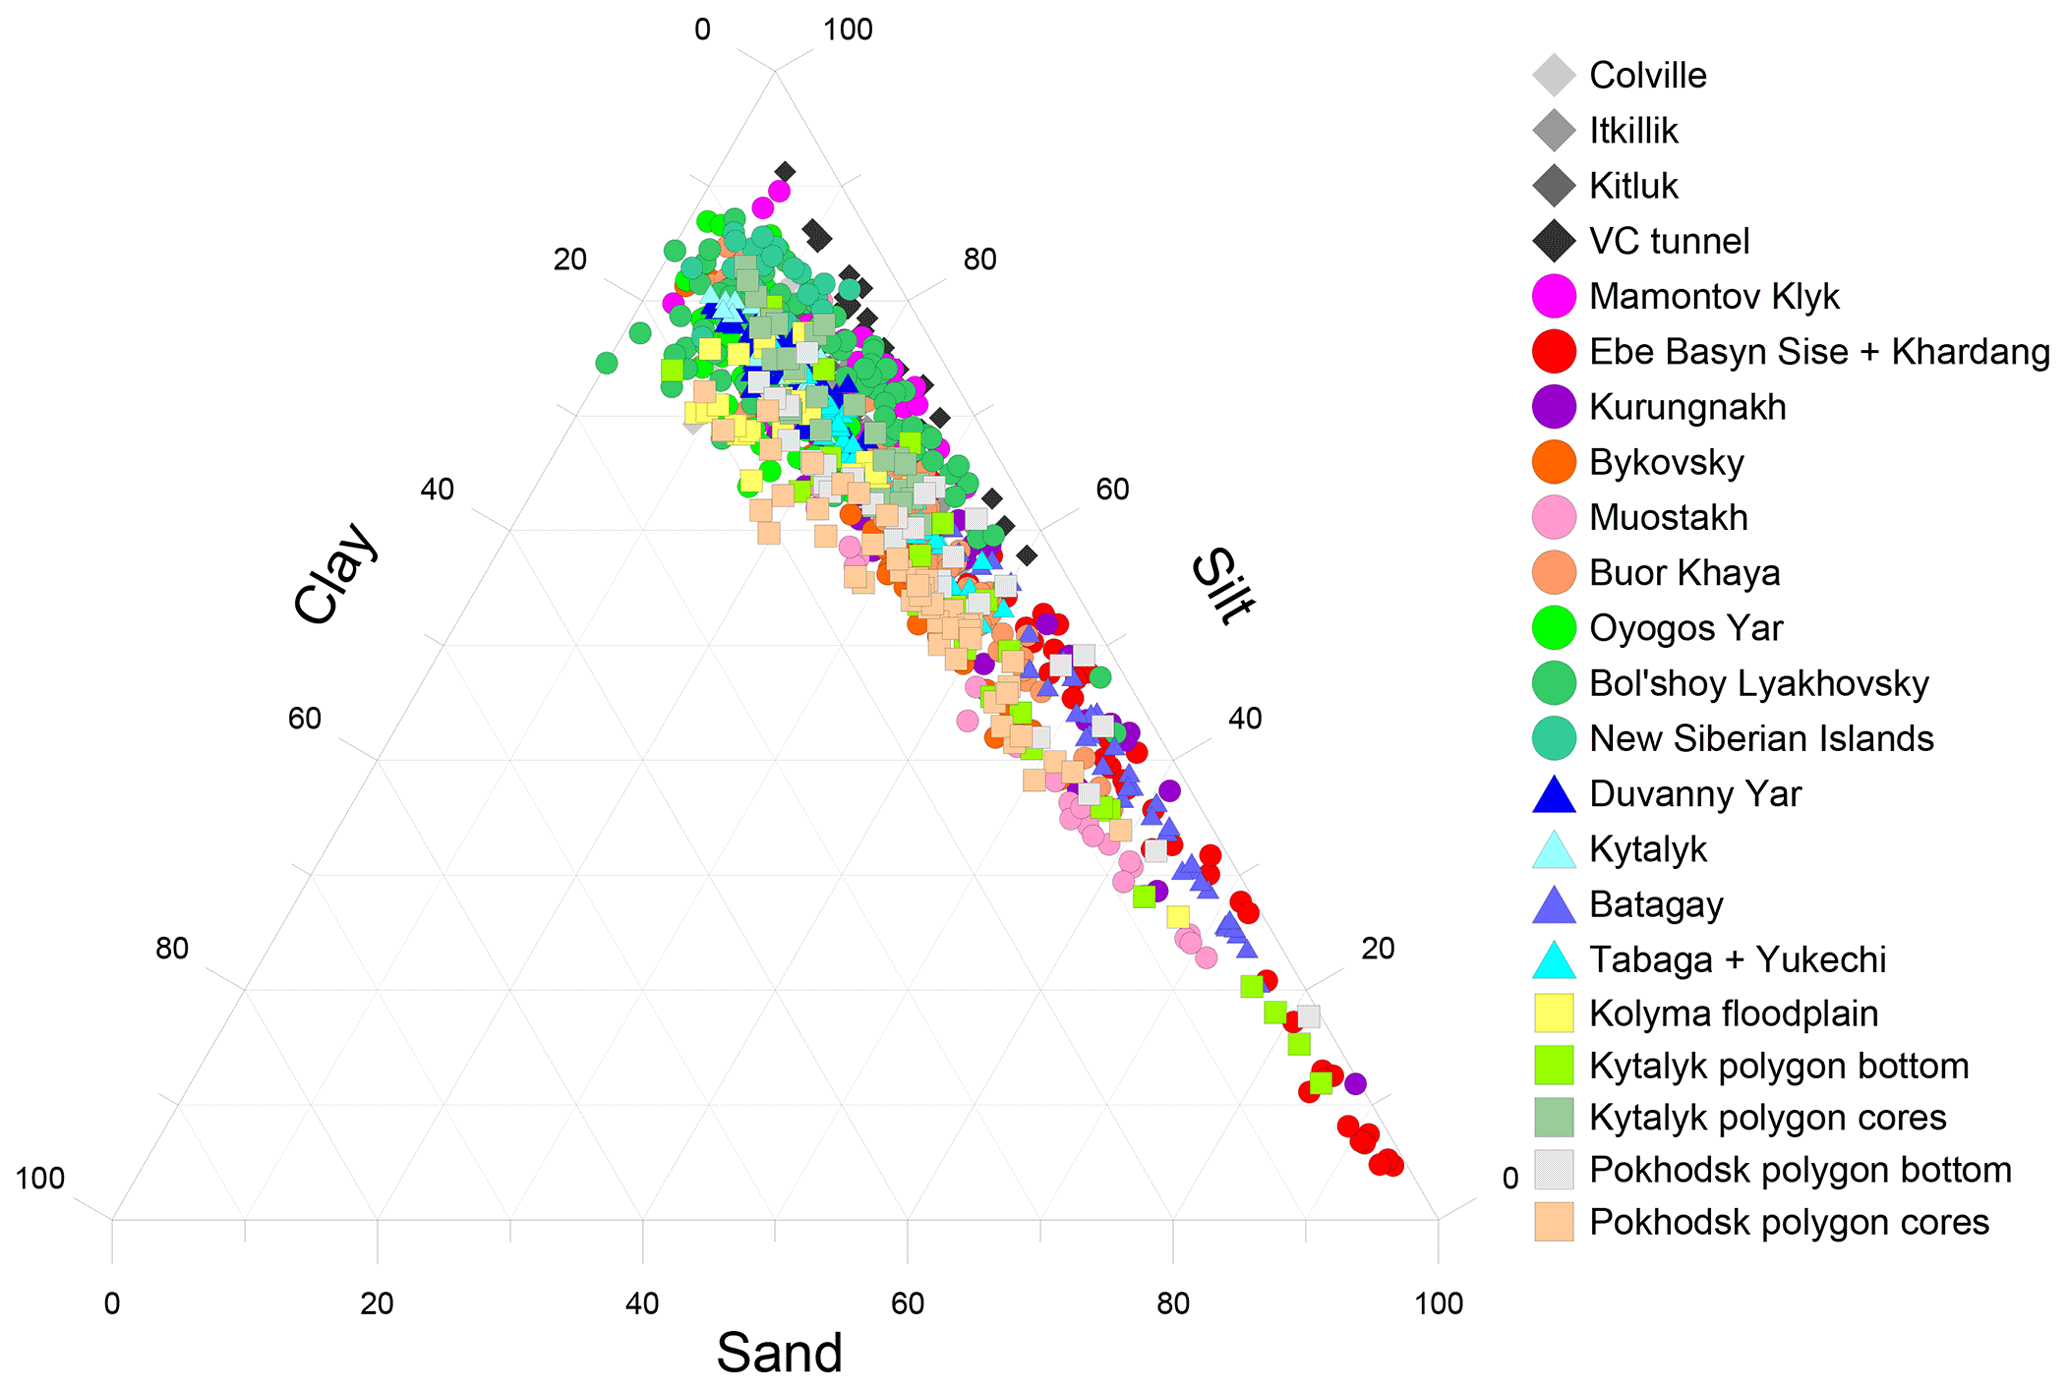
Figure 3Sand–silt–clay diagram of the Yedoma sites in Alaska (diamonds), on the Laptev Sea and East Siberian Sea coasts including the Lena Delta (circles), and in the Yakutian inland (triangles) and non-Yedoma sites (squares).
The Colville site (Fig. S3.1a in the Supplement) on the Alaska North Slope is characterized by uni-, bi-, tri-, and polymodal distributions of poorly to very poorly sorted mud to medium sandy silt (Fig. S4.1). The Itkillik site exhibits bi-, tri-, and polymodal distributions of coarse silt to fine sandy coarse silt. The VC tunnel Yedoma site near Fairbanks shows mostly unimodal and sometimes bi- and trimodal distributions of poorly sorted coarse silt to very fine sandy coarse silt. The Kitluk site on the Seward Peninsula contains sorted to very poorly sorted very fine sandy coarse silt that is uni-, bi-, tri-, and polymodally distributed.
The Yedoma sites on the coasts of the western and central Laptev Sea as well as in the Lena Delta (Fig. S3.2) all show a wide range of GSDs including uni-, bi-, tri-, and polymodal curves (see examples in Fig. 4a). The sorting and the prevalent particle sizes, however, differ from site to site. The Mamontov Klyk site on the western Laptev Sea coast is characterized by poorly to very poorly sorted medium silt to very fine sandy coarse silt. The Ebe Sise (Nagym) and Khardang Sise Lena Delta sites are composed of moderately to very poorly sorted clay to fine sand. The Kurungnakh Lena Delta site is characterized by poorly to very poorly sorted fine sandy coarse silt to coarse silty medium sand. The Bykovsky site includes sorted coarse silt to coarse silty fine sand. The adjacent Muostakh site has the widest range in GSD of poorly to very poorly sorted fine sandy coarse silt to fine silty coarse sand. The Buor Khaya site contains poorly to very poorly sorted coarse silt to fine sandy coarse silt.
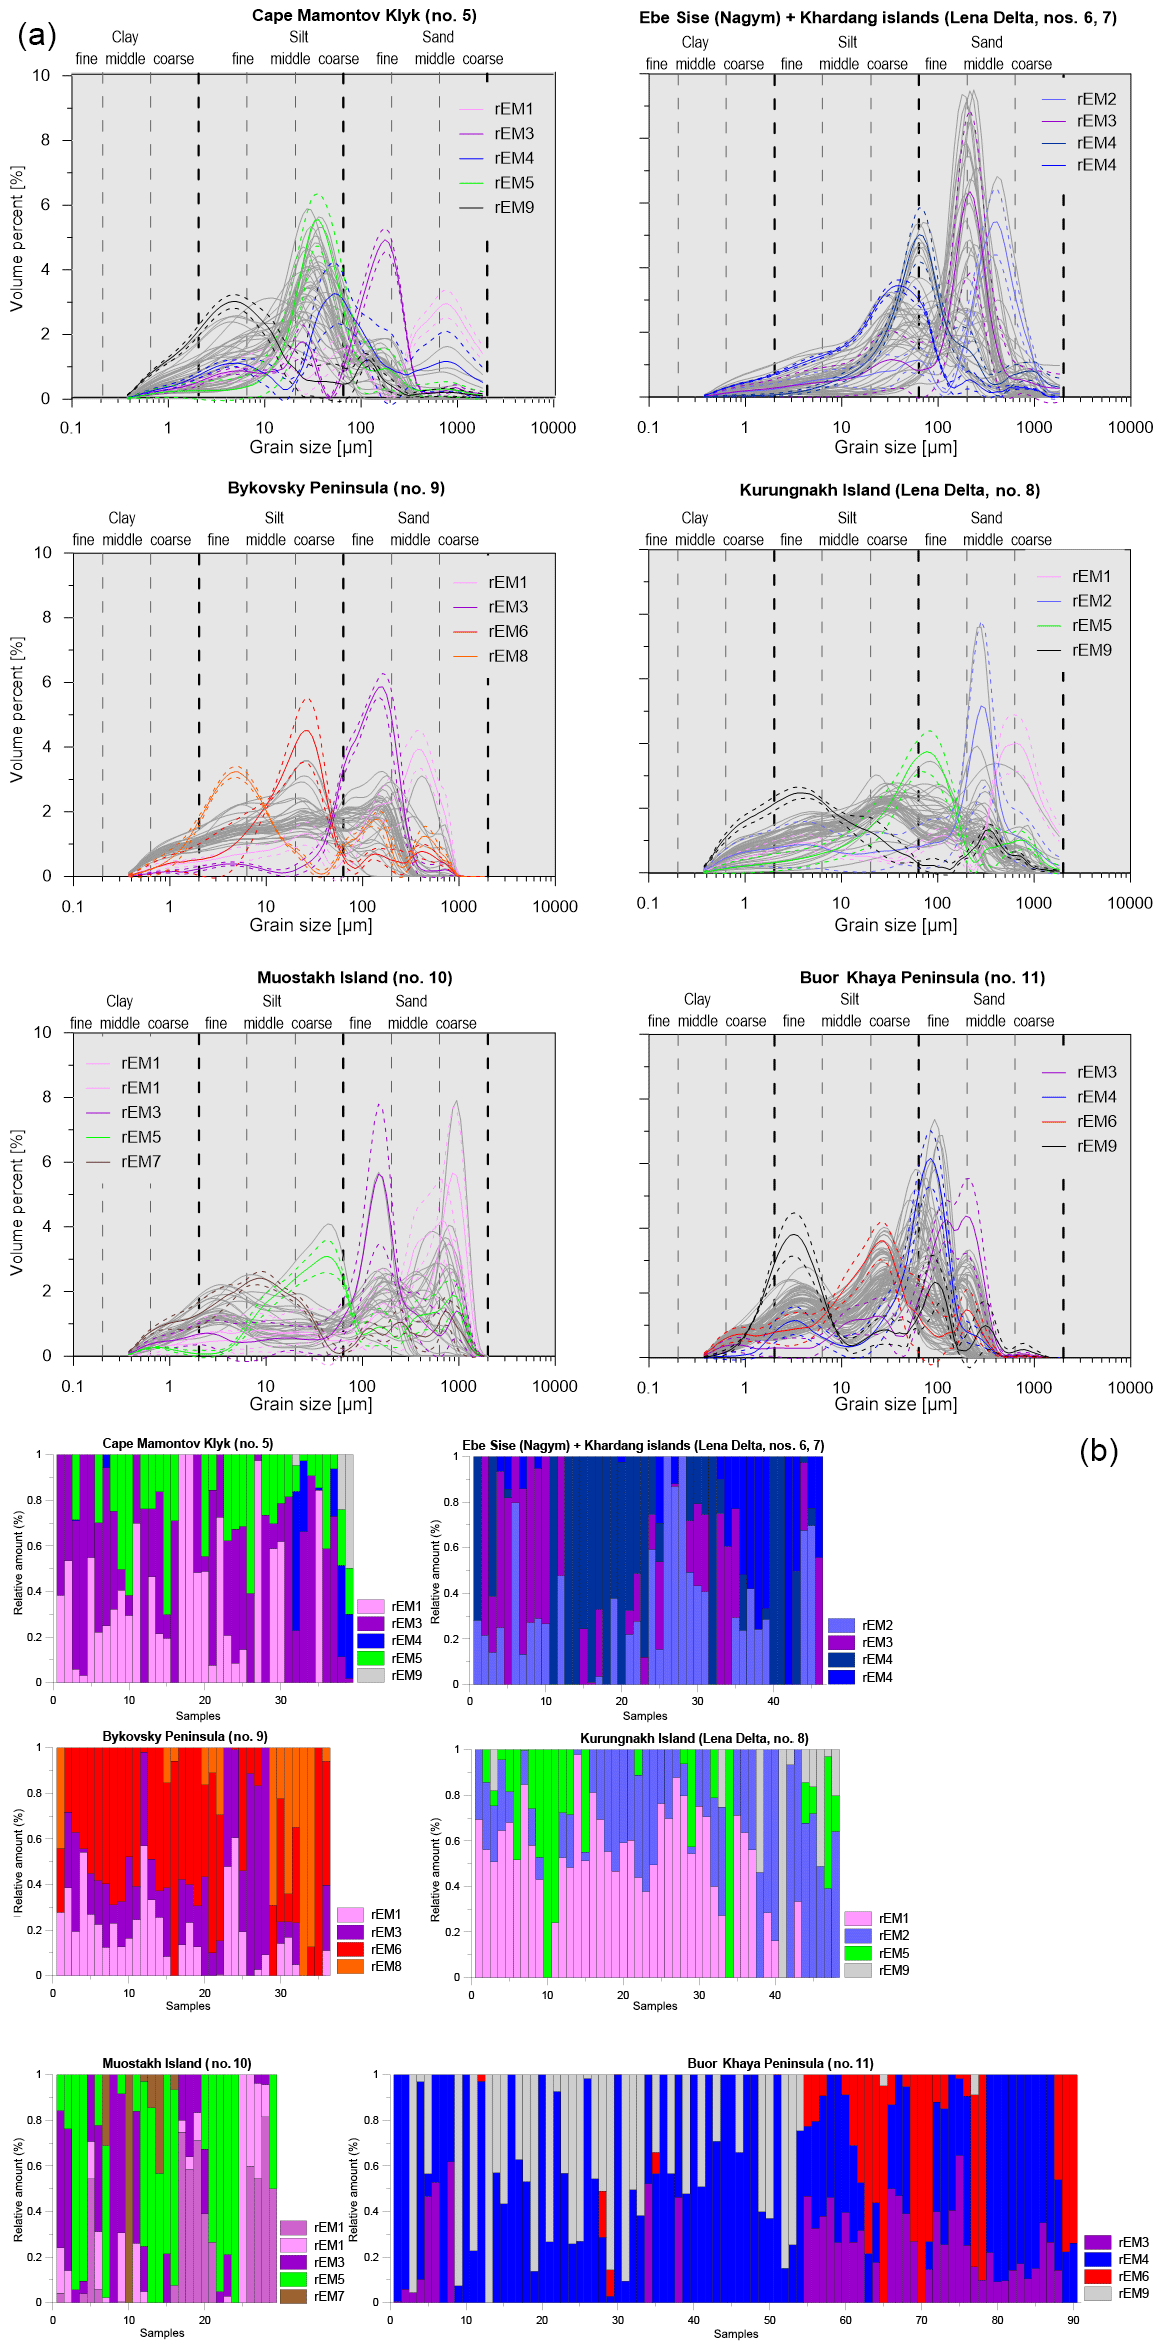
Figure 4(a) Examples of GSD curves and rEM modeling from six sites on the Laptev Sea coast and from islands in the Lena Delta. The GSD diagrams reflect different curves for each site. GSD curves from all studied Yedoma sites and non-Yedoma reference sites are given in Figs. S4.1–4.5 (sediment nomenclature according to Blott and Pye, 2001). The rEM modeling shows a great variety with four to five different rEMs. The dotted lines show the standard deviation for each rEM. Grey lines show original GSDs. The EM modeling results for all study sites are also shown in Figs. S4.1–4.5. (b) Examples of the mean scores (i.e., the relative contribution of a rEM to each sample) for the Laptev Sea coast and the Lena Delta sites. Please note, for better comparability, scores are plotted in the same stratigraphic order, i.e., from top (left) to bottom (right). The mean score results for all study sites are shown in Figs. S5.1–5.5.
The Yedoma sites of the New Siberian Islands are uni- to bimodally distributed poorly sorted fine silt to fine sandy coarse silt (Fig. S4.3). The largest data set from Bol'shoy Lyakhovsky Island is characterized by uni-, bi-, tri-, and polymodal distributions and poorly to very poorly sorted fine silt to coarse silty coarse sand. The Oyogos Yar site located on the opposite side of the Dmitry Laptev Strait is composed of uni-, bi-, tri-, and polymodal poorly to very poorly sorted coarse silt to fine sandy coarse silt.
3.2 Results of site-specific endmember modeling analyses
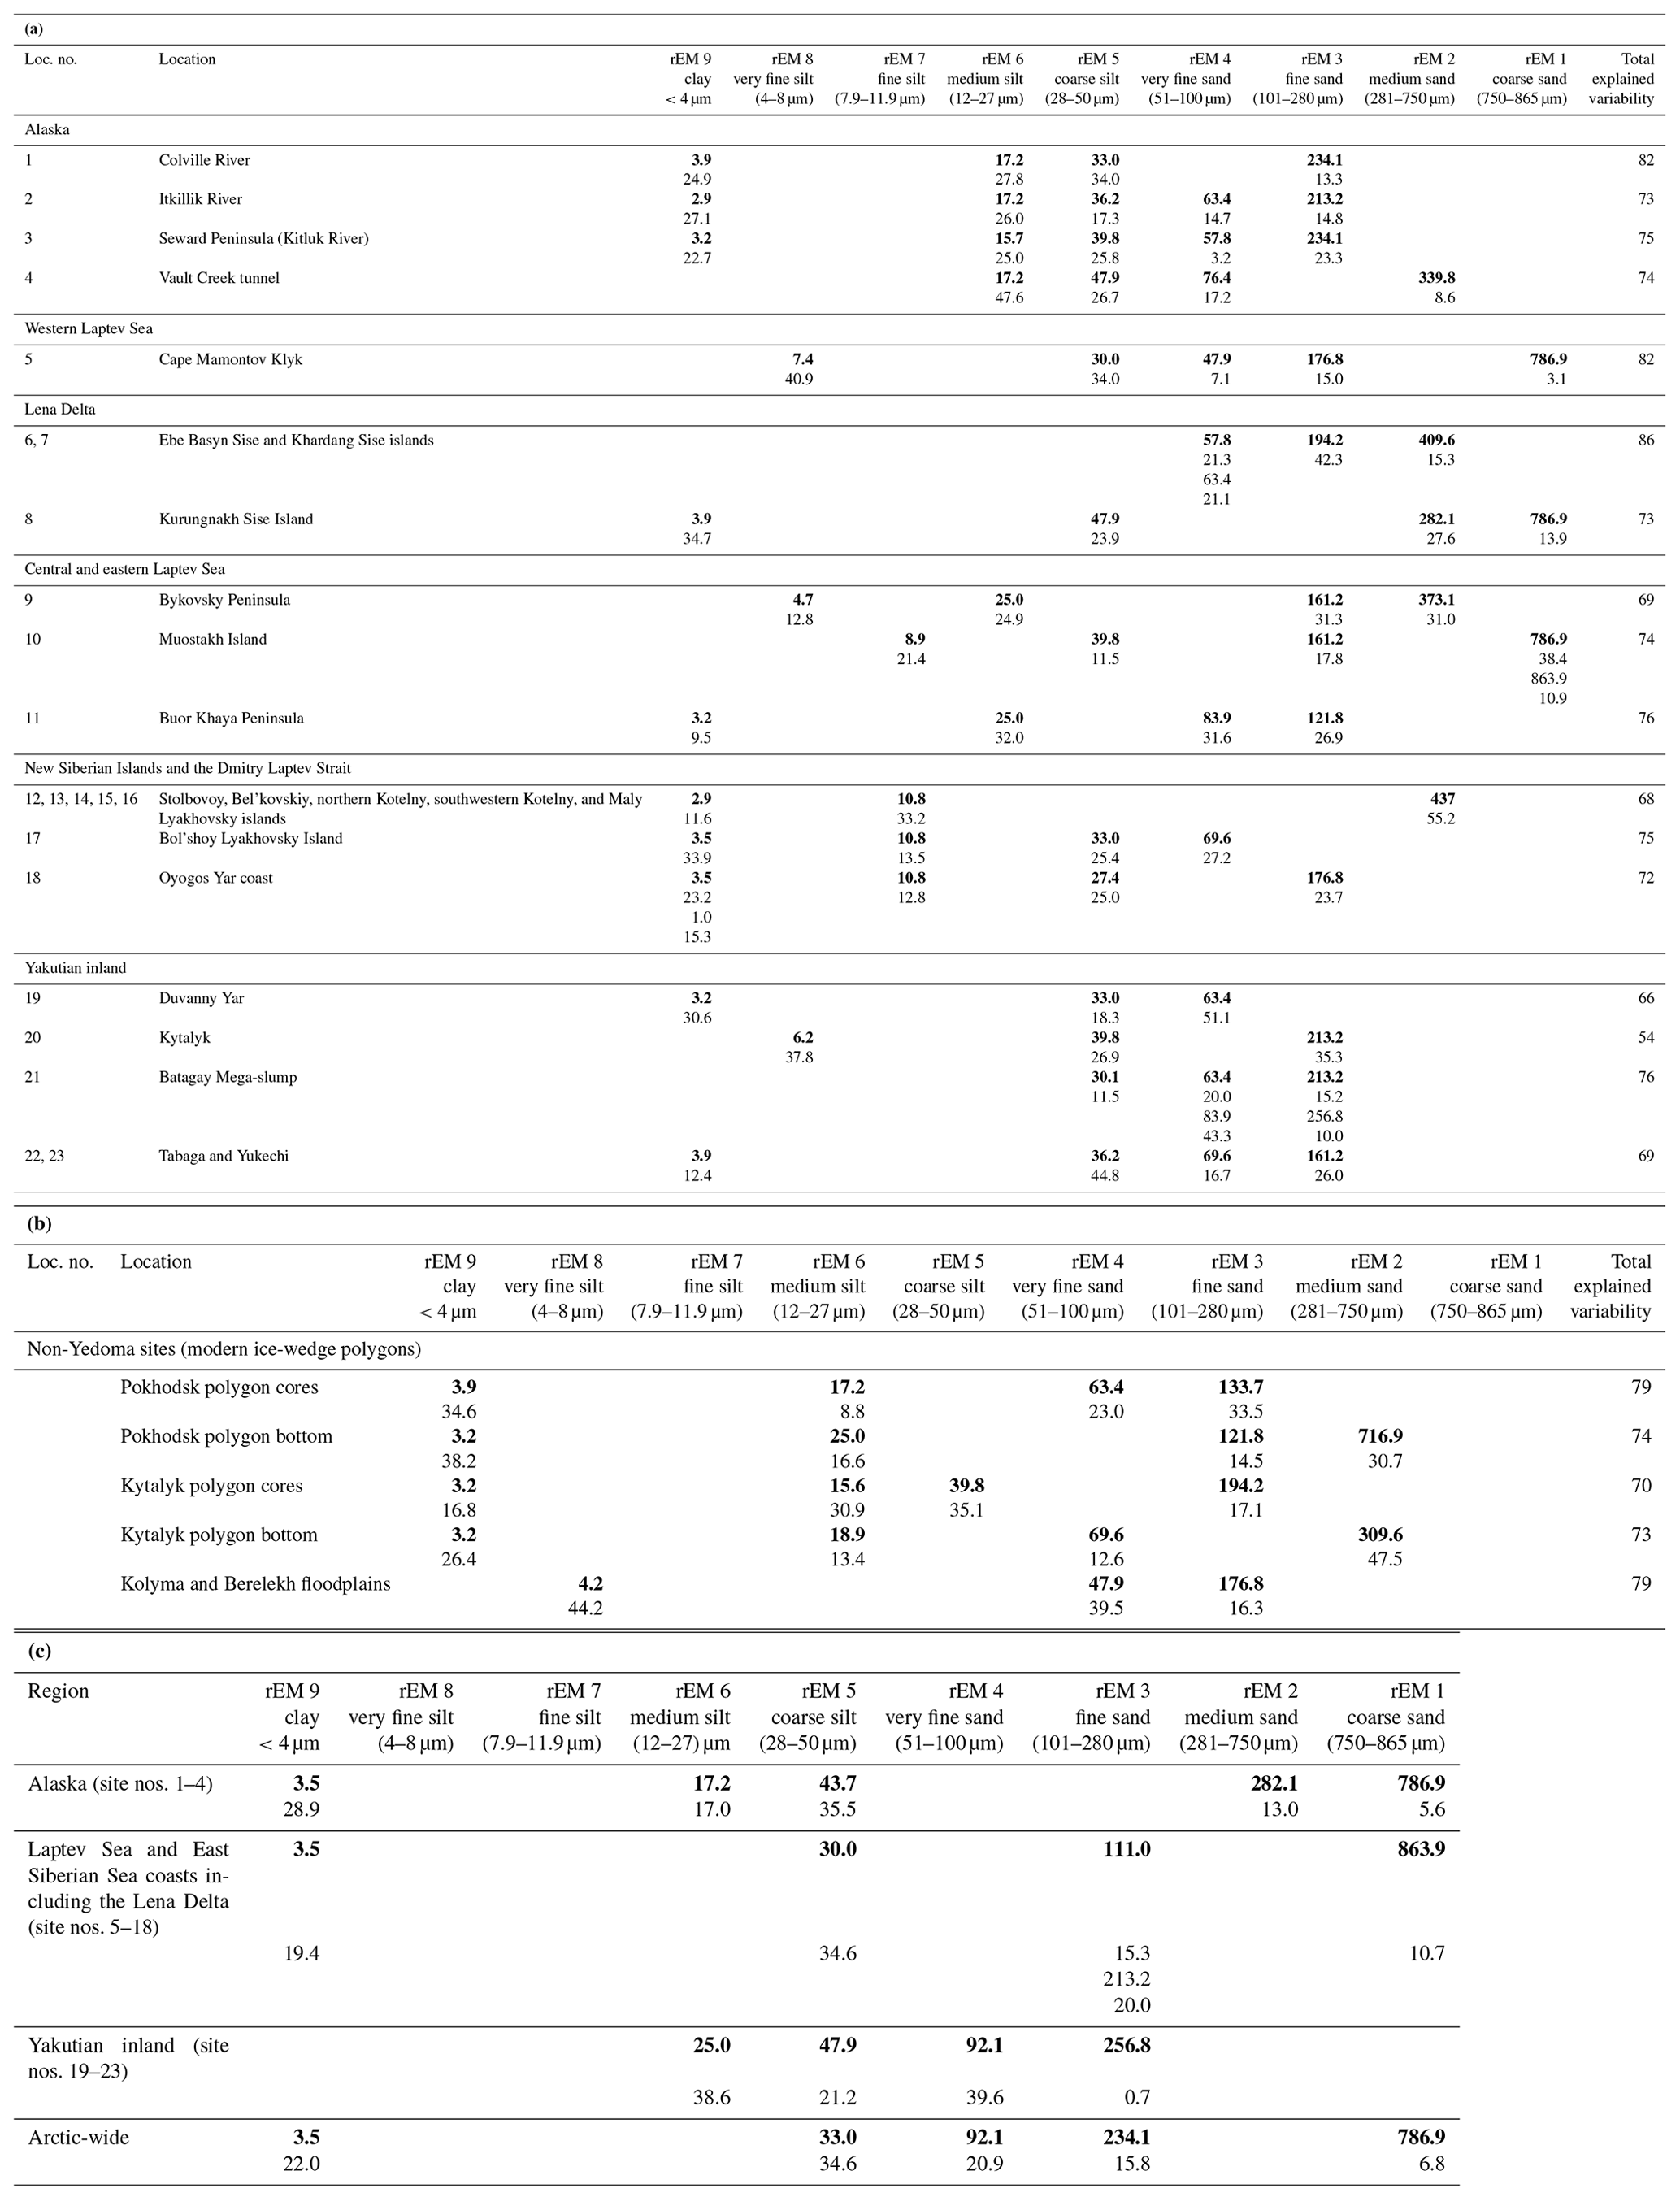
The rEMMA method was applied to data sets of each site separately. Main modes of rEMs, their explained variances, and the total grain-size variability explained by the average robust model for each study site are presented in Table 2 and Figs. 4 and S4.1–S4.5. Each data set can be described by different numbers of rEMs with modes in various grain-size fractions between clay, fine silt, and coarse sand fractions (rEM 9=1.0 µm from Oyogos Yar to rEM 1=863.9 µm from Muostakh Island; Fig. 4a). Across all sites, the mean of the robust models explains between 54 % and 85.5 % of the total grain-size variability in the 17 studied data sets (Table 2). The non-Yedoma ice-wedge polygons have similar distributions, from the clay fraction (rEM 9=3.2 µm) to the coarse sand fraction (rEM 1=716.9 µm; Table 2b, Figs. S4.5, S5.5).
Table 2(a) Main modes of robust grain-size EMs (µm, bold), their explained variances (%, below mode), and the total grain-size variability (%) explained by the average robust model for each study site (see also Figs. 1, 4a, and S4). (b) Main modes of robust grain-size EMs (µm, bold), their explained variances (%, below mode), and the total grain-size variability (%) explained by the average robust model for non-Yedoma sites of modern ice-wedge polygons (see also Figs. 1, S4.5). (c) Robust grain-size EMs (in micrometers of main mode, bold) and respective explained variances (%, below mode) in regional and Arctic-wide combinations (see also Fig. S6.1).
In 4 out of 17 sites (Seward Peninsula, New Siberian Islands, Duvanny Yar, Kytalyk), only three rEMs contribute to the grain-size variability, whereas the sites from the Laptev Sea coast and the Lena Delta are composed of four to five rEMs. Figure 4a shows examples of the rEM loadings and the original GSDs from the Laptev Sea coast and the Lena Delta. The rEM modeling results for all study sites, shown in Figs. S4.1–S4.5, 4b, and S5.1–S5.5, present the mean scores, i.e., the relative contribution of a rEM to each sample. The mean scores of the studied sample sets show the internal variability in the composite Yedoma profiles or Yedoma sequences taken from different sites along riverbank and coast segments.
Coarse sand rEMs (rEM 1; between 750 and 865 µm, explained variance 3.1 % to 38.4 %) were calculated for three sites (Table 2a, Fig. 5) in the Laptev Sea region. Medium sand rEMs (rEM 2) between 280 and 750 µm (explained variances 8.6 % to 31.0 %) occurred at one site in Alaska, on two islands in the Lena Delta, and at one site on the eastern Laptev Sea coast (Table 2a, Fig. 5). Fine sand rEMs (rEM 3; 101–280 µm) are present in all regions (Table 2a, Fig. 5), e.g., forming the coarsest grain-size components at two sites in Alaska, at two sites in Central Yakutia, and on the Oyogos Yar coast.
Two or three rEMs out of all rEMs are in the silt range. Several rEMs with main modes in the coarse silt to very fine sand range that we have grouped into two main rEMs – rEM 4 (51–100 µm) and rEM 5 (28–50 µm) – occur in most of the sites. These size classes constitute the finest and second-finest rEMs of the combined Ebe Basyn Sise and Khardang Sise islands regional group (i.e., main mode at 57.8 µm). These rEMs have the highest explained variances in the Yakutian inland (Table 2a, Fig. 5).
Medium silt rEMs (rEM 6; 12–27 µm) explain variance of 11.5 % to 47.6 % of eight sites in the three regions (Fig. 5).
Fine silt rEMs (rEM 7) between 8 and 11.9 µm (explained variance 13.5 % to 33.2 %) are calculated for four sites but not in the Yakutian inland. Very fine silt rEMs (rEM 8) between 4 and 7.9 µm (explained variance 12.4 % to 37.8 %) occur at six sites (Table 2a) throughout the study regions. The clay rEMs (rEM 9) between 1 and 4 µm (explained variance of 9.2 % to 33.9 %) are present at seven sites (Table 2a); the finest rEM, with a main mode at 1 µm, occurs on the Oyogos Yar coast.
The reference sites of non-Yedoma ice-wedge polygons have clay (rEM 9) and very fine silt (rEM 8) with explained variances between 16.8 % and 44.2 %, fine to coarse silt (rEMs 7 to 5) with explained variances of 8.8 % to 35.1 %, and very coarse silt to coarse sand (rEMs 4 to 2) with explained variances of 12.6 % to 47.5 % (Table 2b, Fig. 5).
3.3 Results of regional and Arctic-wide endmember analyses
The rEMs of the regional aggregation of sites as well as the rEMs from all Arctic-wide sites are presented in Table 2c and Figs. 5, S6.1, and S6.3 (see scores in Figs. S6.2 and S6.3). They show that very fine silt rEMs exist in Alaska and the Laptev and East Siberian seas region but not in the Yakutian inland. Fine and medium silt rEMs are missing in the regional and Arctic-wide combinations. Coarse silt rEMs occur in all three regions, with the coarsest silt rEMs occurring in Alaska and the Yakutian inland. Very fine sand rEMs are calculated for sites on the Laptev Sea and East Siberian Sea coasts and for the Yakutian inland but not for Alaska. A medium sand rEM occurs only in the Laptev and East Siberian seas region, while coarse sand rEMs are found in Alaska and the Yakutian inland.
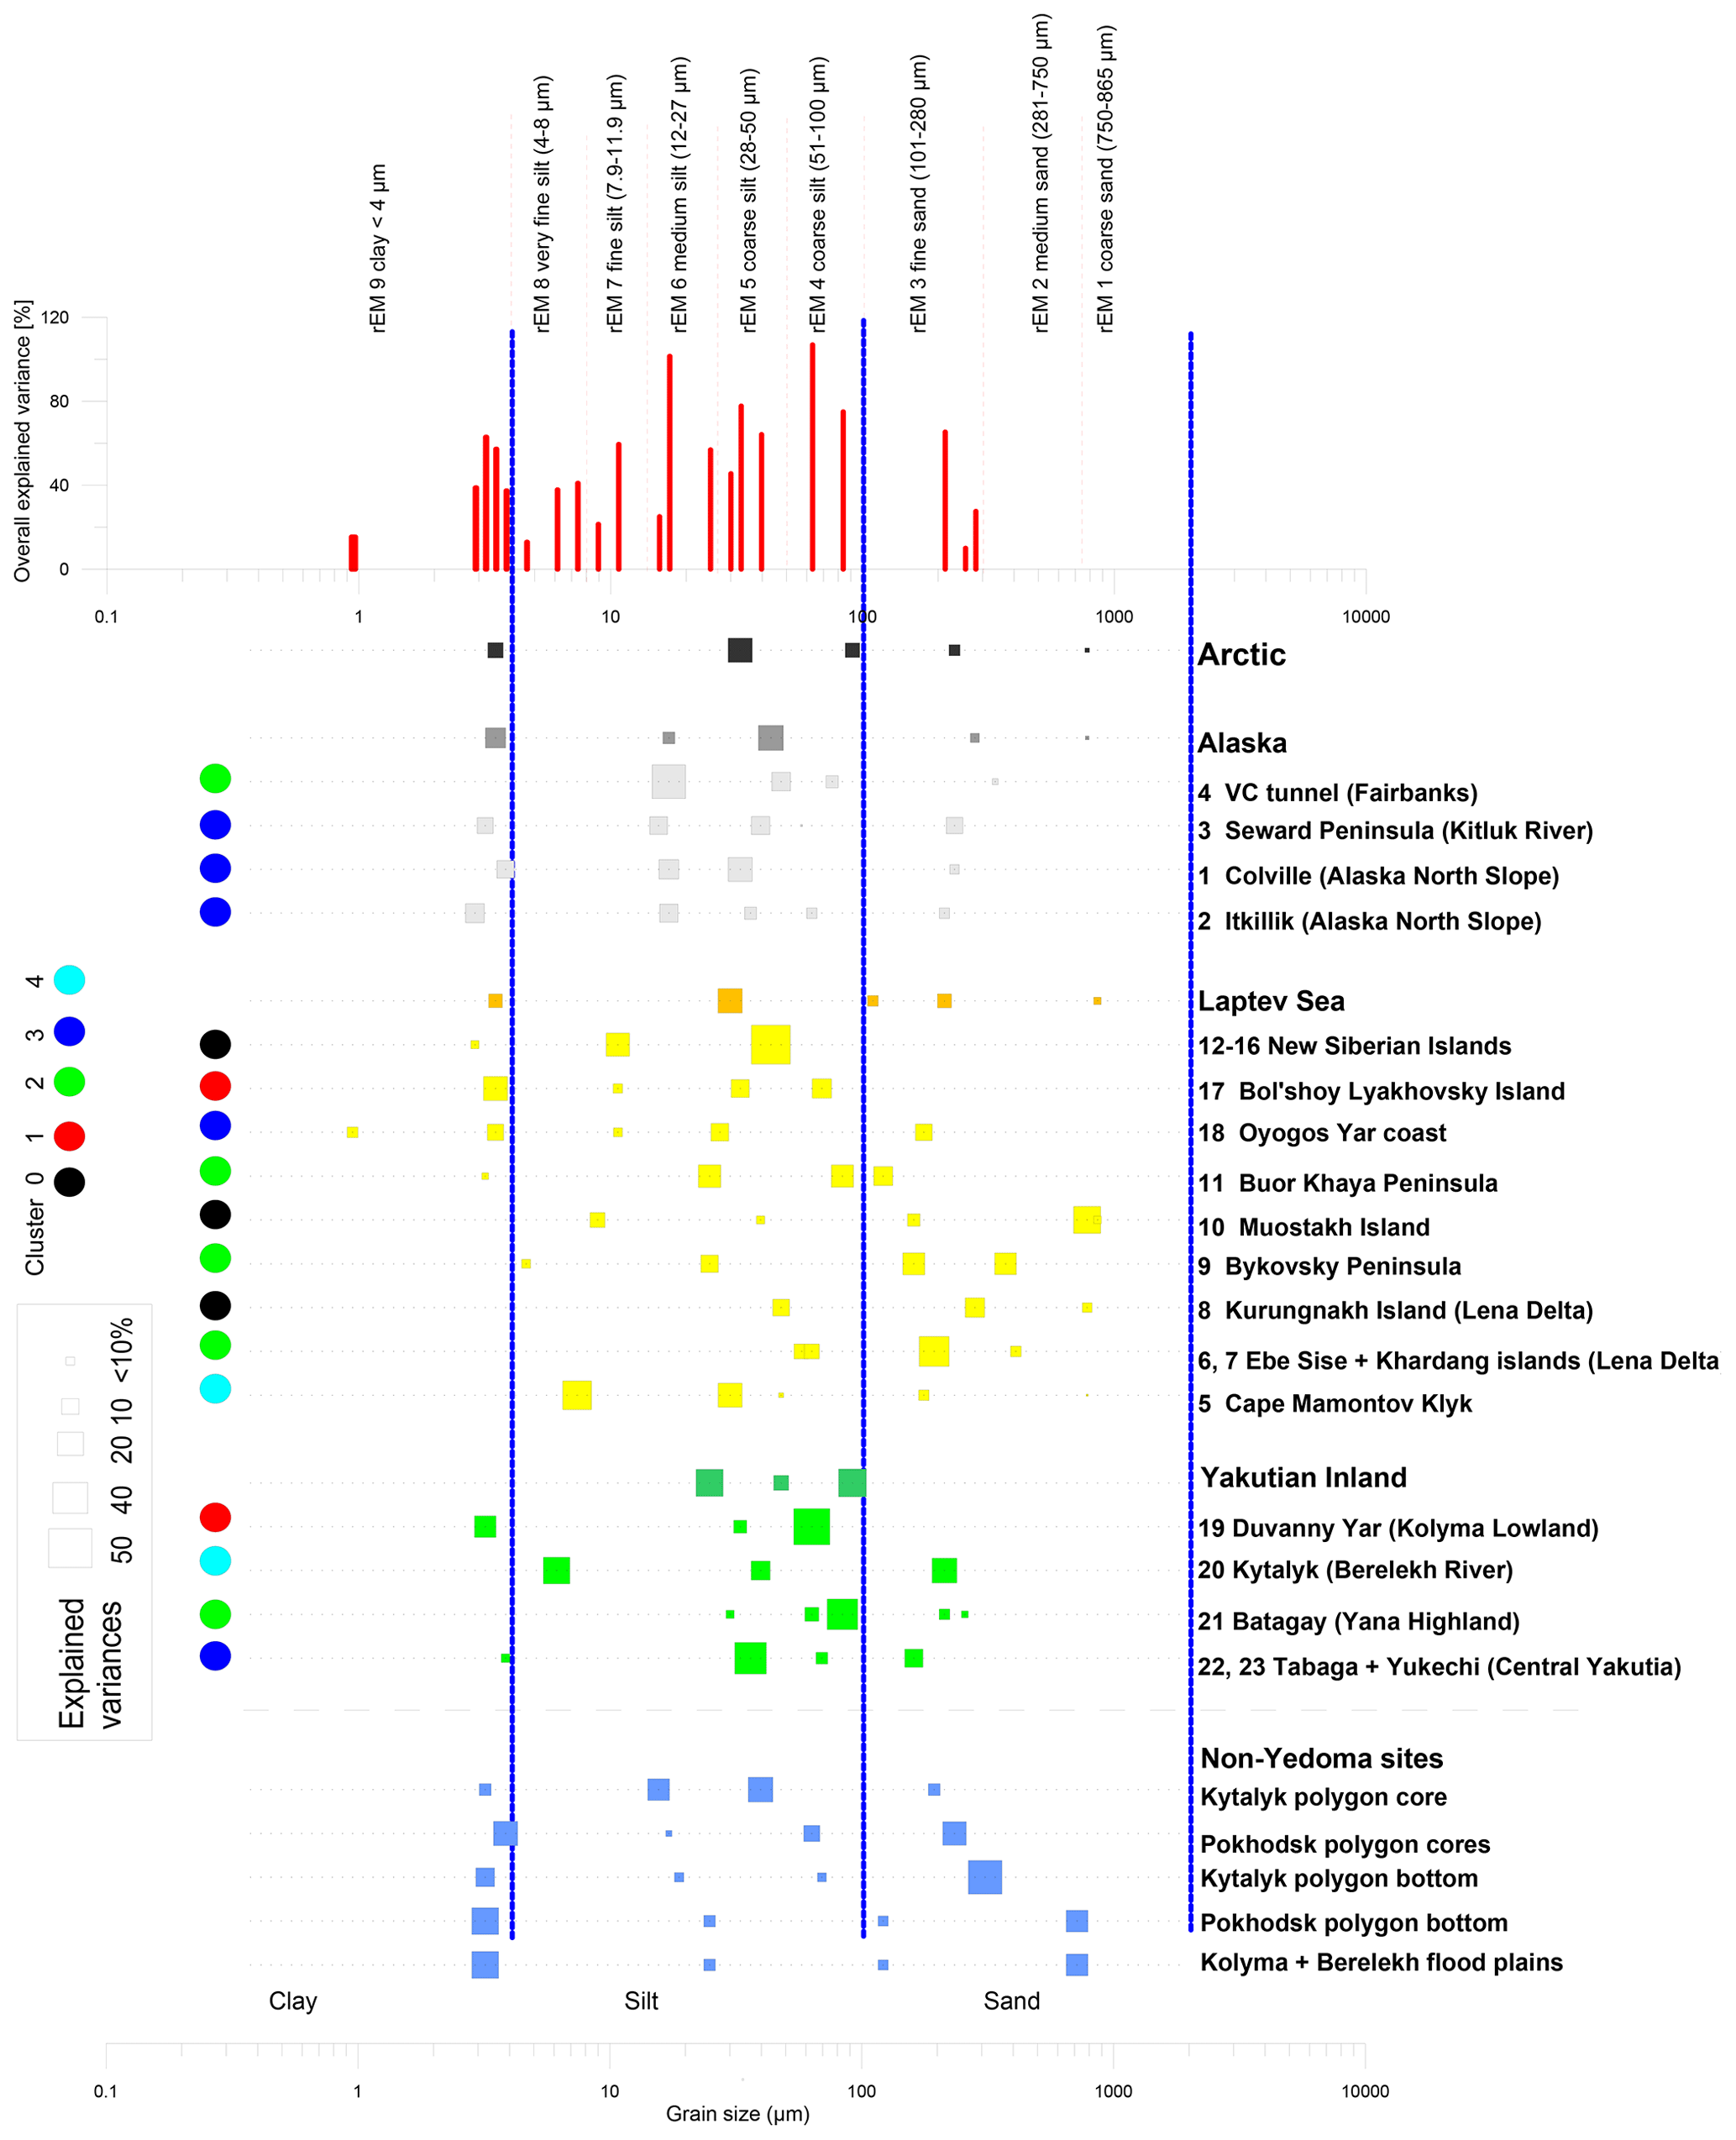
Figure 5Position of the rEMs and their explained variances and the overall explained variance for each calculated rEM in the entire sample collection, the regional and Arctic-wide combinations, and the non-Yedoma references. On the left side the different clusters from the cluster analyses are shown (more details are explained in the text).
3.4 Results of cluster analysis
Clustering the study sites based on the explained variances in the rEMs resulted in four significant clusters and three additional sites that could not be combined into a cluster (Fig. S7.1) according to a corrected, approximately unbiased significance value above 0.9. There are two to five sites in one cluster. The outliers (black in Fig. S7.1) comprise the New Siberian Islands, Muostakh Island, and Kurungnakh Sise Island. Cluster 1 consists of Bol'shoy Lyakhovsky Island and the Duvanny Yar site; cluster 2 includes one Yakutian inland site (Batagay), three sites at the Laptev Sea (Ebe Basyn Sise and Khardang Sise, Bykovsky, Buor Khaya) and the Alaskan VC tunnel. All three other Alaskan sites fall into cluster 3, together with two Siberian sites from the Laptev Sea coast (Oyogos Yar) and the Yakutian inland (Tabaga and Yukechi). Finally Cluster 4 consists of Kytalyk and Cape Mamontov Klyk, both in the Laptev Sea region. The sites that cluster together are often hundreds or thousands of kilometers away from each other and have no common geological history, source rocks, or typical distances to late Pleistocene glaciers.
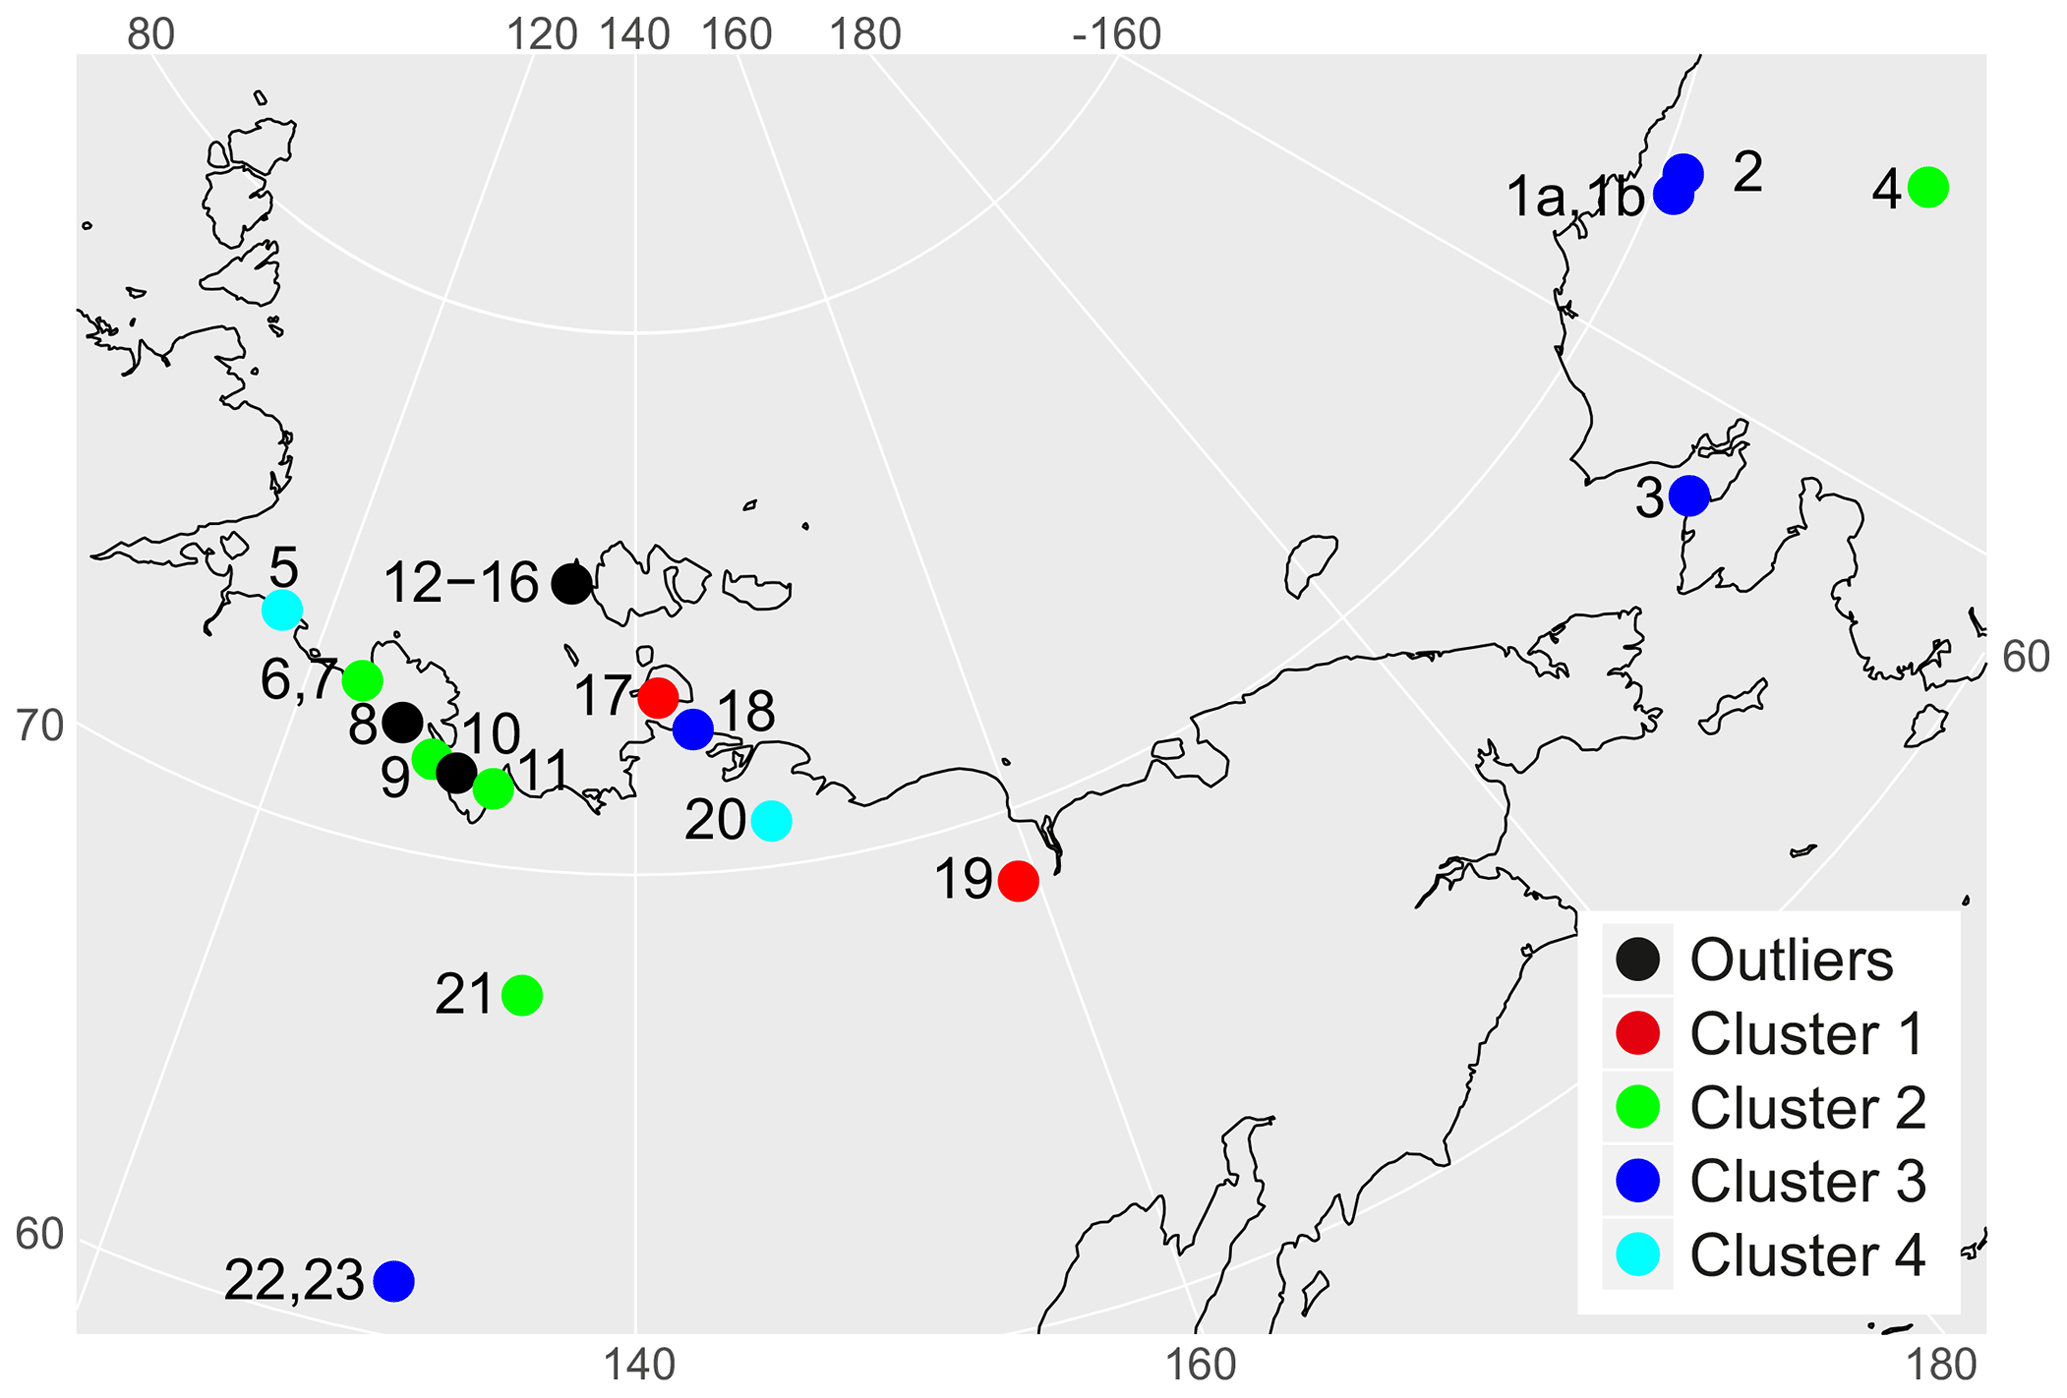
Figure 6Distribution of the clustered sites in Beringia according to the hierarchical cluster analyses (Fig. S7.1). Location numbers are explained in Table 1. The color codes of the legend denote the cluster corresponding to Fig. S7.2.
The clusters that include Siberian sites are more or less randomly distributed (Fig. 6), indicating that grouping of sites is determined by factors other than geographical location. Instead, clusters show a typical rEM composition. Cluster 1 lacks the coarse rEMs 1–3, the medium silt rEM 6, and very fine silt rEM 8, while cluster 4 is dominated by the coarser rEMs 1, 3, and 5 and a distinctive contribution of rEM 8. Cluster 3, like cluster 1, lacks the coarse rEMs 1 and 2 and the very fine silt rEM 8. Cluster 2 only lacks the coarse sand rEM 1 and the fine silt rEM 7. Statistically significant differences between the clusters are evident for the rEMs with main modes in the very fine sand and very fine silt classes (rEMs 4 and 8; p values ≤0.05; Fig. S7.2).
4.1 Interpretation of endmember modeling analyses
The multimodal GSD curves of Yedoma deposits from the studied sites of the Laptev Sea region, from Alaska, and from the Yakutian inland indicate a wide range of contributing grain-size subpopulations that could be unmixed by a rEMMA. Grain-size characteristics and contributing rEMs differed within the horizons of a site as well as between study sites, confirming the results of heterogeneous GSDs across the Yedoma region (Schirrmeister et al., 2011).
These subpopulations likely reflect different sediment production, transport, depositional, and postdepositional processes. Here, we interpret the main modes of the nine rEMs that cluster in similar grain-size classes across sites (Table 2, Fig. 5), suggesting that common processes were involved in Yedoma formation. The main assumption is that higher energy is required to mobilize and transport coarser compared to finer sediment. We consider fluvial deposits from large streams and from temporary meltwater creeks as similarly important parts of the periglacial sediments that comprise Yedoma deposits, as are deposits from aeolian processes (Murton et al., 2015, 2017; Péwé and Journaux, 1983; Tomirdiaro, 1996).
However, the interpretation of the contributions of rEM subpopulations to the individual sample compositions (i.e., rEM scores) can only occur in general terms, because comparing samples and depositional environments across Yedoma sites is hampered by postdepositional cryogenic processes such as cryoturbation and ground ice formation that complicate assigning an age to individual samples and, hence, their temporal comparison. In addition, due to neotectonics (seismotectonics and isostatic adjustments following the deglaciation), we cannot reconstruct site-specific catchments and ancient fluvial sediment pathways to determine local sediment transport processes.
4.2 Yedoma grain-size endmembers and associated processes
High transport energies are required to move the coarse sand grains (rEM 1) that are found at three sites in the Laptev Sea region, with the highest contributions to the sediment of Muostakh Island deposited ca. 20–39 kyr ago, as well as medium sands (rEM 2) that dominate on three other Laptev Sea islands. The two rEMs found at these sites (explained variance 10.9 % to 55.2 %) point to high-energy processes, i.e., saltation and traction processes, in confined running water such as during strong meltwater runoff, with the medium sands forming the main saltation component (Visher, 1969; Sun et al., 2002; Cockburn and Lamoureux, 2008). Fluvial sands of rEMs 1 and 2 are coarser compared to aeolian sands, from modes in the medium sand (e.g., 200–400 µm; Sun et al., 2002) to coarser sand fractions, and they are more poorly sorted, as occurs, for example, in alluvial fan environments (Tsoar and Pye, 1987; Pendea et al., 2009; North and Davidson, 2012). On the Tibetan Plateau, fluvial sands with modes of around 450 µm appeared as rEMs in lake sediments (Dietze et al., 2014). We cannot assess the ancient topographic position of these coarse-grained deposition sites anymore. Yet, all these sites are located in the vicinity of Permo-Carboniferous sandstone outcrops (Table S2), which could have served as sand sources. Modern pond substrates from modern ice-wedge polygons also exhibit rEM 2 with explained variances of 30.7 % to 47.5 % (Table 2b, Figs. 5, S2.5).
The fine sand rEM 3 between 101 and 280 µm (explained variance 14 % to 51.1 %) was found for 11 sites (Table 2a) in all study regions. Studies of modern snow patches show grain-size means in the same fraction, linking this rEM with niveo-aeolian deposition (Galabala, 1997; Kunitsky et al., 2002), which could have been reworked postdepositionally by runoff below or on top of the snow patch. These rEMs also include the size classes of local aeolian sands that roll and saltate due to strong surface winds (Tsoar and Pye, 1987; Sun et al., 2002; Vandenberghe, 2013; Dietze et al., 2014). When showing a well-sorted rEM distribution, as at the Itkillik, Colville, and Mamontov Klyk sites, these sands could indicate local dune deposits (Tsoar and Pye, 1987; Sun et al., 2002) and/or additional sorting by unconfined alluvial flow (North and Davidson, 2012; Pendea et al., 2009). The rEM 3 explained 14.5 % to 33.5 % of the variance, on average, in the modern polygon tundra samples (Table 2b, Fig. S2.5), suggesting that polygonal structures are ideal sites to retain snow patches and trap local sediments.
Two rEMs fall within the very fine sand to coarse silt fractions (rEM 4, 51–100 µm, explained variance of 3.2 % to 51.1 % and rEM 5, 28–50 µm, explained variance of 11.5 % to 44.8 %). Only two sites (Bykovsky Peninsula, New Siberian Islands) did not exhibit these rEMs. These subpopulations could be explained as fine-grained overbank deposits or settled suspended loads in temporarily flooded sections with small slopes or shallow flow depth (Visher, 1969; Cockburn and Lamoureux, 2008). Accordingly, rEM 4 explains most of the variance in modern floodplain sediment of the Berelekh and the Kolyma rivers (Table 2b) and both rEM 4 and rEM 5 were present in drill cores from ice-wedge polygons (Table 2b, Fig. S2.5). In addition the subpopulation rEM 5 could also be explained as primary or secondary (reworked) aeolian material (Vandenberghe, 2013; Vandenberghe et al., 2018). The disintegration of coarser grains by repeated frost weathering processes (Viran and Binal, 2018) could also contribute to these rEM 4 and 5 fractions. Schwamborn et al. (2012) showed that experimental frost weathering of fine sand samples (63–125 µm) by up to 230 freeze–thaw cycles leads to an increase of up to 25 % in the <63 µm fraction of a sand sample; this process seems likely to occur in ice-rich Yedoma sediments. Snow patches could also have acted as sediment traps, forming niveo-aeolian deposits (Galabala, 1997; Kunitsky et al., 2002). The studied snow patch samples from Kunitsky et al. (2002) exhibit an arithmetic mean from 22 to 491 µm (median 10–381 µm). Very fine sand to silt fractions are also characteristic of grain-size subpopulations of dune sand and coarse local dust in present-day arid and periglacial environments (Tsoar and Pye, 1987; Dietze et al., 2014; Vandenberghe, 2013). These rEMs explain most of the grain-size variances at Yakutian inland sites (Table 2a, Fig. 5), where during glacial time a grassy steppe environment (Fradkina et al., 2005a, b; Ashastina et al., 2018) could have provided the surface roughness required for the deposition of sediment from local low-energy floods and/or aeolian transport during storms and short-term near-surface suspension clouds, as described from modern-day periglacial settings (Stauch et al., 2012; Dietze et al., 2014).
Medium silt rEM 6 between 12 and 27 µm with an explained variance between 24.9 % and 47.6 % dominates at six sites and is present in Alaska and the Laptev Sea (Table 2a, Fig. 5). This could be the result of unconfined fluvial and alluvial sediments that settled out of suspension in ponding water, when the Shields stress fell below a critical threshold needed for motion (Dietrich, 1982). Medium silts can either reflect low-energy sediment delivery from the main fluvial suspension component during snowmelt (Sun et al., 2002; Macumber et al., 2018; Cockburn and Lamoureux, 2008; Visher, 1969) or represent coarse regional dust that can remain in suspension for several days during storm events (Tsoar and Pye, 1987; Dietze et al., 2014). The rEM 6 explained 13.4 % to 30.9 % of the explained variance in the modern polygon tundra samples (Table 2b, Fig. S4.5), suggesting that fluvial suspension components contributed to modern and Yedoma deposits.
The fine silt rEM 7 between 8 and 12 µm was present at four sites in the Laptev Sea, on the New Siberian Islands, and in the Dmitry Laptev Strait (Table 2a, Fig. 5) but not in Alaska, the Lena Delta, or the Yakutian inland. Our ice-wedge polygon references do not show this rEM 7. In addition, dust that traveled over distances of several hundred kilometers (Vandenberghe, 2013; Tsoar and Pye, 1969; Dietze et al., 2014) could have accumulated along rough surfaces, similar to other aeolian components (see also experiments on dry dust deposition by Goossens, 2005).
Very fine silt rEM 8 between 4 and 7.9 µm (explained variance between 12.8 % and 40.9 %) occurred at three sites, which are 500 to 1000 km apart from each other (Table 2a). This could have originated from fine silts that were transported in low-energy fluvial suspension for a long time, as could occur in larger streams (e.g., Kytalyk in the Yana-Indigirka Lowland) or in recurring meltwater runoffs which would require still water conditions for the sediments to settle (Tsoar and Pye, 1987; Visher, 1969). On the Kolyma and Berelekh river floodplains, rEM 8 deposits explain 44.2 % of the variance (Table 2b, Fig. S4.5). This rEM 8 could also derive from primary or fluvially reworked background dust (Vandenberghe, 2013; Dietze et al., 2014) or even from primary or fluvially reworked pedogenic clay (Vandenberghe et al., 2018) potentially deposited in polygon ponds such as the polygon structures where the reference samples are from.
Similarly, clays between 1 and 4 µm (rEM 9, explained variance of 9.2 % to 33.9 %), were present at 10 sites (Table 2a, Fig. 5). Similar to the very fine silts, calm water conditions, such as under frozen surfaces of ponds or small lakes, i.e., palustrine conditions, are required for these clays to settle (Cockburn and Lamoureux, 2008; Francus et al., 2008; Dietze et al., 2014). The finest rEM at the Oyogos Yar coast site can only be explained by postdepositional conditions. Clay was formed in situ during pedogenesis (Schirrmeister et al., 2013; Strauss et al., 2017), as it happened during the short but warm summers of the interstadials (Kienast et al., 2005; Andreev et al., 2011). Clays could also be concentrated into polygon ponds by cryogenic reworking; rEM 9 constituted 16.8 % to 38.2 % of the sediment in modern ice-wedge polygon samples (Table 2b, Fig. 5). Hence, frost weathering might have been more important for postdepositional grain disintegration in polygon ponds compared to at dry sites.
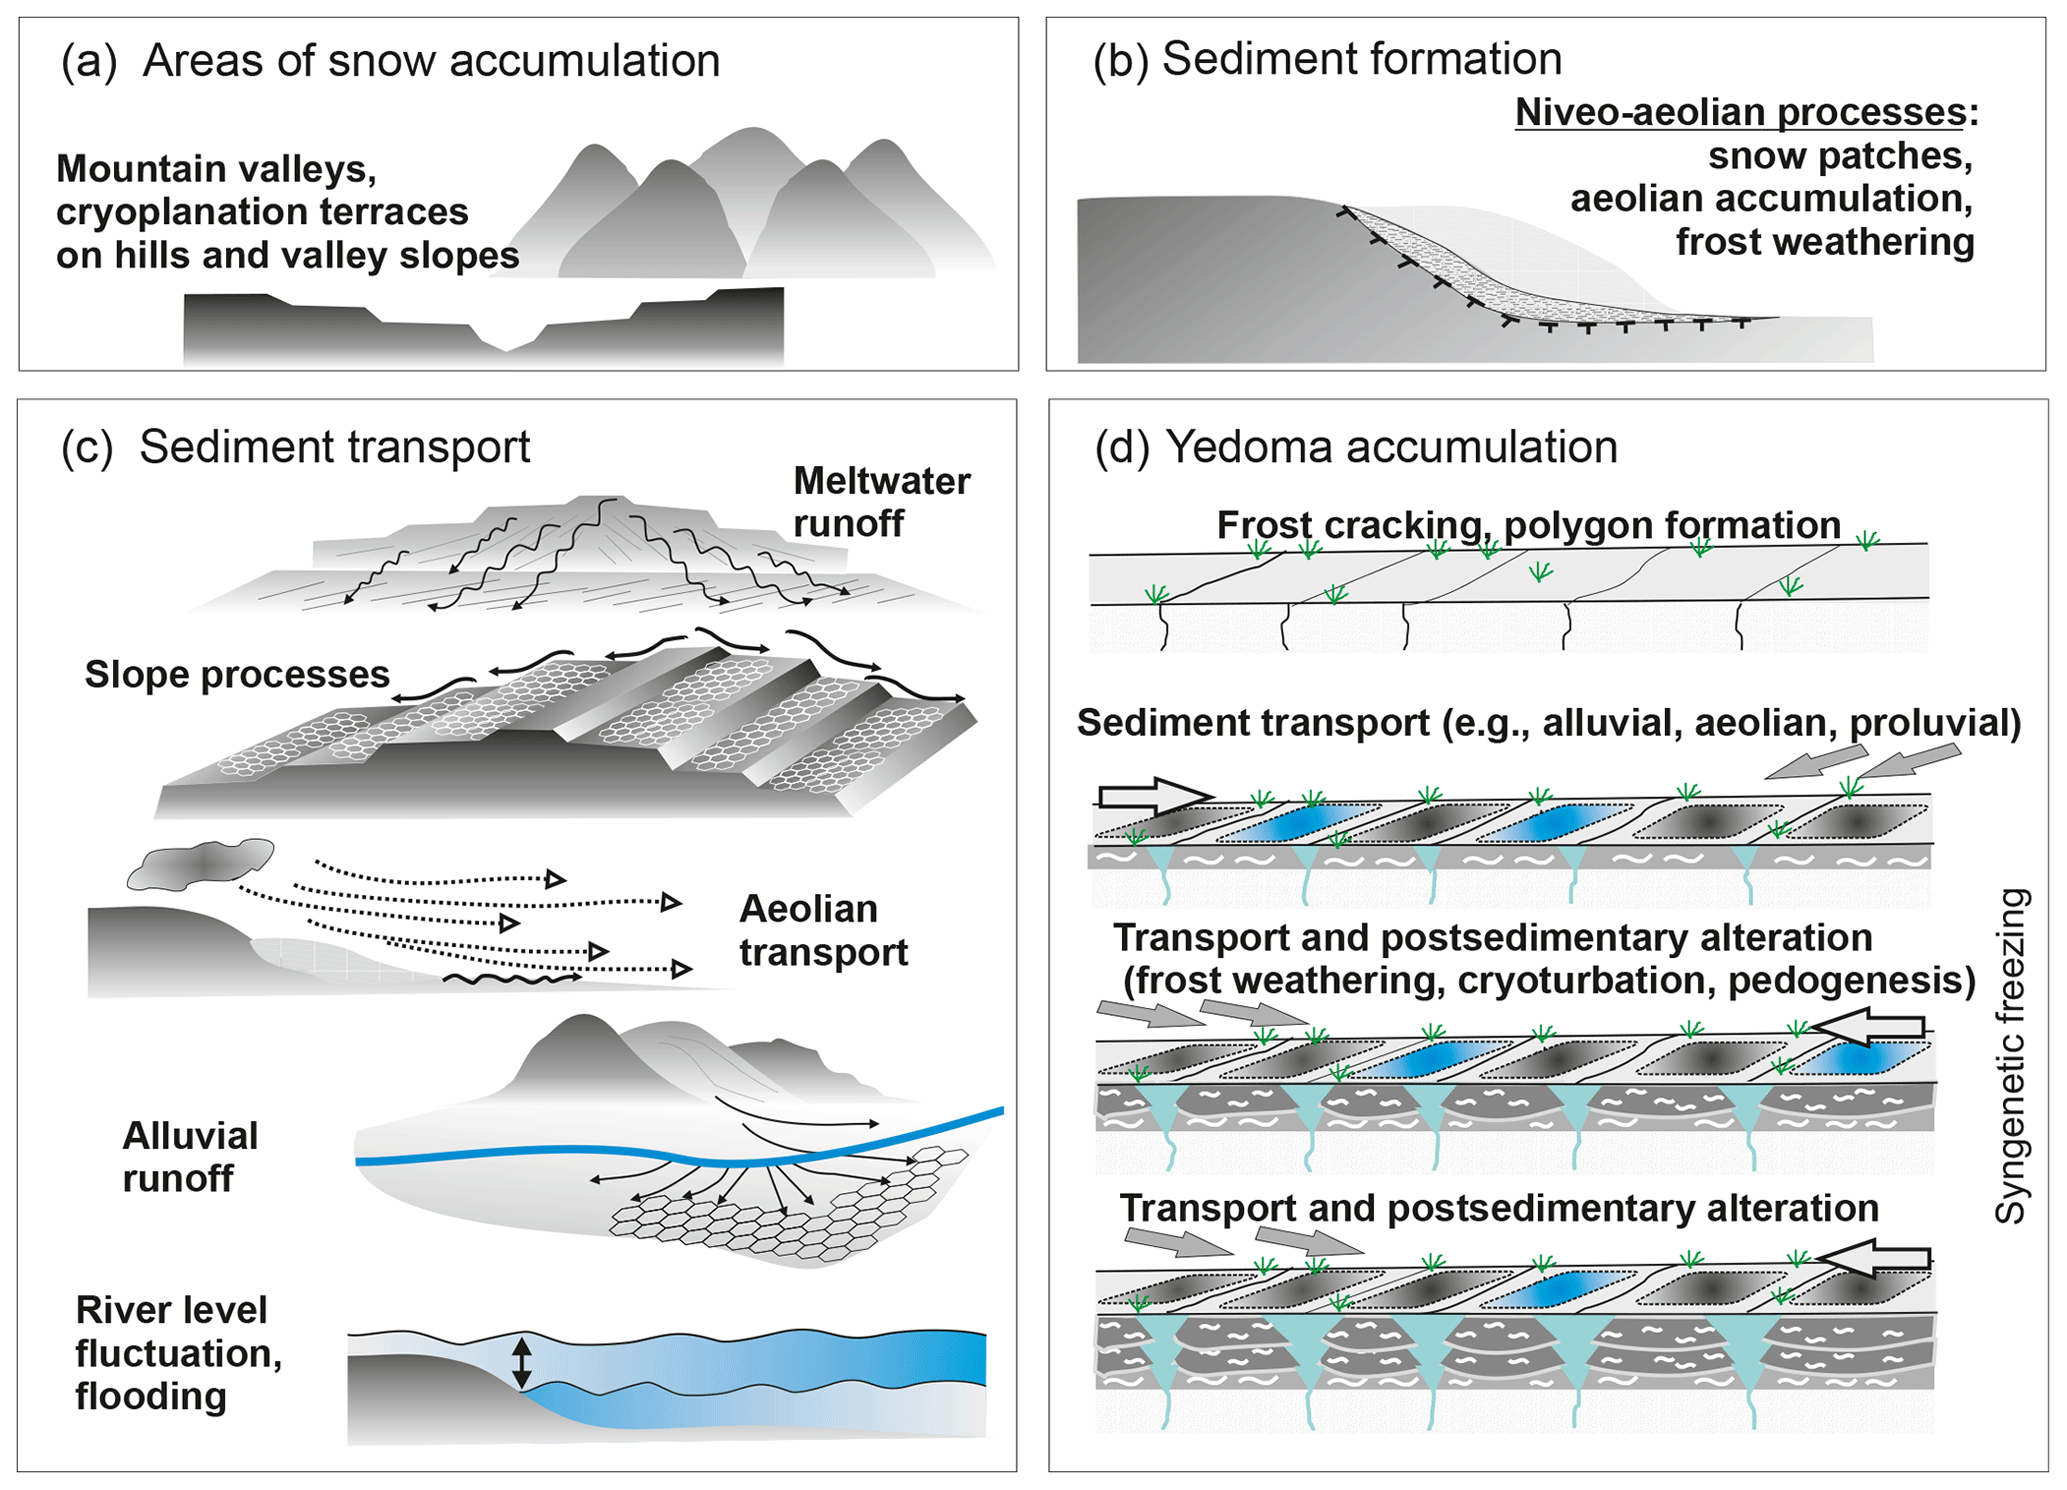
Figure 7The polygenetic origin of Yedoma Ice Complex including (a) primary accumulation areas, (b) sediment formation, (c) sediment transport, and (d) accumulation including postsedimentary alteration (modified after Schirrmeister et al., 2013).
4.3 Synthesis
Overall, various Yedoma types exist across the large region where Yedoma occurs (Fig. 6), ranging from spatially confined Yedoma valley fills along, for example, the Lena, Yana, Indigirka, and Kolyma rivers to vast accumulation plains on Arctic lowlands and shelves. Cluster analyses revealed four distinct site clusters, each comprised of two to five sites that are distributed across Siberia. Yet the three major regions, Alaska, the Laptev and East Siberian seas, and Yakutian inland, could not be differentiated by unique rEM configurations. Accordingly, rEM modes did not show a distinct regional or Arctic-wide pattern.
The large variety and spread of rEMs from very coarse to very fine grain sizes suggests different source areas and different transport and depositional processes that act along the sediment cascades from source rock to final deposition and subsequent reworking (Fig. 7). In cold environments, physical weathering of clayey, silty, and sandy source rocks determines the grain sizes available for transport from local and regional sources. From an energetic point of view grain-size rEMs >250 µm and <2 µm can only be explained by fluvial transport (Dietze et al., 2014, and references therein) or in the case of the <2 µm fraction also by chemical weathering. Silts and very fine sands could have derived from several transport and depositional mechanisms that depend on shear stress and shear velocities modified by surface roughness, grain densities, cohesiveness, and other properties of the transport medium such as water flow depth or wind fields (Tsoar and Pye, 1987; Visher, 1969; Dietrich, 1982; Vandenberghe, 2013; Dietze et al., 2014). In the Yedoma samples, we find a link, in that sites of coarser rEMs tend to be located close to sandy source rocks. Yet de facto fluvial–alluvial catchment areas and fluvial pathways are difficult to constrain for our sites and samples due to isostatic neotectonics during the Holocene and seismotectonics in modern times (e.g., Franke et al., 2000; Grigoriev et al., 1996). Therefore, the identification of specific catchments as sources of fluvial and aeolian deposits is not possible without further, for example mineralogical, information. Yet, both local to regional fluvial and aeolian transport and depositional processes are represented by several rEMs, especially in deposits of the periglacial environments of MIS 2 and 3 during the late Pleistocene (Fig. 7). For example, the trapping of all types of aeolian sediment in snow patches, forming niveo-aeolian deposits (Bateman, 2013), is supported by snow patch samples from Kunitsky et al. (2002) that showed arithmetic means from 22 to 491 µm.
Yet, the finding of primary grain-size modes across all Yedoma deposits outside the range of classical aeolian deposits (i.e., coarser and finer) supports the hypothesis of a polygenetic origin of Yedoma deposits including alluvial, fluvial, and palustrine processes (Sher, 1997; Schirrmeister et al., 2013; Fig. 7). In addition, further postdepositional processes occur in periglacial environments, such as cryoturbation, mass wasting, solifluction, frost weathering, and reworking (Francus et al., 2008; French, 2018; Bateman, 2013; van Huissteden et al., 2013; Strauss et al., 2012; Dietze et al., 2014; Fig. 7). These processes might have affected the grain-size composition directly via postdepositional disaggregation (e.g., Schwarmborn, 2012) or soil (clay) formation during warmer interstadials (e.g., Munroe and Bockheim, 2001; Ping et al., 2015).
However, the dominance of ground ice and cryostratigraphic and cryolithologic properties in Yedoma deposits is key to understanding the genetic distinction between the Yedoma Ice Complex and other permafrost deposits of alluvial, fluvial, and aeolian origin that did not have a major ground ice component. Various ground-ice-forming processes during and after sediment deposition increase the influence of frost weathering and cryoturbation processes compared to ice-free deposits. These processes can principally affect all grain sizes, with potentially higher contributions to rEM 4 and 5 (see above). Yet, assessing the contribution of secondary cryogenic processes relative to primary sedimentation processes would require further studies that, for example, characterize microstructures on mineral grains (Woronko and Pisarska-Jamroży, 2016) and/or compare with permafrost deposits of low ice content.
Indirectly, all postdepositional sediment reworking processes affect rEM interpretation across larger geographic areas, adding uncertainties to the already large dating uncertainties. Still, the quantification of the contribution of grain-size EMs to Yedoma samples allows us to assess the relative importance of certain sedimentary and postdepositional processes. The four rEM clusters are not related to a certain geographic area. Yet, they are differentiated by a characteristic lack of certain rEMs in the coarse sand, very fine sand, and very fine silt classes, which allows for the characterization of certain types of Yedoma deposits from a granulometric point of view. These types and their full grain-size distributions may help to improve parametrization in a reasonable way in further permafrost modeling and carbon storage estimates.
We applied grain-size endmember modeling to a large pan-Arctic sample data set of GSD data to differentiate between possible sedimentation processes responsible for the formation of Yedoma in Beringia during the late Pleistocene. We characterized up to nine robust grain-size endmembers, or rEMs, within Yedoma Ice Complex deposits. We interpret these rEMs as signals of diverse sedimentation processes, from local to regional aeolian, alluvial, fluvial, nival, and ponding water accumulation, which occurred in a polygonal landscape and likely contributed to the minerogenic process in different Yedoma regions. These deposits were not only frozen into permafrost over thousands of years but also periglacially altered during this time, for example, by in situ frost weathering. The observed variability in grain-size rEMs supports the hypothesis of a polygenetic Yedoma origin involving multiple transport, depositional, and transformation processes. Each Yedoma site had a different rEM composition dominated by silty rEMs, with cluster analyses revealing four distinct rEM composition clusters.
The diversity of Yedoma deposits results from multiple sediment origins and transport and (post)depositional sedimentary processes. This has strong implications for assessments of the role of Yedoma permafrost in the future. Sediment properties such as cryolithologic properties, sediment pore volumes, and field capacities are mediated by grain sizes and are important parameters for modeling, for example, carbon storage capacities, ground ice content, and permafrost thaw rates that are very different in sand-dominated compared to silt- and clay-dominated deposits (Strauss et al., 2013; Langer et al., 2016). Hence, next to ground ice content, future assessments of climate change impacts on circum-Arctic permafrost deposits need to consider the current grain-size compositions that are ultimately determined by past sedimentation histories.
Location descriptions and many data sets have been submitted to PANGAEA:
https://doi.org/10.1594/PANGAEA.877882 (Schirrmeister, 2017a), https://doi.org/10.1594/PANGAEA.877886 (Schirrmeister, 2017b),
https://doi.org/10.1594/PANGAEA.884072 (Schirrmeister et al., 2017a), https://doi.org/10.1594/PANGAEA.877346 (Ashastina et al., 2017a),
https://doi.org/10.1594/PANGAEA.877345 (Ashastina et al., 2017b), https://doi.org/10.1594/PANGAEA.884063 (Schirrmeister et al., 2017b),
https://doi.org/10.1594/PANGAEA.611549 (Schirrmeister, 2007a), https://doi.org/10.1594/PANGAEA.615798 (Schirrmeister, 2007b),
https://doi.org/10.1594/PANGAEA.887933 (Schirrmeister et al., 2018a), https://doi.org/10.1594/PANGAEA.858643 (Schirrmeister et al., 2016),
https://doi.org/10.1594/PANGAEA.880929 (Schirrmeister et al., 2017c) to
https://doi.org/10.1594/PANGAEA.880931 (Schirrmeister et al., 2017d), https://doi.org/10.1594/PANGAEA.880951 (Schirrmeister et al., 2017e),
https://doi.org/10.1594/PANGAEA.887931 (Schirrmeister et al., 2018b), and
https://doi.org/10.1594/PANGAEA.884069 (Schirrmeister et al., 2017f).
The supplement related to this article is available online at: https://doi.org/10.5194/egqsj-69-33-2020-supplement.
LS collected most of the samples over more than the last 20 years and carried out the evaluation of many analyses. ED and HM performed the rEMMA; SL was responsible for preparing the maps. GG, JS, MU, FK, and SW were involved in the sampling during numerous expeditions and evaluated grain-size data for different locations. LS, ED, and HM wrote the manuscript with contributions from all coauthors.
The authors declare that they have no conflict of interest.
This studies are embedded into the Action Group “The Yedoma Region” of the International Permafrost Association (IPA). The studies were supported by several international and national funding organizations of Germany, Russia, the USA, and the EU, listed in detail in the financial support section.
We thank numerous colleagues for supporting our field sampling in Russia and Alaska. We thank Ute Bastian (Kuschel) and Dyke Scheidemann for the laboratory work. The manuscript benefited from English language corrections by Candace O'Connor (Fairbanks, Alaska).
The authors also thank Jef Vandenberghe and two anonymous reviewers for their constructive comments and suggestions.
This research has been supported by the Bundesministerium für Bildung und Forschung (grant nos. 03G0534, 03G0589, 03G0836A, 01DM12011, 03F0806A), the International Association for the Promotion of Cooperation with Scientists from the Independent States of the Former Soviet Union (INTAS (grant no. 05-1000008-8133)), the Deutsche Forschungsgemeinschaft (grant nos. HE 3622/16-1, 164232461; DI 2544/1-1, 419058007; WE4390/7-1, 317774679; UL426/1-1, 232311661; KI 849/4-1; 247453756), the NASA Carbon Cycle Sciences (grant no. NNX08AJ37G), the National Science Foundation Office of Polar Programs (grant no. 0732735), the European Commission, Cordis (PETA-CARB (grant no. 338335)), and the Helmholtz Association (grant no. ERC-0013).
The article processing charges for this open-access
publication were covered by a Research
Centre of the Helmholtz Association.
This paper was edited by Christian Zeeden and reviewed by Jef Vandenberghe and two anonymous referees.
Anderberg, M. R.: Cluster Analysis for Applications, Academic Press, New York, p. 376, ISBN 0120576503, 1973.
Andreev, A. A., Schirrmeister, L., Tarasov, P. E., Ganopolski, A., Brovkin, V., Siegert, C., and Hubberten, H.-W.: Vegetation and climate history in the Laptev Sea region (arctic Siberia) during Late Quaternary inferred from pollen records, Quaternary Sci. Rev., 30, 2182–2199, https://doi.org/10.1016/j.quascirev.2010.12.026, 2011.
Ashastina, K., Schirrmeister, L., Fuchs, M. C., and Kienast, F.: OSL age determination and sedimentological characteristics of the Batagay thaw slump, Northeastern Siberia, PANGAEA, https://doi.org/10.1594/PANGAEA.877346, 2017a.
Ashastina, K., Schirrmeister, L., Scheidemann, D., Fuchs, M. C., and Kienast, F.: Grain size distribution of the Batagay thaw slump, Northeastern Siberia, PANGAEA, https://doi.org/10.1594/PANGAEA.877345, 2017b.
Ashastina, K., Kuzmina, S., Rudaya, N., Troeva, E., Schoch, W. H., Römermann, C., Reinecke, J., Otte, V., Savvinov, G., Wesche, K., and Kienast, F.: Woodlands and steppes: Pleistocene vegetation in Yakutia's most continental part recorded in the Batagay permafrost sequence. Quaternary Sci. Rev., 196, 38–61, https://doi.org/10.1016/j.quascirev.2018.07.032, 2018.
Bartholdy, J., Christiansen, C., and Pedersen, J. B. T.: Comparing spatial grain-size trends inferred from textural parameters using percentile statistical parameters and those based on the log-hyperbolic method, Sediment. Geol., 202, 436–452, https://doi.org/10.1016/j.sedgeo.2007.03.008, 2007.
Bateman, M. D.: Aeolian processes in periglacial environments, in: Treatise on Geomorphology, edited by: Shroder, J., San Diego, CA, Academic Press, 416–429, https://doi.org/10.1016/B978-0-12-374739-6.00219-0, 2013.
Blott, S. J. and Pye, K. A.: GRADISTAT grain size distribution and statistics package for the analysis of unconsolidated sediments, Earth Surf. Processes Landf., 26, 1237–1248, https://doi.org/10.1002/esp.261, 2001.
Cockburn, J. M. H. and Lamoureux, S. F.: Inflow and lake controls on short-term mass accumulation and sedimentary particle size in a High Arctic lake: implications for interpreting varved lacustrine sedimentary records, J. Paleolimnol., 40, 923–942, https://doi.org/10.1007/s10933-008-9207-5, 2008.
Dall'Amico, M., Endrizzi, S., Gruber, S., and Rigon, R.: A robust and energy-conserving model of freezing variably-saturated soil, The Cryosphere, 5, 469–484, https://doi.org/10.5194/tc-5-469-2011, 2011.
Dietrich, W. E.: Settling velocity of natural particles, Water Resour. Res., 18, 1615–1626, https://doi.org/10.1029/WR018i006p01615, 1982.
Dietze, E. and Dietze, M.: Grain-size distribution unmixing using the R package EMMAgeo, E&G Quaternary Sci. J., 68, 29–46, https://doi.org/10.5194/egqsj-68-29-2019, 2019.
Dietze, E., Hartmann, K., Diekmann, B., IJmker, J., Lehmkuhl, F., Opitz, S., Stauch, G., Wünnemann, B., and Borchers, A.: An end-member algorithm for deciphering modern detrital processes from lake sediments of Lake Donggi Cona, NE Tibetan Plateau, China, Sediment. Geol., 243–244, 169–180, https://doi.org/10.1016/j.sedgeo.2011.09.014, 2012.
Dietze, E., Maussion, F., Ahlborn, M., Diekmann, B., Hartmann, K., Henkel, K., Kasper, T., Lockot, G., Opitz, S., and Haberzettl, T.: Sediment transport processes across the Tibetan Plateau inferred from robust grain-size end members in lake sediments, Clim. Past, 10, 91–106, https://doi.org/10.5194/cp-10-91-2014, 2014.
Ehlers, J., Gibbard, P. L., and Hughes, P. D.: Quaternary Glaciations – Extent and Chronology: a Closer Look, Developments in Quaternary Science, vol. 15, Elsevier, Amsterdam, available at: https://booksite.elsevier.com/9780444534477, last access: 2011.
ETOPO2: National Geophysical Data Center, NESDIS, NOAA, U.S. Department of Commerce, 2-minute Gridded Global Relief Data (ETOPO2) v2, https://doi.org/10.7289/v5j1012q, 2006.
Folk, R. L. and Ward, W. C.: A study in the significance of grain-size parameters, J. Sediment. Petrol., 27, 3–26, https://doi.org/10.1306/74D70646-2B21-11D7-8648000102C1865D, 1957.
Fradkina, A. F., Alekseev, M. N., Andreev, A. A., and Klimanov, V. A.: East Siberia, in: Cenozoic Climatic and Environmental Changes in Russia, edited by: Velichko, A. A. and Nechaev, V. P., The Geological Society of America Special Paper, 382, 89–103, 2005a.
Fradkina, A. F., Grinenko, O. V., Laukhin, S. A., Nechaev, V. P., Andreev, A. A., and Klimanov, V. A.: North-eastern Asia, in: Cenozoic Climatic and Environmental Changes in Russia, edited by: Velichko, A. A. and Nechaev, V. P., The Geological Society of America Special Paper, 382, 105–120, 2005b.
Francus, P., Bradley, R., Lewis, T., Abbott, M., Retelle, M., and Stoner, J.: Limnological and sedimentary processes at Sawtooth Lake, Canadian High Arctic, and their influence on varve formation, J. Paleolimnol., 40, 963–985, https://doi.org/10.1007/s10933-008-9210-x, 2008.
Franke, D., Hinz, K., Block, M., Drachev, S. S., Neben, S., Kos'ko, M. K., Reichert, C., and Roeser, H. A.: Tectonics of the Laptev Sea Region in Northeastern Siberia, Polarforschung, 68, 51–58, 2000.
French, H. M.: The Periglacial Environment, 4th Edition, Wiley, Chichester, UK, and Hoboken, New Jersey, 544 pp., 2018.
Galabala, R. O.: Pereletki and the initiation of glaciation in Siberia, Quaternary Int., 41–42, 27–32, https://doi.org/10.1016/S1040-6182(96)00033-X, 1997.
Goossens, D.: Quantification of the dry aeolian deposition of dust on horizontal surfaces: an experimental comparison of theory and measurements, Sedimentology, 52, 859–873, https://doi.org/10.1111/j.1365-3091.2005.00719.x, 2005.
Grigoriev, M. N., Imaev, V. S., Koz'min, B. M., Kunitski, V. V., Larionov, A. G., Mikulenko, K. I., Skryabin, R. M., and Timirshin, K. V.: Geology, seismicity and cryogenic processes in the arctic areas of western Yakutia, 80, Scientific Center SD RAS, Yakutsk, 1996 (in Russian).
Hultén, E.: Outline of the History of Arctic and Boreal Biota during the Quaternary Period, Bokförlags aktiebolaget Thule, Stockholm, 168 pp., 1937.
Kanevskiy, M., Shur, Y., Fortier, D., Jorgenson, M. T., and Stephani, E.: Cryostratigraphy of late Pleistocene syngenetic permafrost (yedoma) in northern Alaska, Itkillik River exposure, Quaternary Res., 75, 584–596, https://doi.org/10.1016/j.yqres.2010.12.003, 2011.
Kanevskiy, M., Shur, Y. L., Strauss, J., Jorgenson, M. T., Fortier, D., Stephani, E., and Vasiliev, A.: Patterns and rates of riverbank erosion in the area of ice-rich permafrost (yedoma) in northern Alaska, Geomorphology 253, 370–384, https://doi.org/10.1016/j.geomorph.2015.10.023, 2016.
Kaplina, T. P.: History of the frozen strata of northern Yakutia in the late Cenozoic, in: History of permafrost development in Eurasia, “Nauka” Publishing House, Moscow, 153–181, 1981 (in Russian).
Kienast, F., Schirrmeister, L., Siegert, C., and Tarasov, P.: Palaeobotanical evidence for warm summers in the East Siberian Arctic during the last cold stage, Quaternary Res., 63, 283–300, https://doi.org/10.1016/j.yqres.2005.01.003, 2005.
Kunitsky, V., Schirrmeister, L., Grosse, G., and Kienast, F.: Snow patches in nival landscapes and their role for the Ice Complex formation in the Laptev Sea coastal lowlands, Polarforschung, 70, 53–67, https://doi.org/10.2312/polarforschung.70.53, 2002.
Langer, M., Westermann, S., Boike, J., Kirillin, G., Grosse, G., Peng, S., and Krinner, G.: Rapid degradation of permafrost underneath waterbodies in tundra landscapes-Toward a representation of thermokarst in land surface models, J. Geophys. Res.-Earth Surf., 121, 2446–2470, https://doi.org/10.1002/2016JF003956, 2016.
Lenton, T. M.: Arctic Climate Tipping Points, Ambio, 41, 10–22, https://doi.org/10.1007/s13280-011-0221-x, 2012.
Macumber, A. L., Patterson, R. T., Galloway, J. M., Falck, H., and Swindles, G. T.: Reconstruction of Holocene hydroclimatic variability in subarctic treeline lakes using lake sediment grain-size end-members, The Holocene, 28, 845–857, https://doi.org/10.1177/0959683617752836, 2018.
Muhs, D. R., Ager, T. A., Skipp, G., Beann, J., Budahn, J., and McGeehin, J. P.: Paleoclimatic significance of chemical weathering in loess-derived paleosols of subarctic central Alaska, Arct. Antarct. Alp. Res., 40, 396–411, https://doi.org/10.1657/1523-0430(07-022)[MUHS]2.0.CO;2, 2008.
Munroe, J. S. and Bockheim, J. G.: Soil development in low-arctic tundra of the northern Brooks Range, Alaska, U.S.A., Arct. Antarct. Alp. Res., 33, 78–87, https://doi.org/10.2307/1552280, 2001.
Murton, J. B., Goslar, T., Edwards, M. E., Bateman, M. D., Danilov, P. P., Savvinov, G. N., and Gubin, S. V.: Palaeoenvironmental interpretation of Yedoma silt (Ice Complex) deposition as cold-climate loess, Duvanny Yar, northeast Siberia, Permafrost Periglac., 26, 208–288, https://doi.org/10.1002/ppp.1843, 2015.
Murton, J. B., Edwards, M. E., Lozhkin, A. V., Anderson, P. M., Savvinov, G. N., Bakulina, N., Bondarenko, O. V., Cherepanova, M., Danilov, P. P., Boeskorov, V., Goslar, T., Grigoriev, S., Gubin, S. V., Korzun, J., Lupachev, A. V., Tikhonov, A., Tsygankova, V. I., and Zanina, O. G.: Preliminary paleoenvironmental analysis of permafrost deposits at Batagaika megaslump, Yana Uplands, northeast Siberia, Quaternary Res., 87, 314–330, https://doi.org/10.1017/qua.2016.15, 2017.
North, C. P. and Davidson, S. K.: Unconfined alluvial flow processes: Recognition and interpretation of their deposits, and the significance for palaeogeographic reconstruction, Earth-Sci. Rev., 111, 199–223, 2012.
Palmtag, J. and Kuhry, P.: Grain size controls on cryoturbation and soil organic carbon density in permafrost-affected soils, Permafrost Periglac., 29, 112–120, https://doi.org/10.1002/ppp.1975, 2018.
Pendea, I. F., Gray, J. T., Ghaleb, B., Tantau, I., Badarau, A. S., and Nicorici, C.: Episodic build-up of alluvial fan deposits during the Weichselian Pleniglacial in the western Transylvanian Basin, Romania and their paleoenvironmental significance, Quaternary Int., 198, 98–112, https://doi.org/10.1016/j.quaint.2008.05.002, 2009.
Péwé, T. L.: Origin of the upland silt near Fairbanks, Alaska, Geol. Soc. Am. Bull., 66, 699–724, 1955.
Péwé, T. L.: Quaternary geology of Alaska, U.S. Geological Survey Professional Paper, 835, p. 143, 1975.
Péwé, T. L. and Journaux, A.: Origin and character of loess-like silt in unglaciated south-central Yakutia, Siberia, USSR, US Geological Survey Professional Paper, 1262, p. 46, 1983.
Ping, C. L., Jastrow, J. D., Jorgenson, M. T., Michaelson, G. J., and Shur, Y. L.: Permafrost soils and carbon cycling, SOIL, 1, 147–171, https://doi.org/10.5194/soil-1-147-2015, 2015.
Schirrmeister, L.: Documentation of sediment profile Kha-3, PANGAEA, https://doi.org/10.1594/PANGAEA.611549, 2007a.
Schirrmeister, L.: Documentation of outcrop Mamontovy Khayata, PANGAEA, https://doi.org/10.1594/PANGAEA.615798, 2007b.
Schirrmeister, L.: Cryolitholgical, biogeochemical and geochronological data from Byk_98_Mkh, Bykovsky Peninsula in 1998, Alfred Wegener Institute – Research Unit Potsdam, PANGAEA, https://doi.org/10.1594/PANGAEA.877882, 2017a.
Schirrmeister, L.: Cryolitholgical, biogeochemical and geochronological data from Byk_99_Mkh, Bykovsky Peninsula in 1999, Alfred Wegener Institute – Research Unit Potsdam, PANGAEA, https://doi.org/10.1594/PANGAEA.877886, 2017b.
Schirrmeister, L., Kunitsky, V. V., Grosse, G., Wetterich, S., Meyer, H., Schwamborn, G., Babiy, O., Derevyagin, A. Y., and Siegert, C.: Sedimentary characteristics and origin of the Late Pleistocene Ice Complex on North-East Siberian Arctic coastal lowlands and islands – a review, Quaternary Int., 241, 3–25, https://doi.org/10.1016/j.quaint.2010.04.004, 2011.
Schirrmeister, L., Froese, D., Tumskoy, V., Grosse, G., and Wetterich, S.: Yedoma: Late Pleistocene ice-rich syngenetic permafrost of Beringia, in: The Encyclopedia of Quaternary Science 2nd Edition, vol. 3, edited by: Elias, S. A., Elsevier, Amsterdam, 542–552, 2013.
Schirrmeister, L., Pestryakova, L. A., Schneider, A., and Wetterich, S.: Characteristics of samples obtained during Pokhodsk 2012-2013 campaigns in the joint Russian-German POLYGON Project, PANGAEA, https://doi.org/10.1594/PANGAEA.858643, 2016.
Schirrmeister, L., Grosse, G., Kunitsky, V. V., and Siegert, C.: Sedimentological, biogeochemical and geochronological data from the Lena Delta 2000, PANGAEA, https://doi.org/10.1594/PANGAEA.884072, 2017a.
Schirrmeister, L., Grosse, G., Kunitsky, V. V., and Siegert, C.: Sedimentological, biogeochemical and geochronological data from permafrost deposit Nagym, PANGAEA, https://doi.org/10.1594/PANGAEA.884063, 2017b.
Schirrmeister, L., Grosse, G., Kunitsky, V. V., and Siegert, C.: Sedimentological, biogeochemical and geochronological data from permafrost exposures of the Bol'shoy Lyakhovsky Island (Expedition 1999), site 1TZ, Alfred Wegener Institute – Research Unit Potsdam, PANGAEA, https://doi.org/10.1594/PANGAEA.880929, 2017c.
Schirrmeister, L., Grosse, G., Kunitsky, V. V., and Siegert, C.: Sedimentological, biogeochemical and geochronological data from permafrost exposures of the Bol'shoy Lyakhovsky Island (Expedition 1999), site 3TZ, Alfred Wegener Institute – Research Unit Potsdam, PANGAEA, https://doi.org/10.1594/PANGAEA.880931, 2017d.
Schirrmeister, L., Grosse, G., Kunitsky, V. V., and Siegert, C.: Sedimentological, biogeochemical and geochronological data from permafrost exposures of the Bol'shoy Lyakhovsky Island (Expedition 1999), site R8+50, Alfred Wegener Institute – Research Unit Potsdam, PANGAEA, https://doi.org/10.1594/PANGAEA.880951, 2017e.
Schirrmeister, L., Grosse, G., Kunitsky, V. V., and Siegert, C.: Sedimentological, biogeochemical and geochronological data from permafrost deposit Kurungnakh, PANGAEA, https://doi.org/10.1594/PANGAEA.884069, 2017f.
Schirrmeister, L., Bobrov, A. A., Raschke, E., and Wetterich, S.: Sediment, ground ice, geochronological and paleoecological data from polygon cores in the Siberian Arctic, PANGAEA, https://doi.org/10.1594/PANGAEA.887933, 2018a.
Schirrmeister, L., Bobrov, A. A., Raschke, E., and Wetterich, S.: Sediment data from polygon core in the Siberian Arctic, Alfred Wegener Institute – Research Unit Potsdam, PANGAEA, https://doi.org/10.1594/PANGAEA.887931, 2018b.
Schwamborn, G., Schirrmeister, L., Frütsch, F., and Diekmann, B.: Quartz weathering in freeze-thaw cycles; experiment and application to the El'gygytgyn Crater lake record for tracing Siberian permafrost history, Geografiska annaler Series A, Phys. Geogr., 94, 481–499, https://doi.org/10.1111/j.1468-0459.2012.00472.x, 2012.
Sher, A.: Yedoma as a store of paleoenvironmental records in Beringida, in: Beringian Paleoenvironmental Workshop (abstracts and program), edited by: Elias, S. and Brigham-Grette, J., Ohana Productions, Nepean, ON, Canada, 92–94, 1997.
Sher, A. V., Kuzmina, S. A., Kuznetsova, T. V., and Sulerzhitsky, L. D.: New insights into the Weichselian environment and climate of the East Siberian Arctic, derived from fossil insects, plants, and mammals, Quaternary Sci. Rev., 24, 533–569, https://doi.org/10.1016/j.quascirev.2004.09.007, 2005.
Siegert, C., Schirrmeister, L., and Babiy, O.: The sedimentological, mineralogical and geochemical composition of late Pleistocene deposits from the ice complex on the Bykovsky peninsula, northern Siberia, Polarforschung, 70, 3–11, https://doi.org/10.2312/polarforschung.70.3, 2002.
Stauch, G., Ijmkera, J., Pötsch, S., Zhao, H., Hilgers, A., Diekmann, B., Dietze, E., Hartmann, K., Opitz, S., Wünnemann, B., and Lehmkuhl, F.: Aeolian sediments on the north-eastern Tibetan Plateau, Quaternary Sci. Rev., 57, 71–74, https://doi.org/10.1016/j.quascirev.2012.10.001, 2012.
Strauss, J., Schirrmeister, L., Wetterich, S., Borchers, A., and Davydov, S. P.: Grain-size properties and organic-carbon stock of Yedoma Ice Complex permafrost from the Kolyma lowland, northeastern Siberia, Global Biogeochem. Cycles,, 26, GB3003, https://doi.org/10.1029/2011GB004104, 2012.
Strauss, J., Schirrmeister, L., Grosse, G., Wetterich, S., Ulrich, M., Herzschuh, U., and Hubberten, H.-W.: The deep permafrost carbon pool of the Yedoma region in Siberia and Alaska, Geophys. Res. Lett., 40, 6165–6170, https://doi.org/10.1002/2013GL058088, 2013.
Strauss, J., Schirrmeister, L., Grosse, G., Fortier, D., Hugelius, G., Knoblauch, C., Romanovsky, V., Schädel, C., Schneider von Deimling, T., Schuur, E.A.G., Shmelev, D., Ulrich, M., and Veremeeva, A.: Deep Yedoma permafrost: A synthesis of depositional characteristics and carbon vulnerability, Earth-Sci. Rev., 172, 75–86, https://doi.org/10.1016/j.earscirev.2017.07.007, 2017.
Sun, D., Bloemendal, J., Rea, D. K., Vandenberghe, J., Jiang, F., An, Z., and Su, R.: Grain-size distribution function of polymodal sediments in hydraulic and aeolian environments, and numerical partitioning of the sedimentary components, Sediment. Geol., 152, 263–277, https://doi.org/10.1016/S0037-0738(02)00082-9, 2002.
Suzuki, R. and Shimodaira, H.: Pvclust: an R package for assessing the uncertainty in hierarchical clustering, Bioinformatics, 22, 1540–1542, https://doi.org/10.1093/bioinformatics/btl117, 2006.
Tomirdiaro, S. V.: Palaeogeography of Beringia and Arctida, in: American Beginnings: The Prehistory and Palaeoecology of Beringia, edited by: West, C. F., University of Chicago Press, Chicago and London, 58–69, 1996.
Tsoar, H. and Pye, K.: Dust transport and the question of desert loess formation, Sedimentology, 34, 139–153, https://doi.org/10.1111/j.1365-3091.1987.tb00566.x, 1987.
Ulrich, M., Grosse, G., Strauss, J., and Schirrmeister, L.: Quantifying wedge-ice volumes in Yedoma and thermokarst basin deposits, Permafrost Periglac., 25, 151–161, https://doi.org/10.1002/ppp.1810, 2014.
Ulrich, M., Matthes, H., Schmidt, J., Fedorov, A. N. Schirrmeister, L., Siegert, C., Schneider, B., Strauss, J., and Zielhofer, C.: Holocene thermokarst dynamics in Central Yakutia – A multi-core and robust grain-size endmember modeling approach, Quaternary Sci. Rev., 218, 10–33, https://doi.org/10.1016/j.quascirev.2019.06.010, 2019.
Vandenberghe, J.: Grain size of fine-grained windblown sediment: A powerful proxy for process identification, Earth-Sci. Rev., 121, 18–30, https://doi.org/10.1016/j.earscirev.2013.03.001, 2013.
Vandenberghe, J., Sun, Y., Wang, X., Abels, H. A., and Liu, X.: Grain-size characterization of reworked fine-grained aeolian deposits, Earth-Sci. Rev., 177, 43–52, https://doi.org/10.1016/j.earscirev.2017.11.005, 2018.
van Huissteden, J., Vandenberghe, J., Gibbard, P. L., and Lewin, J.: Periglacial rivers, in: The Encyclopedia of Quaternary Science, 2nd edition, edited by: Elias, A. E. and Mock, C. J., Elsevier, Amsterdam, 490–499, 2013.
Viran, P. A. G. and Binal, A.: Effects of repeated freeze–thaw cycles on physico-mechanical properties of cohesive soils, Arab. J. Geosci., 11, 250, https://doi.org/10.1007/s12517-018-3592-5, 2018.
Visher, G. S.: Grain size distributions and depositional processes, J. Sediment. Res., 39, 1074–1106, https://doi.org/10.4236/ijg.2016.712099, 1969.
Walter Anthony, K. M., Zimov, S. A., Grosse, G., Jones, M. C., Anthony, P. M., Chapin III, F. S., Finlay, J. C., Mack, M. C., Davydov, S., Frenzel, P., and Frolking, S.: A shift of thermokarst lakes from carbon sources to sinks during the Holocene epoch, Nature, 511, 452–456, https://doi.org/10.1038/nature13560, 2014.
Weltje, G. J. and Prins, M. A.: Genetically meaningful decomposition of grain-size distributions, Sediment. Geol., 202, 409–424, https://doi.org/10.1016/j.sedgeo.2007.03.007, 2007.
Woronko, B. and Pisarska-Jamroży, M.: Micro-Scale Frost Weathering of Sand-Sized Quartz Grains, Permafrost Periglac., 27, 109–122, https://doi.org/10.1002/ppp.1855, 2016.